Abstracts
Relationship between spatial distribution of chaetognaths and hydrographic conditions around seamounts and islands off Northeastern Brazil were analyzed from 133 oceanographic stations during the months of January – April of 1997 and April – July of 1998. Oblique zooplankton tows, using 50 cm diameter Bongo nets with 500µm mesh with a flowmeter to determine the filtered volume, were carried out to a maximum of 200m depth. The Superficial Equatorial Water, which had a salinity > 36 PSU and temperature > 20°C, occupied the top 80 to 200m depth. Below this water mass was the South Atlantic Central Water with salinity ranging from 34.5 to 36 PSU and temperature from 6 to 20°C. The community of chaetognaths showed six species: Pterosagitta draco, Flaccisagitta enflata, Flaccisagitta hexaptera, Pseudosagitta lyra, Serratosagitta serratodentata, and Sagitta helenae. Of these species, F. enflata was the most abundant (32.05% in 1997 and 42.18% in 1998) and the most frequent (87.88% in 1997 and 95% in 1998) during both periods. A mesopelagic specie was identified (P. lyra). This specie was more abundant in 1997 (3.42%), when the upwelling was more intense. P. lyra occurred in 22% of the samples during 1997. The abundance of F. enflata, an epiplanktonic species, increased, associated with greater water-column stability.
northeastern Brazil; seamounts; spatial distribution; variability; zooplankton
A relação entre a distribuição espacial de chaetognatha e condições hidrográficas ao redor dos montes submarinos e ilhas oceânicas do nordeste do Brasil foram analisados a partir de 133 estações oceanográficas em janeiro-abril de 1997 e abril-julho de 1998. Foram realizados arrastos oblíquos de zooplâncton, utilizando redes Bongo de 50 cm de diâmetro com malha de 500 µm equipadas com fluxômetro para determinar o volume de água filtrado, foram realizados a uma profundidade máxima de 200m. A Água Equatorial Superficial teve uma salinidade > 36 PSU e temperatura > 20°C, ocupou o pico de 80 a 200m de profundidade. Abaixo desta massa de água estava a Água Central do Atlântico Sul com salinidade variando de 34,5-36 PSU e temperatura de 6 a 20°C. A comunidade de chaetognathas apresentou seis espécies: Pterosagitta draco, Flaccisagitta enflata, Flaccisagitta hexaptera, Pseudosagitta lyra, Serratosagitta serratodentata e Sagitta helenae. Destas espécies, F. enflata foi a mais abundante (32,05% em 1997 e 42,18% em 1998) e frequente (87,88% em 1997 e 95% em 1998) em ambos os períodos. Uma espécie mesopelagica foi identificada (P. lyra). Esta espécie foi mais abundante em 1997 (3,42%), quando a ressurgência foi mais intensa. P. lyra ocorreu em 22% das amostras em 1997. A abundância de F. enflata, uma espécie epiplanctônica, aumentou associada com uma maior estabilidade da coluna de água.
nordeste do Brasil; montes submarinos; distribuição espacial; variabilidade; zooplancton
INTRODUCTION
The relatively isolated phylum Chaetognatha includes a total of 209 species recorded in the world's oceans, of which 29 have been recorded for the South Atlantic. (Bieri 1991Bieri R. 1991. Systematics of the Chaetognatha. In: BONE Q ET AL. (Eds), The Biology of Chaetognaths, Oxford, University Press, Oxford, p. 136-122., Vega-Pérez and Schinke 2011Vega-Pérez LA. and Schinke KP. 2011. Checklist of chaetognatha phyllum from São Paulo State, Brazil. Biota Neotrop 11(1): 1-9.). Exclusively predaceous, chaetognaths are found in marine habitats including estuaries, open oceans, tide pools, polar waters, marine caves, coastal lagoons, and the deep sea (Bone et al. 1991Bone Q, Kapp H and Pierrot-Bults AC. 1991. Introduction and relationship of the group. In: BONE Q ET AL. (Eds), The Biology of Chaetognaths, Oxford University Press, Oxford, p. 1- 4.). The abundance of chaetognaths is often second only to copepods in the zooplankton of many marine environments (Feigenbaum and Maris 1984Feigenbaum D and Maris RC. 1984. Feeding in the Chaetognatha. Ocea and Mar Bio: an annual review 22: 343-392., Shannon and Pillar 1986Shannon LV and Pillar SC. 1986. The Benguela ecosystem: Part III: Plankton. Oceanogr mar biol : an annual review 24: 65-170., Gibbons 1992Gibbons MJ. 1992. Diel feeding and vertical migration of sagitta serratodentata Krohn tasmanica Thomson (Chaetognatha) in the southern Benguela. Jour Plank Res 14: 249-259.). The biomass of chaetognaths is estimated to be 10–30% of that of copepods in the world oceans; thus, they play a significant role in the transfer of energy from copepods to higher trophic levels (Bone et al. 1991Bone Q, Kapp H and Pierrot-Bults AC. 1991. Introduction and relationship of the group. In: BONE Q ET AL. (Eds), The Biology of Chaetognaths, Oxford University Press, Oxford, p. 1- 4.).
Chaetognaths play an important role in marine food webs. Their diet include a variety of pelagic organisms, consisting mainly of copepods, but they may also prey on fish larvae thus impacting the zooplankton and ictioplankton communities (Casanova 1999Casanova JP. 1999. Chaetognatha. In: BOLTOVSKOY D. (Ed), South Atlantic Zooplankton, Vol. 2, Backhuys Publishers, Leiden, p. 1353-1374.). Thirty-nine species have been reported in the South Atlantic so far, between 0 and 60°S (Boltovskoy 2005Boltovskoy D. 2005. Zooplankton of the South Atlantic Ocean. A taxonomic reference work with identification guides and spatial distribution patterns. DVD ROM. World Biodiversity Database Compact Disc Series. ETI Bioinformatics, Multimedia Interactive Software.). Studies on chaetognaths in southeastern Brazil have concentrated on coastal and oceanic waters where these organisms are abundant (Almeida Prado 1968, Vega-Pérez and Liang 1992Vega-Pérez LA and Liang TH. 1992. Feeding of a pelagic chaetognath, Sagitta friderici Ritter-Záhony off Ubatuba region (São Paulo, Brazil). Bol Inst Oceanogr 40(1/2): 93-100., Marazzo and Nogueira 1996Marazzo A and Nogueira CSR. 1996. Composition, spatial and temporal variations of Chaetognatha in Guanabara Bay, Brazil. J Plankton Res 18(12): 2367-2376., Liang and Vega-Pérez 2001Liang TH and Vega-Pérez LA. 2001. Diversity, abundance and biomass of epiplanktonic chaetognath off South Atlantic western sector, from Cabo Frio (23°S, 42°W) to São Pedro and São Paulo Rocks (01°N, 29°W). Oceanides 16(1): 34-48., 2002Liang TH and Vega-Pérez LA. 2002. Distribution, abundance and biomass of Chaetognaths off São Sebastião region, Brazil in February 1994. Braz Jour Oceano 50: 1-12., Vega-Pérez and Schinke 2011Vega-Pérez LA. and Schinke KP. 2011. Checklist of chaetognatha phyllum from São Paulo State, Brazil. Biota Neotrop 11(1): 1-9.). However, chaetognaths can also be found in Brazilian estuaries, as reported by Lansac Tôha and Lima (1993) in the estuary of the Una do Prelado river, by Lira and Magalhães (1996)Lira MCA and Magalhães EMM. 1996. Composição do zooplâncton do Complexo Estuarino- Lagunar Mundaú/Manguaba (Alagoas-Brasil). Bol Est Ciê Mar 9: 31-45. in the Mandaú/Manguaba system in Alagoas, by Lopes (1996)Lopes RM. 1996. Hydrography and Zooplankton Community Structure: A comparative study among estuaries of the Juréia-Itatins Ecological Station (Southeastern Brazil). Nerítica 10: 27-40. in the estuaries of the Juréia-Itatins ecological station, by Montú (1980)Montú M. 1980. Zooplâncton do estuário da Lagoa dos Patos. I. Estrutura e variações temporais e espaciais da comunidade. Atlântica 4: 53-72. in the Patos Lagoon estuary in Rio Grande and by Paranaguá and Nascimento-Vieira (1984)Paranaguá MN and Nascimento-Vieira DA. 1984. Estudo Ecológico da Região de Itamaracá, Pernambuco-Brasil. XXV. Zooplâncton do Rio Botafogo. Tra Oceano 18: 193-206. in the Botafogo river estuary.
The boundaries between geographical provinces for marine taxa tended to occur in association with major oceanographic processes (e.g. upwelling areas, river discharges, main currents, oceanographic fronts) (Macpherson 2003MacPherson E. 2003. Species range size distributions for some marine taxa in the Atlantic Ocean. Effect of latitude and depth. Biol J Linn Soc 80(3): 437-455.).
According to Schleyer (1985)Schleyer MH. 1985. Chaetognaths as indicators of water masses in the Agulhas Current System. Invest Report 61: 1-20., the temporal patterns of distribution and abundance of the chaetognaths can serve to corroborate the variations of the oceanographic parameters. Occasionally mesopelagic species like Sagitta decipiens and Eukrohnia hamata are found in surface waters. These species normally do not reach these layers during their dial migrations, thus their presence has been associated to upwelling events (Bieri 1959Bieri R. 1959. The distribution ofthe planktonics chaetognatha in the Pacific and their relation to the water masses. Limn and Ocea 4(1): 1-28., Fagetti 1968Fagetti E. 1968. Quetognatos de la Expedici!on “Mar Chile I” con observaciones acerca del posible valor de algunas especies como indicadoras de masas de agua frente a Chile. Rev Bio Mar 13(2): 85-153.).
Many chaetognaths species are uniquely affected by the oceanographic conditions of their environment, and they display species-specific relationships to water masses in addition to distinct vertical distribution profiles in the water column (Bieri 1959Bieri R. 1959. The distribution ofthe planktonics chaetognatha in the Pacific and their relation to the water masses. Limn and Ocea 4(1): 1-28., Sullivan 1980Sullivan B. 1980. In situ feeding behavior of Sagitta elegans and Eukrohnia hamata (chaetognatha) in relation to the vertical distribution and abundance of prey at ocean station “P”. Limnol Oceanogr 25(2): 317-326., Terazaki and Miller 1986Terazaki M and Miller CB. 1986. Life history and vertical distribution of pelagic chaetognaths at ocean station P in the subarctic Pacific. Deep-Sea Res PT I 33(3): 323-337., Terazaki 1992Terazaki M. 1992. Horizontal and vertical distribution of chaetognaths in a Kuroshio warm-core ring. Deep-Sea Res PT I 39(Suppl.1): 231-245., Ulloa et al. 2000Ulloa R, Palma S and Silva N. 2000. Bathymetric distribution of chaetognaths and their association with water masses off the coast of Valparaiso, Chile. Deep-Sea Res PT I 47: 2009-2027.). As a result, chaetognaths are often categorized in accordance to the type of water mass to which they are best adapted to (e.g. warm water, cold water, mixed water). The oceanographic features of the waters can also influence aspects of chaetognath ecology, such as growth, sexual development and feeding rate (McLaren 1963Mclaren IA. 1963. Effects of temperature on growth of zooplankton, and the adaptive value of vertical migration. J Fish Res Board Can 20: 685-727., Feigenbaum 1982Feigenbaum D. 1982. Feeding by the chaetognath, Sagitta elegans, at low temperaturesin Vineyard Sound, Massachusetts. Limn and Ocean 27: 699-706.).
The objective of this study was to describe for the first time the spatial distribution of chaetognaths around of seamounts and islands off Northeastern Brazil. The results also provide information about variability of chaetognaths with relation to water masses. Additionally, the hypothesis that the composition and abundance of chaetognaths vary depending on the environmental conditions was tested.
Study Area
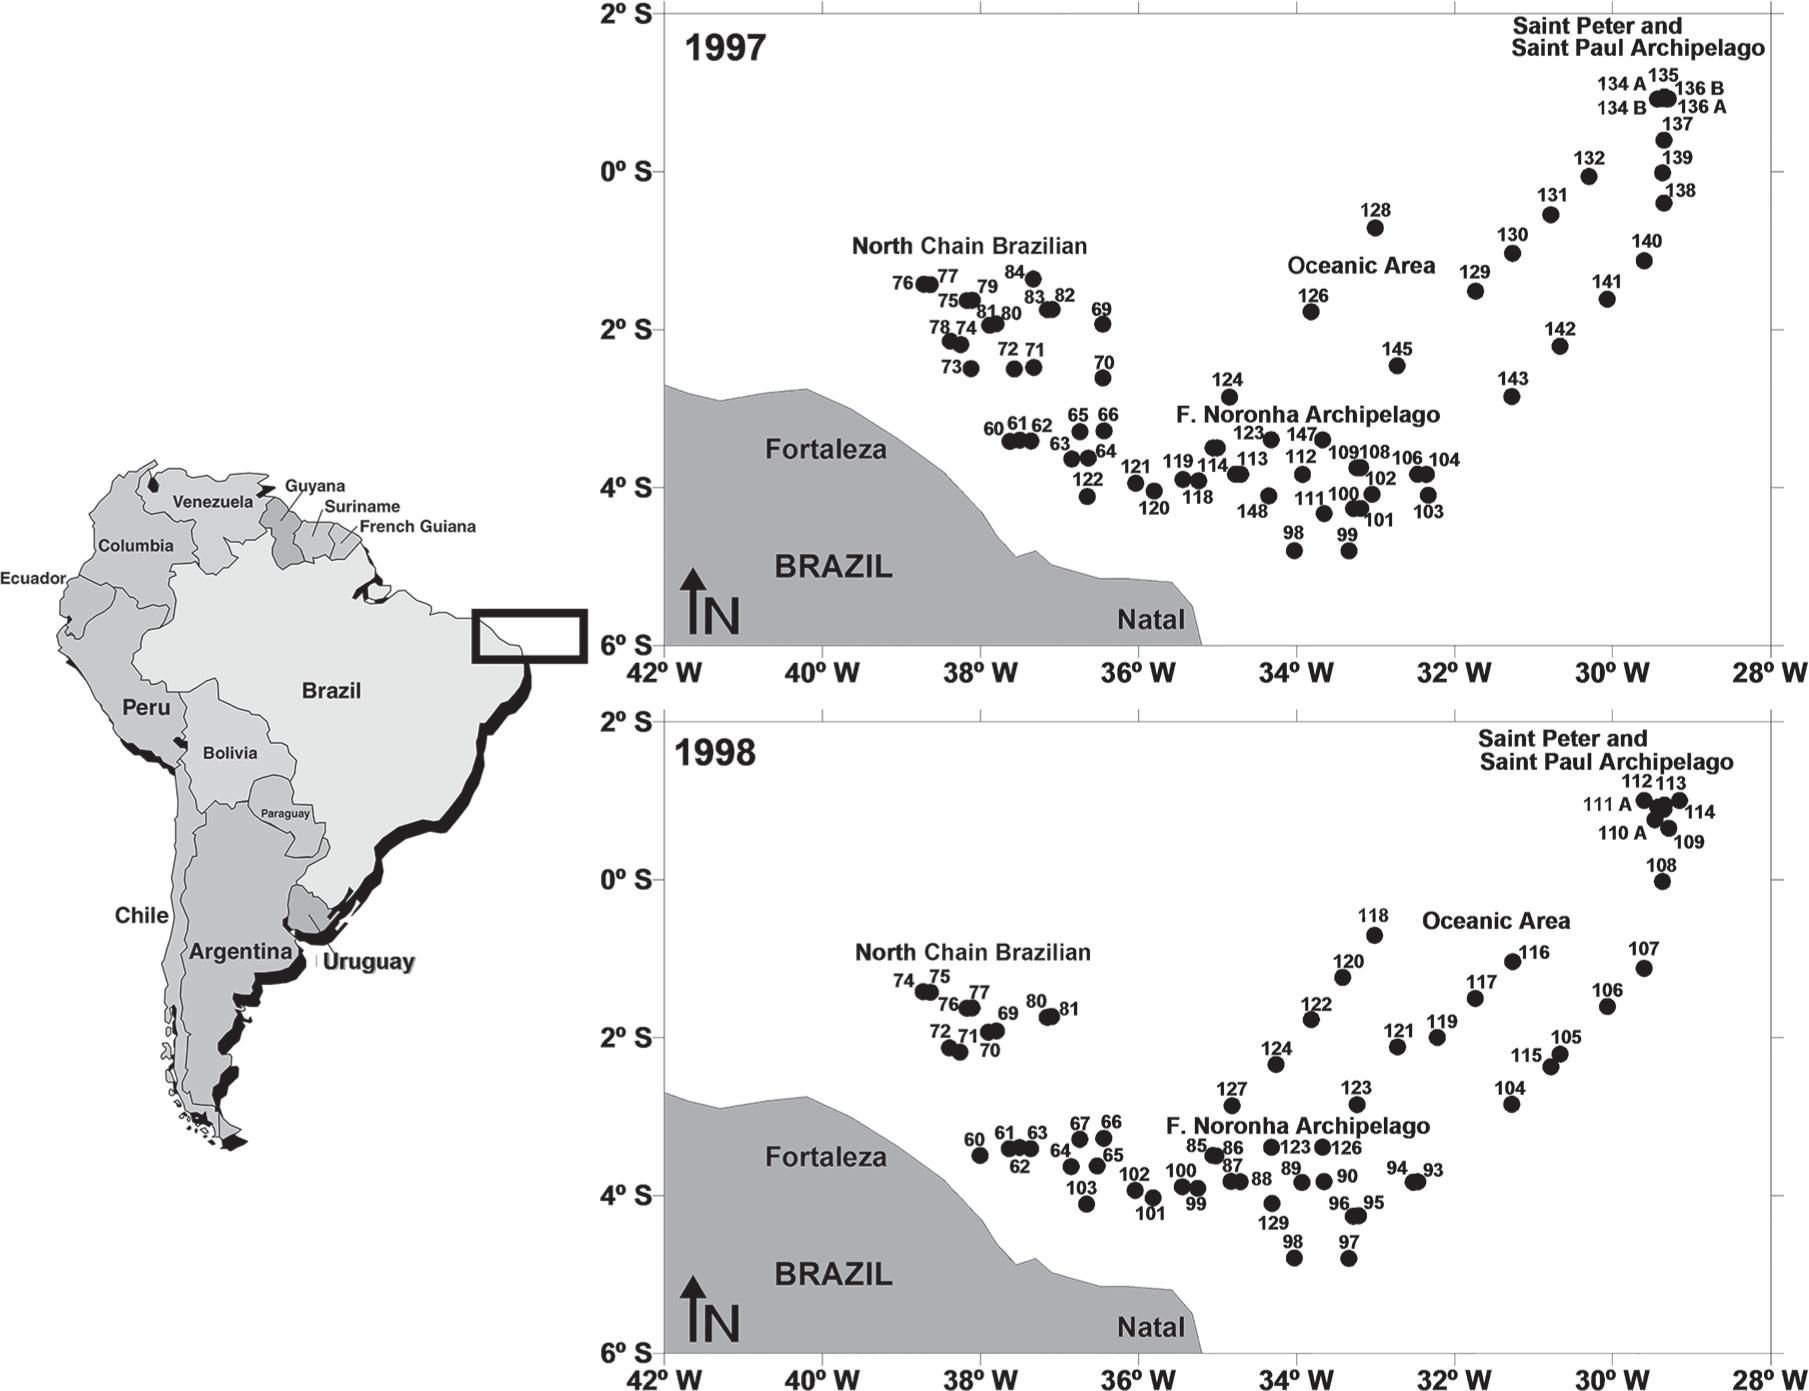
The study area is located in the Atlantic Ocean off Northeast of Brazil (Lat. 0° and 6° S) and is comprised of four areas (Figure 1):
-
St. Peter and St. Paul Archipelago: located at 0° 56.2′ N and 29° 20.6′ W. The two largest islands (Belmonte and Challenger) are less than 100x50m with an elevation of 20m above sea level.
-
Fernando de Noronha Chain: located from 3° S to 5° S and 32° W to 38° W comprising the Fernando de Noronha Archipelago, Rocas Atoll and several large seamounts, including Sírius (depth at the summit of 60 to 90m) and Guará (depth at the summit of 230m).
-
North Brazilian Chain: located from 1° S to 3° S and 37° W to 39° W and encompassing several seamounts, of which the Aracati is the largest with a summit area of 35 x 20m.
-
Oceanic area: located from 0° S to 2° S and 30° W to 34° W.
The main oceanic currents influencing these areas are the South Equatorial Current (SEC) and the North Brazil Current (NBC), both flowing at the surface, and the Equatorial Undercurrent (EUC) flowing along the sub-surface layer (Richardson and McKee 1984Richardson PL and Mckee TK. 1984. Average Seasonal-Variation of the Atlantic Equatorial Currents From Historical Ship Drifts. J Phys Oceanogr 14: 1226-1238., Peterson and Stramma 1991Peterson RG and Stramma L. 1991. Upper-level circulation in the South Atlantic Ocean. Prog Oceanogr 26: 1-73.). Submarine relief (e.g. seamounts and islands) and local current may facilitate the hydrological process.
MATERIALS AND METHODS
A total of 133 samples were collected during two surveys performed between 1997 and 1998. The expeditions were made between the months of January – April of 1997 (Period 1) and April – July of 1998 (Period 2). At each station oblique zooplankton tows were made with a Bongo net of 50cm in diameter and 500µm mesh opening, from 200m depth to the surface. The duration of the tow was 10 minutes. Plankton samples were fixed in seawater with a solution of 4% formaldehyde neutralized with sodium tetraborate. The abundance of individuals in each sample was estimated by the volume of water filtered by net and expressed as individuals per m3. The species identification was done considering the morphological descriptions provided by Boltovskoy (2005)Boltovskoy D. 2005. Zooplankton of the South Atlantic Ocean. A taxonomic reference work with identification guides and spatial distribution patterns. DVD ROM. World Biodiversity Database Compact Disc Series. ETI Bioinformatics, Multimedia Interactive Software., Gusmão (1986)Gusmão LMO. 1986. Recife, Brasil: Universidade Federal de Pernambuco; Chaetognatha planctônicos de províncias nerítica e oceânica do Nordeste do Brasil, p. 1-160. Dissertação (Mestrado). (Não publicado)., Vega-Pérez and Schinke 2011Vega-Pérez LA. and Schinke KP. 2011. Checklist of chaetognatha phyllum from São Paulo State, Brazil. Biota Neotrop 11(1): 1-9. and Avila et al. (2006)Avila LRM, Arruda MR and Bonecker SLC. 2006. Chaetognatha. In: BONECKER S LC (Ed), Atlas de Zooplâncton da Região Central da Zona Econômica Exclusiva Brasileira, Serie Livro; 21, Rio de Janeiro: Museu Nacional, p. 165-184.. Horizontal distribution and abundance patterns were determined for each species.
Seawater samples for the analysis of primary biomass (chlorophyll a) were collected using Nisken Bottles. Chlorophyll a analysis was carried out spectrophotometrically using methods developed from Parsons and Strickland (1963)Parsons TR and Strickland JDH. 1963. Discussion of spectrophotometric determination of marine plankton pigments with revised equations of as certaining chlorophyll a and carotenoids. J Mar Res 21(3): 155-163.. Temperature and salinity were measured using a self-contained Conductivity, Temperature and Depth meter (CTD) (SBE 911 plus).
Data Analyses
In order to analyze the relation between different species and the oceanographic parameters of the sea, temperature-salinity-density diagrams (TSD) were constructed for each species.
A Canonical correspondence analysis (CCA) was made to determine the existing relationships between abundance of the species and the oceanographic variables (temperature, salinity, chlorophyll a). Canonical correspondence analysis (CCA), a unimodal for non-linear multivariate gradient analysis, was employed for this study using the CANOCO program. The Canonical Correspondence Analysis (CCA) used environmental information to constrain a reciprocal averaging ordination between taxa and respective sample (Ter braak 1986).
Non-parametric Mann-Whitney comparison test was employed to verify if there was a statistical significance of the temporal variability on biotic and abiotic factors. In order to determine the statistical significance of the space variability on chaetognath abundance was using Kruskal–Wallis one-way ANOVA with an alpha value of 0.05.
RESULTS AND DISCUSSION
Hydrography and Chlorophyll a
The hydrografical structure and the distributions of chlorophyll a around seamounts and islands off Northeastern Brazil are discussed in more details by Souza et al. (2013)Souza CS, Luz JAG, Macedo S, Montes MJF and Mafalda JR PO. 2013. Chlorophyll a and nutrient distribution around seamounts and islands of the tropical south-western Atlantic. Mar Freshwater Res 64: 168-184.. They present temperature and salinity profiles of single stations as well as temperature and salinity distributions on different transects down to about 400m depth. Henceforth, only a brief summary of the water mass and chlorophyll a distribution is presented.
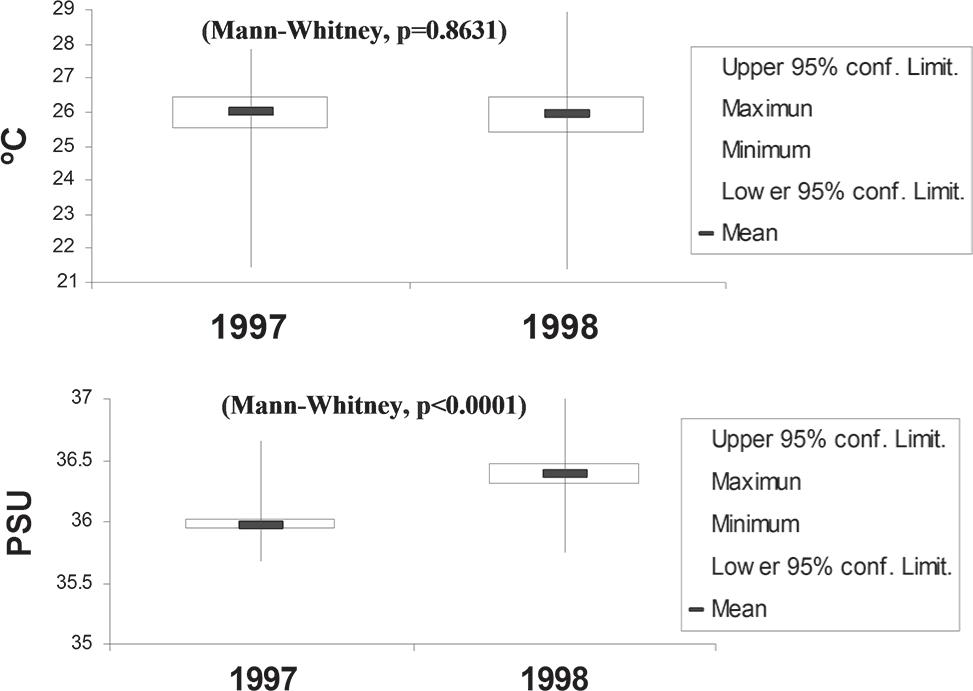
The average water temperature at 1% light penetration was 26.17°C (minimum: 21.94°C, maximum: 27.84°C) during 1997 and 25.90°C (minimum: 21.38°C, maximum: 28.96°C) during 1998 (Figure 2). Average salinity at 1% light penetration was 35.97 PSU, with only small variations (minimum: 35.67, maximum: 36.65) during 1997 and 36.39 PSU (minimum: 35.74, maximum: 37.03) during 1998 (Figure 2). The horizontal distribution of the salinity showed high values in the North Brazilian Chain and Fernando de Noronha Chain and low values in the Saint Peter and Saint Paul Archipelago.
Temporal variation of temperature (°C) and salinity (PSU) for investigated periods (minimum and maximum values: vertical line; mean: horizontal bar; confidence limit: rectangle).
Both parameters revealed some elevated isotherms at the surface waters along the Saint Peter and St. Paul Archipelago and oceanic area during 1997 which might indicate influences of the Archipelago within these layers. Salinity profiles down to 150m showed a slight increase with depth. These present typical distributions encountered on all stations. The thermocline was present throughout the whole area.
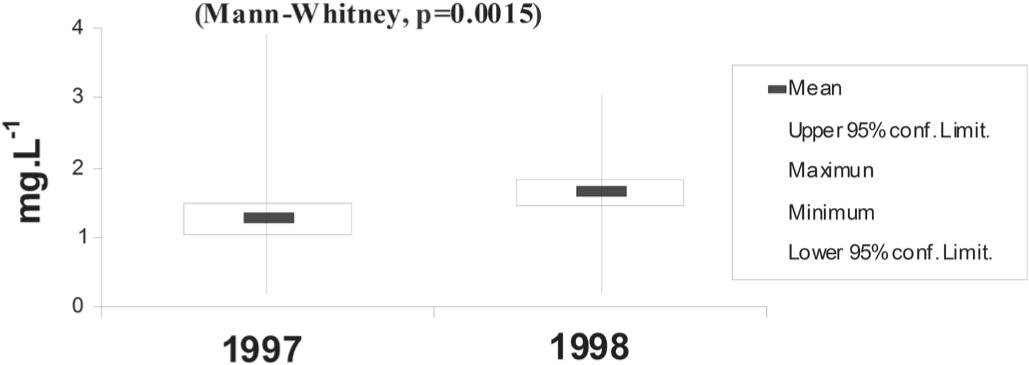
The chlorophyll a fluctuated between 0.19 and 3.91 mg.L–1, with a minimum in 1998 and a maximum in 1997 (Figure 3). In general, the lowest values were observed in the North Brazilian Chain and the highest in the oceanic area and Saint Peter and St. Paul Archipelago.
Temporal variation of chlorophyll a (mg.L–1) for investigated periods (minimum and maximum values: vertical line; mean: horizontal bar; confidence limit: rectangle).
Souza et al. (2013)Souza CS, Luz JAG, Macedo S, Montes MJF and Mafalda JR PO. 2013. Chlorophyll a and nutrient distribution around seamounts and islands of the tropical south-western Atlantic. Mar Freshwater Res 64: 168-184. studied enrichment processes originating in deeper waters. They found evidence of upwelling reaching into the mixed layer and into the euphotic zone, with the mixed layer reaching a depth of 50m. The highest abundances of chlorophyll a coincided with stations where upwelling was recorded by the authors.
Specific Composition
Six species of chaetognaths representing five genera were collected. The species found in the study area were: Pterosagitta draco (Krohn, 1853) (Pterosagittidae), Flaccisagitta enflata Grassi, 1881, Flaccisagitta hexaptera d'Orbigny, 1834, Pseudosagitta lyra Krohn, 1853, Serratosagitta serratodentata Krohn, 1853, and Sagitta helenae Ritter-Záhony, 1910 (Sagittidae). Chaetognath abundances differed significantly across the four sampling regions (Kruskal–Wallis one-way ANOVA, p≤0.001).
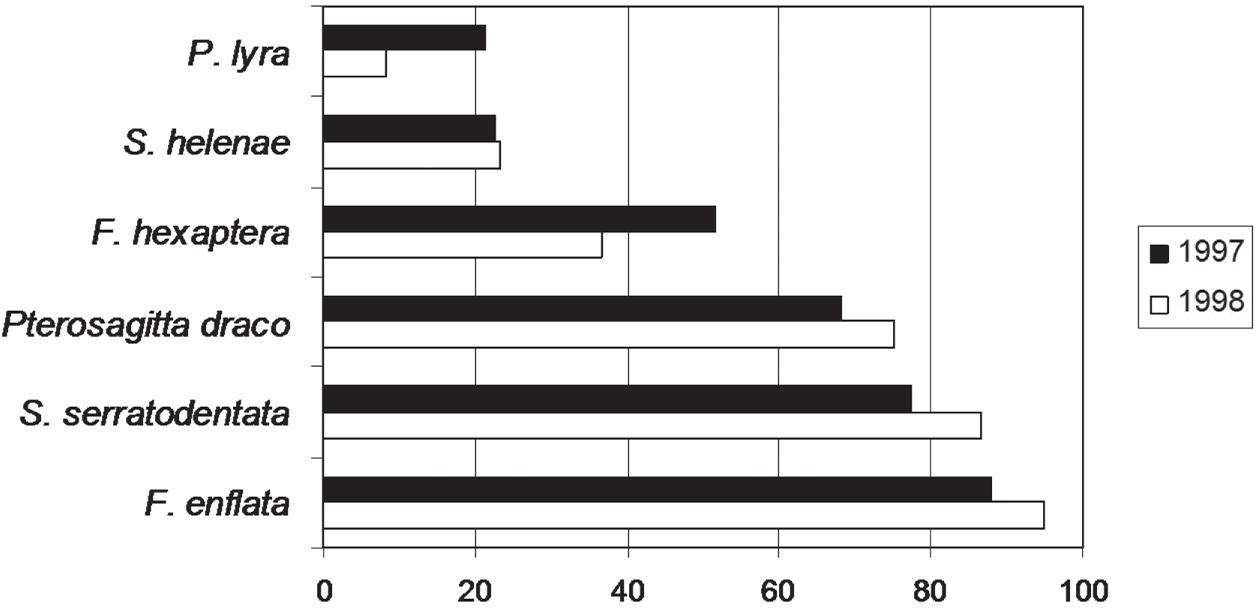
The most abundant species was F. enflata representing 32.05% in 1997 and 42.18% in 1998 of the chaetognaths number, followed by S. serratodentata (29.56% in 1997 and 34.22% in 1998) and Pterosagitta draco (16.80% in 1997 and 12.99% in 1998) (Figure 4). The rest of the species were found in small quantities. All species were captured in both periods.
Temporal relative abundance of chaetognaths species around seamounts and islands off Northeastern Brazil.
The most frequent species in all studied samples was Flaccisagitta enflata with 87.88% in 1997 and 95% in 1998, followed by S. serratodentata (77.27% in 1997 and 86.67% in 1998), Pterosagitta draco (68.18% in 1997 and 75% in 1998) and F. hexaptera (51.52% in 1997 and 36.67% in 1998). Both S. helenae and P. lyra occurred in 22% of the samples during 1997 (Figure 5).
Temporal occurrence frequency of chaetognaths species around seamounts and islands off Northeastern Brazil.
The mean density of chaetognaths was larger in the areas of Fernando de Noronha Chain and Oceanic Area in 1998, and North Brazilian Chain and St. Peter and St. Paul Archipelago in 1997 (Table I), which agrees with the reports for other latitudes (Tokioka 1956Tokioka T. 1956. On chaetognaths and appendicularians collected by Mr. Z. Sagara in the Arafura Sea in May–August 1955. Public Mar Biol Lab 5(2): 203-206., Alvariño 1992Alvariño A. 1992. Distribucion batimetrica, diurna y nocturna, de diez y siete especies de quetognatos, durante las cuatro estaciones del año 1969, en aguas de California y Baja California. Invest Mar 7(1): 1-169., Terazaki 1993Terazaki M. 1993. Seasonal variation and life history of the pelagic chaetognath Sagitta elegans verrill, in Toyama bay, southern Japan Sea. J Plankton Res 15(6): 703-714., Palma and Rosales 1995Palma S and Rosales S. 1995. Composición, abundancia y distribución estacional del macrozooplancton de la bahía de Valparaíso. Invest Mar 23: 49-66., Ulloa et al. 2000Ulloa R, Palma S and Silva N. 2000. Bathymetric distribution of chaetognaths and their association with water masses off the coast of Valparaiso, Chile. Deep-Sea Res PT I 47: 2009-2027.). The results are also in agreement with Fagetti and Fischer (1964)Fagetti EG and Fischer W. 1964. Resultados cuantitativos del zooplancton colectado frente a la costa Chilena por la Expedición “Marchile I”. Montemar 11(4): 137-193., who indicated that regardless of latitude, this group displays seasonal cycles with regards to its abundance.
This also agrees with the distribution pattern described for temperate and polar regions, where the most abundant planktonic populations occur at high water temperature, with lowest abundances at low water temperature (Raymont 1983Raymont J. 1983. Plankton and productivity in the oceans, Zooplankton, Pergamon Press, Oxford, 824 p.). Macpherson (2003)MacPherson E. 2003. Species range size distributions for some marine taxa in the Atlantic Ocean. Effect of latitude and depth. Biol J Linn Soc 80(3): 437-455. found results that suggested that the environmental or biological mechanisms regulating the latitudinal distribution of species have a greater global effect than the mechanisms regulating depth distribution.
The chaetognath species collected around seamounts and islands off Northeastern Brazil were typical for tropical waters and showed little or no deviation from previous reports on studies in waters off Northeastern Brazil (Gusmão 1986Gusmão LMO. 1986. Recife, Brasil: Universidade Federal de Pernambuco; Chaetognatha planctônicos de províncias nerítica e oceânica do Nordeste do Brasil, p. 1-160. Dissertação (Mestrado). (Não publicado)., Cavalcanti and Larrazabal 2004, Neumann-Leitão et al. 2008Neumann-Leitão S, Sant'anna EME, Gusmão LM, Nascimento-Vieira DA, Paranaguá MN and Schwamborn R. 2008. Diversity and distribution of themesozooplankton in the tropical Southwestern Atlantic. J Plankton Res 30(7): 795-805.). The composition of the community as well, in terms of proportional abundance, was not unusual. Vega-Pérez and Schinke (2011)Vega-Pérez LA. and Schinke KP. 2011. Checklist of chaetognatha phyllum from São Paulo State, Brazil. Biota Neotrop 11(1): 1-9. found in the state of SP a specific composition similar reported for other regions of the world and especially to the South-Southeast and Northeast Brazil. F. enflata has been well studied and is frequently the numerically dominant species in lower latitudes and equatorial waters (Giesecke and González 2004Giesecke R and González HE. 2004. Reproduction and feeding of sagitta enflata in the Humboldt Current system off Chile. ICES Jour Mar Sci 65: 361-370.).
Spatial Temporal Distribution
The spatial–temporal distribution of the different species of chaetognaths shows greater densities in the North Brazilian Chain and Fernando de Noronha Chain.
F. enflata was distributed mainly in the North Brazilian Chain in 1997 and in the Fernando de Noronha Chain and oceanic area in 1998 (Figures 6 and 7). Flaccisagitta enflata is an epiplanktonic species (Alvariño 1965Alvariño A. 1965. Chaetognaths. Oceanography and Marine Biology. Annual Review 3: 115-194., Andreéu 1992Andreéu P. 1992. Vertical migration of three coastal species of chaetognaths in the western Mediterranean Sea. Sci Mar 56: 367-372.) with a wide distribution in the Indian Ocean, the Atlantic Ocean and the Pacific Ocean (Pierrot-Bults and Nair 1991Pierrot-Bults AC and Nair VR. 1991. Distribution patterns in Chaetognatha. In: BONE Q ET AL. (Eds), The biology of Chaetognaths, Oxford, Oxford University, p. 86-116.). This species is abundant in oceanic temperate and warm waters found in regions where salinities can vary frequently and markedly (Boltovskoy 2005Boltovskoy D. 2005. Zooplankton of the South Atlantic Ocean. A taxonomic reference work with identification guides and spatial distribution patterns. DVD ROM. World Biodiversity Database Compact Disc Series. ETI Bioinformatics, Multimedia Interactive Software.), has also already been recorded in Brazilian estuaries (Montú 1980Montú M. 1980. Zooplâncton do estuário da Lagoa dos Patos. I. Estrutura e variações temporais e espaciais da comunidade. Atlântica 4: 53-72., Lira and Magalhães 1996Lira MCA and Magalhães EMM. 1996. Composição do zooplâncton do Complexo Estuarino- Lagunar Mundaú/Manguaba (Alagoas-Brasil). Bol Est Ciê Mar 9: 31-45., Lopes 1996Lopes RM. 1996. Hydrography and Zooplankton Community Structure: A comparative study among estuaries of the Juréia-Itatins Ecological Station (Southeastern Brazil). Nerítica 10: 27-40.). In waters of the Indian Ocean, Nair (1978)Nair V. 1978. Bathymetric distribution of chaetognaths in the Indian Ocean. J Mar Bio 7: 276-282. found maximum densities of chaetognaths between 0 and 125m depth, where the dominant species was F. enflata in epipelagic waters.
Distribution and density of the chaetognath species from area around seamounts and islands off Northeastern Brazil during 1997.
Distribution and density of the chaetognath species from area around seamounts and islands off Northeastern Brazil during 1998.
F. enflata is usually the dominant species in regions where it occurs. For example, the proportion of F. enflata in the total chaetognath population was 0.54 in the northern Benguela (Duró et al. 1994Duró A, Gili JM and Andreu P. 1994. Influence of the pycnocline on the vertical migration of chaetognaths in the northern Benguela. Jour Plank Res 16: 1149-1165.); 0.32 and 0.61 in the central equatorial Pacific (Terazaki 1996Terazaki M. 1996. Vertical distribution of pelagic chaetognaths and feeding of Sagitta enyata in the Central Equatorial Pacific. J Plankton Res 18: 673-682.); 0.64 and 0.77 in the western part of the Indian Ocean (Øresland 2000Øresland V. 2000. Diel feeding of the chaetognath sagitta enflata in the Zanzibar Channel, western Indian Ocean. Mar Eco Pro Ser 193: 117-123.) and 0.65 in the southern part of the Adriatic Sea (Batistic 2003Batistic M. 2003. Abundance, biomass, C- and N-content of Flaccisagitta en£ata and Mesosagitta minima (Chaetognatha). Mar Eco 24: 1-13.).
In this study, F. enflata was abundant where salinity was higher. According to Marazzo and Nogueira (1996)Marazzo A and Nogueira CSR. 1996. Composition, spatial and temporal variations of Chaetognatha in Guanabara Bay, Brazil. J Plankton Res 18(12): 2367-2376., it is typical of surface waters and specially abundant at the continental shelf where salinity ranges from 35 to 36. Liang and Vega-Pérez (2001)Liang TH and Vega-Pérez LA. 2001. Diversity, abundance and biomass of epiplanktonic chaetognath off South Atlantic western sector, from Cabo Frio (23°S, 42°W) to São Pedro and São Paulo Rocks (01°N, 29°W). Oceanides 16(1): 34-48. found low densities of F. enflata in the coastal region off Vitória, and observed that this species seemed to be limited to the areas of high salinity values (>36 PSU) found in the tropical waters of the region, since this is a semi-neritic species (Liang and Vega-Pérez 2002Liang TH and Vega-Pérez LA. 2002. Distribution, abundance and biomass of Chaetognaths off São Sebastião region, Brazil in February 1994. Braz Jour Oceano 50: 1-12.).
Serratosagitta serratodentata was found all over the sampling area, being most abundant in the Fernando de Noronha Chain during both periods and in the oceanic area in 1998, having low densities in the North Brazilian Chain. Peterosagitta draco had a wide spatial distribution, being captured in throughout the study area, fluctuating between a minimum of 0.16 ind.100m–3 in 1997 and a maximum of 1.83 ind.100m–3 in 1998 (Figure 6).
Mesopelagic and oceanic specie presented the highest densities close to St. Peter and St. Paul Archipelago (i.e. P. lyra) (Figure 6), especially during 1997 when a topography-flow interaction was more pronounced resulting in the formation of a cold dome in surface layers. These cold domes would allow the presence of P. lyra in the surface. P. lyra is a cosmopolitan species from warm and temperate waters, and its behavior is similar in the Indian Ocean, where it is dominant in mesopelagic waters even though it also occurs occasionally in surface waters (Casanova 1999Casanova JP. 1999. Chaetognatha. In: BOLTOVSKOY D. (Ed), South Atlantic Zooplankton, Vol. 2, Backhuys Publishers, Leiden, p. 1353-1374., Ulloa et al. 2000Ulloa R, Palma S and Silva N. 2000. Bathymetric distribution of chaetognaths and their association with water masses off the coast of Valparaiso, Chile. Deep-Sea Res PT I 47: 2009-2027., Palma and Silva 2004Palma S and Silva N. 2004. Distribution of siphonophores, chaetognaths and euphausiids and oceanographic conditions in the fjords and channels of southern Chile. Deep- Sea Res PT II 51: 513-535.). Several authors have pointed out that presence of these species in surface waters is associated to upwelling events and displacement of water masses, this observation coincides with that reported in this investigation (Fagetti 1968Fagetti E. 1968. Quetognatos de la Expedici!on “Mar Chile I” con observaciones acerca del posible valor de algunas especies como indicadoras de masas de agua frente a Chile. Rev Bio Mar 13(2): 85-153., 1972Fagetti E. 1972. Bathymetric distribution of Chaetognatha in the south eastern Pacifc Ocean. Mar Bio 17: 7-29., Terazaki and Miller 1986Terazaki M and Miller CB. 1986. Life history and vertical distribution of pelagic chaetognaths at ocean station P in the subarctic Pacific. Deep-Sea Res PT I 33(3): 323-337., Terazaki 1992Terazaki M. 1992. Horizontal and vertical distribution of chaetognaths in a Kuroshio warm-core ring. Deep-Sea Res PT I 39(Suppl.1): 231-245., 1996Terazaki M. 1996. Vertical distribution of pelagic chaetognaths and feeding of Sagitta enyata in the Central Equatorial Pacific. J Plankton Res 18: 673-682.).
Sagitta helenae was found mostly in the Fernando de Noronha Chain and its densities were low, except for one station recorded next to the St. Peter and St. Paul Archipelago during 1997. Flaccisagitta hexaptera dominated in the North Brazilian Chain and in the Fernando de Noronha Chain during both periods (Figures 6 and 7).
Distribution of the Chaetognaths and Its Relationship with the Water Masses
The observed distribution of the epipelagic and mesopelagic species in 1997 and 1998 showed variations in their abundances associated with different temperatures and salinities. The temperature-salinity-density diagram (T-S-D) shows this relationship (Figures 8 and 9).
Temperature-salinity-density (T-S-D) diagram of the chaetognath species from area around seamounts and islands off Northeastern Brazil during 1997.
Temperature-salinity-density (T-S-D) diagram of the chaetognaths species from area around seamounts and islands off Northeastern Brazil during 1998.
Flaccisagitta enflata, Pterosagitta draco and Flaccisagitta hexaptera presented their greater densities in superficial equatorial water characterized by temperature and salinity ranges oscillating between 22 and 29°C and between 35.5 and 37.4 PSU, whereas the highest densities and frequencies were found at temperatures and salinities above 27°C and 36 PSU, respectively in both periods (Figures 8 and 9). This remains in agreement with the authors who characterized them as warm-water species (Grant 1991Grant GC. 1991. Chaetognatha from the central and southern Middle Atlantic Bight -species composition, temperature–salinity relationships, and interspecific associations. Fish Bull 89: 33-40., Liang and Vega-Pérez 2001Liang TH and Vega-Pérez LA. 2001. Diversity, abundance and biomass of epiplanktonic chaetognath off South Atlantic western sector, from Cabo Frio (23°S, 42°W) to São Pedro and São Paulo Rocks (01°N, 29°W). Oceanides 16(1): 34-48.). This also confirms the epipelagic nature of these species around seamounts and islands off North-Eastern Brazil (Palma and Silva 2004Palma S and Silva N. 2004. Distribution of siphonophores, chaetognaths and euphausiids and oceanographic conditions in the fjords and channels of southern Chile. Deep- Sea Res PT II 51: 513-535., Fernandes et al. 2005Fernandes LL, Sterza JM and Neves KO. 2005. Seasonal Chaetognath Abundance and Distribution in a Tropical Estuary (Southeastern, Brazil). Bra Jour Oceano 53(1/2): 47-53.). Serratosagitta serratodentata also presented a high frequency at temperatures and salinities above 27°C and 36 PSU respectively, however high densities were found at temperatures between 23.6°C and 25.7°C during 1997 (Figure 8). In 1998 high densities were found at temperatures between 22°C and 28°C (Figure 9). S. serratodentata can be defined as an indicator species of subtropical water masses, as pointed out by Dadon and Boltovskoy (1982)Dadon JR and Boltovskoy D. 1982. Zooplanktonic recurrent groups (Pteropoda, Euphausiacea, Chaetognatha) in the Southwestern Atlantic Ocean. Phy 41(100): 63-83..
The mesopelagic species was observed, ascending to superficial waters by upwelling events during 1997 such as P. lyra, as also mentioned by Alvariño (1965Alvariño A. 1965. Chaetognaths. Oceanography and Marine Biology. Annual Review 3: 115-194., 1992)Alvariño A. 1992. Distribucion batimetrica, diurna y nocturna, de diez y siete especies de quetognatos, durante las cuatro estaciones del año 1969, en aguas de California y Baja California. Invest Mar 7(1): 1-169. (Figure 8). This species was mainly associated with temperatures varying between 21.5°C and 22.8°C and salinity of 35.7–36.3 PSU. These results coincide with those obtained by Ulloa et al. (2000)Ulloa R, Palma S and Silva N. 2000. Bathymetric distribution of chaetognaths and their association with water masses off the coast of Valparaiso, Chile. Deep-Sea Res PT I 47: 2009-2027. off the coast of Valparaiso, Chile, where this specie was located in mesopelagic waters and associated to low temperatures and high salinities, characteristic of the subsurface equatorial water.
Relations Between the Species of Chaetognaths and Environmental Variables
The CCA used environmental information to constrain a reciprocal averaging ordination between chaetognaths and respective samples. Eigenvalues, measures of importance for CCA axes that may vary between zero and one, ranged from 0.001 for CCA 4 to 0.151 for CCA 1. The eigenvalues were moderately high for the first two axes, whereas CCA axes 3 and 4 were relatively low. Species-environment correlations were high for the two first axes, ranging from 0.450 for CCA 2 to 0.680 for CCA 1.
The combined sum of canonical eigenvalues (0.306) equals 32% of that for the unconstrained eigenvalues (0.970), showing the effect of building environmental relationships into the CCA model. The cumulative percentage of species variance (CPSV) accounted for by the CCA totalled 21.2% for the first four CCA axes; however, the cumulative percentage of the species-environment (CPSE) relation totalled 100% for these axes. Monte Carlo test attested the significance of the first CCA axes (p = 0.012) and all CCA axes (p = 0.016) at 95% level.
The low weighted correlation coefficients of the environmental variables indicated that there were no collinear variables. This result is important because multicollinear variables.
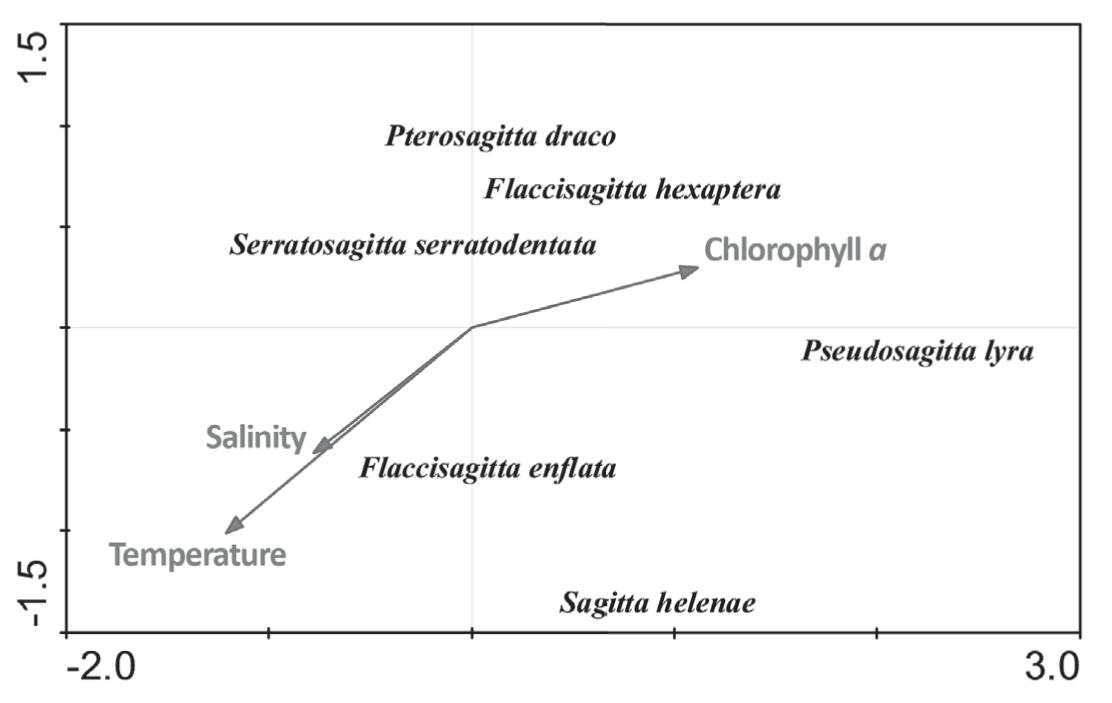
The dispersion of CCA species scores resulted from linear combinations of the environmental variables. Strong environmental gradients were important correlates with abundance in the CCA. Environmental variables correlating most strongly with CCA 1 included chlorophyll a. Another suite of environmental variables correlated with CCA 2 and CCA 1, including water temperature and salinity (Figure 10). Thus, species with low values on CCA 2 and CCA 1 occurred mostly at high salinity and temperature and low chlorophyll a and dry weigh stations, whereas species with high values on CCA 1 occurred mostly at high chlorophyll a stations.
Distribution and density of the chaetognaths species from area around seamounts and oceanic islands during 1997.
To interpret ecological correlations of chaetognaths, structure was examined with respect to both CCA axes and their associated environmental relationships. Distinctive patterns of dispersion in space occurred for the various ecological groups with respect to the important environmental variable.
F. enflata and S. helenae were negatively correlated with the second CCA axes, and appeared mostly at high temperature and salinity stations. F. hexaptera and P. lyra were positively correlated with the first CCA axes, and occurred mostly at high chlorophyll a and low salinity and temperature stations. Pterosagitta draco, S. serratodentata and F. hexaptera were positively correlated with the second CCA axes, and predominantly occurred at low chlorophyll a stations (Figure 10).
The positive correlation of F. enflata abundante with temperature is due to the epiplanktonic characteristic of this species (Boltovskoy 2005Boltovskoy D. 2005. Zooplankton of the South Atlantic Ocean. A taxonomic reference work with identification guides and spatial distribution patterns. DVD ROM. World Biodiversity Database Compact Disc Series. ETI Bioinformatics, Multimedia Interactive Software.). In addition, Fagetti (1968)Fagetti E. 1968. Quetognatos de la Expedici!on “Mar Chile I” con observaciones acerca del posible valor de algunas especies como indicadoras de masas de agua frente a Chile. Rev Bio Mar 13(2): 85-153. indicated that in low latitudes this species has maximum population densities at higher temperatures.
The mesopelagic species (Pseudosagitta lyra) was negatively correlated with temperature and salinity and positively correlated with chlorophyll a. This correlation can be caused by the upwelling events that appear in the 1997 period. P. lyra occurred in mesopelagic waters with low temperatures and low concentrations of dissolved oxygen (Sund 1964Sund P. 1964. The chaetognaths of the waters of the Peru Region. Inter-Amer Trop Tuna Comm Bull 9: 115-188., Bieri 1959Bieri R. 1959. The distribution ofthe planktonics chaetognatha in the Pacific and their relation to the water masses. Limn and Ocea 4(1): 1-28., Fagetti 1968Fagetti E. 1968. Quetognatos de la Expedici!on “Mar Chile I” con observaciones acerca del posible valor de algunas especies como indicadoras de masas de agua frente a Chile. Rev Bio Mar 13(2): 85-153.). The upwelling transports these organisms to more superficial layers together with the subsurface water in which low temperature prevail. The positive correlation with chlorophyll a reaffirms the presence of upwelling event.
The fact that the boundaries mark the distribution ranges for a large number of species is a reflection on the general nature of the relationship between oceanographic events and biogeographical boundaries (Macpherson 2003MacPherson E. 2003. Species range size distributions for some marine taxa in the Atlantic Ocean. Effect of latitude and depth. Biol J Linn Soc 80(3): 437-455.). The distribution of the different species of chaetognaths depends, among other factors, on the temperature and salinity of the water mass. Their highest densities are found under optimal development conditions (temperature, salinity and local productivity favoring the growth, sexual development and feeding rate), and decrease when approaching their distribution boundary. This fluctuation in density must be taken into account when determining the allocation range of the species (Crelier and Daponte 2004Crelier AM and Daponte MC. 2004. Chaetognatha of the Brazil-Malvinas (Falkland) confluence: distribution and associations. Iher Sér Zoo 94(4): 403-412.). The distribution patterns of the species detected was closely related to the hydrology of the area analyzed.
The authors express their thanks to the Ministry of Environment, Direction of Hydrography and Navigation and ANTARES oceanographical ship, for their of this study though the program REVIZEE. This study was partly supported by Coordenação de Aperfeiçoamento de Pessoal de Nível Superior (CAPES, Brazil) as part of doctoral grant.
REFERENCES
- Almeida-Prado MS. 1968. Distribution and annual occurence of Chaetognatha off Cananéia and Santos coast. Bol Inst Ocea 17(1): 33-55.
- Alvariño A. 1965. Chaetognaths. Oceanography and Marine Biology. Annual Review 3: 115-194.
- Alvariño A. 1992. Distribucion batimetrica, diurna y nocturna, de diez y siete especies de quetognatos, durante las cuatro estaciones del año 1969, en aguas de California y Baja California. Invest Mar 7(1): 1-169.
- Andreéu P. 1992. Vertical migration of three coastal species of chaetognaths in the western Mediterranean Sea. Sci Mar 56: 367-372.
- Antezana T. 1999. Plankton of southern Chilean fjords: trends and linkages. Sci Mar 63(1): 69-80.
- Avila LRM, Arruda MR and Bonecker SLC. 2006. Chaetognatha. In: BONECKER S LC (Ed), Atlas de Zooplâncton da Região Central da Zona Econômica Exclusiva Brasileira, Serie Livro; 21, Rio de Janeiro: Museu Nacional, p. 165-184.
- Batistic M. 2003. Abundance, biomass, C- and N-content of Flaccisagitta en£ata and Mesosagitta minima (Chaetognatha). Mar Eco 24: 1-13.
- Bieri R. 1959. The distribution ofthe planktonics chaetognatha in the Pacific and their relation to the water masses. Limn and Ocea 4(1): 1-28.
- Bieri R. 1991. Systematics of the Chaetognatha. In: BONE Q ET AL. (Eds), The Biology of Chaetognaths, Oxford, University Press, Oxford, p. 136-122.
- Boltovskoy D. 2005. Zooplankton of the South Atlantic Ocean. A taxonomic reference work with identification guides and spatial distribution patterns. DVD ROM. World Biodiversity Database Compact Disc Series. ETI Bioinformatics, Multimedia Interactive Software.
- Bone Q, Kapp H and Pierrot-Bults AC. 1991. Introduction and relationship of the group. In: BONE Q ET AL. (Eds), The Biology of Chaetognaths, Oxford University Press, Oxford, p. 1- 4.
- Casanova JP. 1999. Chaetognatha. In: BOLTOVSKOY D. (Ed), South Atlantic Zooplankton, Vol. 2, Backhuys Publishers, Leiden, p. 1353-1374.
- Crelier AM and Daponte MC. 2004. Chaetognatha of the Brazil-Malvinas (Falkland) confluence: distribution and associations. Iher Sér Zoo 94(4): 403-412.
- Dadon JR and Boltovskoy D. 1982. Zooplanktonic recurrent groups (Pteropoda, Euphausiacea, Chaetognatha) in the Southwestern Atlantic Ocean. Phy 41(100): 63-83.
- Duró A, Gili JM and Andreu P. 1994. Influence of the pycnocline on the vertical migration of chaetognaths in the northern Benguela. Jour Plank Res 16: 1149-1165.
- Fagetti E. 1968. Quetognatos de la Expedici!on “Mar Chile I” con observaciones acerca del posible valor de algunas especies como indicadoras de masas de agua frente a Chile. Rev Bio Mar 13(2): 85-153.
- Fagetti E. 1972. Bathymetric distribution of Chaetognatha in the south eastern Pacifc Ocean. Mar Bio 17: 7-29.
- Fagetti EG and Fischer W. 1964. Resultados cuantitativos del zooplancton colectado frente a la costa Chilena por la Expedición “Marchile I”. Montemar 11(4): 137-193.
- Feigenbaum D. 1982. Feeding by the chaetognath, Sagitta elegans, at low temperaturesin Vineyard Sound, Massachusetts. Limn and Ocean 27: 699-706.
- Feigenbaum D and Maris RC. 1984. Feeding in the Chaetognatha. Ocea and Mar Bio: an annual review 22: 343-392.
- Fernandes LL, Sterza JM and Neves KO. 2005. Seasonal Chaetognath Abundance and Distribution in a Tropical Estuary (Southeastern, Brazil). Bra Jour Oceano 53(1/2): 47-53.
- Gibbons MJ. 1992. Diel feeding and vertical migration of sagitta serratodentata Krohn tasmanica Thomson (Chaetognatha) in the southern Benguela. Jour Plank Res 14: 249-259.
- Giesecke R and González HE. 2004. Reproduction and feeding of sagitta enflata in the Humboldt Current system off Chile. ICES Jour Mar Sci 65: 361-370.
- Grant GC. 1991. Chaetognatha from the central and southern Middle Atlantic Bight -species composition, temperature–salinity relationships, and interspecific associations. Fish Bull 89: 33-40.
- Gusmão LMO. 1986. Recife, Brasil: Universidade Federal de Pernambuco; Chaetognatha planctônicos de províncias nerítica e oceânica do Nordeste do Brasil, p. 1-160. Dissertação (Mestrado). (Não publicado).
- Lansac Tôha LFA and Lima AF. 1993. Ecologia do zooplâncton do Estuário do Rio Una do Prelado (São Paulo, Brasil). Acta Limnol Brasil 6: 82-95.
- Liang TH and Vega-Pérez LA. 2001. Diversity, abundance and biomass of epiplanktonic chaetognath off South Atlantic western sector, from Cabo Frio (23°S, 42°W) to São Pedro and São Paulo Rocks (01°N, 29°W). Oceanides 16(1): 34-48.
- Liang TH and Vega-Pérez LA. 2002. Distribution, abundance and biomass of Chaetognaths off São Sebastião region, Brazil in February 1994. Braz Jour Oceano 50: 1-12.
- Lira MCA and Magalhães EMM. 1996. Composição do zooplâncton do Complexo Estuarino- Lagunar Mundaú/Manguaba (Alagoas-Brasil). Bol Est Ciê Mar 9: 31-45.
- Lopes RM. 1996. Hydrography and Zooplankton Community Structure: A comparative study among estuaries of the Juréia-Itatins Ecological Station (Southeastern Brazil). Nerítica 10: 27-40.
- MacPherson E. 2003. Species range size distributions for some marine taxa in the Atlantic Ocean. Effect of latitude and depth. Biol J Linn Soc 80(3): 437-455.
- Marazzo A and Nogueira CSR. 1996. Composition, spatial and temporal variations of Chaetognatha in Guanabara Bay, Brazil. J Plankton Res 18(12): 2367-2376.
- Mclaren IA. 1963. Effects of temperature on growth of zooplankton, and the adaptive value of vertical migration. J Fish Res Board Can 20: 685-727.
- Montú M. 1980. Zooplâncton do estuário da Lagoa dos Patos. I. Estrutura e variações temporais e espaciais da comunidade. Atlântica 4: 53-72.
- Nair V. 1978. Bathymetric distribution of chaetognaths in the Indian Ocean. J Mar Bio 7: 276-282.
- Neumann-Leitão S, Sant'anna EME, Gusmão LM, Nascimento-Vieira DA, Paranaguá MN and Schwamborn R. 2008. Diversity and distribution of themesozooplankton in the tropical Southwestern Atlantic. J Plankton Res 30(7): 795-805.
- Øresland V. 2000. Diel feeding of the chaetognath sagitta enflata in the Zanzibar Channel, western Indian Ocean. Mar Eco Pro Ser 193: 117-123.
- Palma S and Rosales S. 1995. Composición, abundancia y distribución estacional del macrozooplancton de la bahía de Valparaíso. Invest Mar 23: 49-66.
- Palma S and Silva N. 2004. Distribution of siphonophores, chaetognaths and euphausiids and oceanographic conditions in the fjords and channels of southern Chile. Deep- Sea Res PT II 51: 513-535.
- Paranaguá MN and Nascimento-Vieira DA. 1984. Estudo Ecológico da Região de Itamaracá, Pernambuco-Brasil. XXV. Zooplâncton do Rio Botafogo. Tra Oceano 18: 193-206.
- Parsons TR and Strickland JDH. 1963. Discussion of spectrophotometric determination of marine plankton pigments with revised equations of as certaining chlorophyll a and carotenoids. J Mar Res 21(3): 155-163.
- Pierrot-Bults AC and Nair VR. 1991. Distribution patterns in Chaetognatha. In: BONE Q ET AL. (Eds), The biology of Chaetognaths, Oxford, Oxford University, p. 86-116.
- Peterson RG and Stramma L. 1991. Upper-level circulation in the South Atlantic Ocean. Prog Oceanogr 26: 1-73.
- Raymont J. 1983. Plankton and productivity in the oceans, Zooplankton, Pergamon Press, Oxford, 824 p.
- Richardson PL and Mckee TK. 1984. Average Seasonal-Variation of the Atlantic Equatorial Currents From Historical Ship Drifts. J Phys Oceanogr 14: 1226-1238.
- Roden GI. 1991. Mesoscale flow and thermohaline structure around Fieberling Seamount. J Geophys Res 96(16): 653-672.
- Schleyer MH. 1985. Chaetognaths as indicators of water masses in the Agulhas Current System. Invest Report 61: 1-20.
- Shannon LV and Pillar SC. 1986. The Benguela ecosystem: Part III: Plankton. Oceanogr mar biol : an annual review 24: 65-170.
- Souza CS, Luz JAG, Macedo S, Montes MJF and Mafalda JR PO. 2013. Chlorophyll a and nutrient distribution around seamounts and islands of the tropical south-western Atlantic. Mar Freshwater Res 64: 168-184.
- Sullivan B. 1980. In situ feeding behavior of Sagitta elegans and Eukrohnia hamata (chaetognatha) in relation to the vertical distribution and abundance of prey at ocean station “P”. Limnol Oceanogr 25(2): 317-326.
- Sund P. 1964. The chaetognaths of the waters of the Peru Region. Inter-Amer Trop Tuna Comm Bull 9: 115-188.
- Ter-Braak CJF. 1986. Canonical correspondence analysis: a new eigenvector technique for multivariate direct gradient analysis. Ecology 67: 1167-1179.
- Terazaki M. 1992. Horizontal and vertical distribution of chaetognaths in a Kuroshio warm-core ring. Deep-Sea Res PT I 39(Suppl.1): 231-245.
- Terazaki M. 1993. Seasonal variation and life history of the pelagic chaetognath Sagitta elegans verrill, in Toyama bay, southern Japan Sea. J Plankton Res 15(6): 703-714.
- Terazaki M. 1996. Vertical distribution of pelagic chaetognaths and feeding of Sagitta enyata in the Central Equatorial Pacific. J Plankton Res 18: 673-682.
- Terazaki M and Miller CB. 1986. Life history and vertical distribution of pelagic chaetognaths at ocean station P in the subarctic Pacific. Deep-Sea Res PT I 33(3): 323-337.
- Tokioka T. 1956. On chaetognaths and appendicularians collected by Mr. Z. Sagara in the Arafura Sea in May–August 1955. Public Mar Biol Lab 5(2): 203-206.
- Ulloa R, Palma S and Silva N. 2000. Bathymetric distribution of chaetognaths and their association with water masses off the coast of Valparaiso, Chile. Deep-Sea Res PT I 47: 2009-2027.
- Vega-Pérez LA and Liang TH. 1992. Feeding of a pelagic chaetognath, Sagitta friderici Ritter-Záhony off Ubatuba region (São Paulo, Brazil). Bol Inst Oceanogr 40(1/2): 93-100.
- Vega-Pérez LA. and Schinke KP. 2011. Checklist of chaetognatha phyllum from São Paulo State, Brazil. Biota Neotrop 11(1): 1-9.
Publication Dates
-
Publication in this collection
Sept 2014
History
-
Received
14 Mar 2013 -
Accepted
12 Aug 2013