
Abstract
This work is taken up to evaluate the relationship between the thermal comfort of spectators and athletes and the prevailing meteorological conditions during Rio 2016 Olympic Games. Empirical and physiological thermal comfort indices are calculated from data collected from an automatic weather station installed near the Olympic Stadium and interviews with the spectators. The study period was marked by a gradual rise in air temperature and by the occurrence of two significant weather events associated with wind gusts, which caused disturbances in some areas of the competitions. ET and NET were below the air temperature, indicating that both humidity and wind contributed to the reduction of the human-biometeorological indices. Majority of the interviewed persons reported comfortable sensation and weather conditions. These perceptions corroborate results of the thermal comfort indices calculated for these resting spectators. The comfort indices calculated for the athletes with high level of physical activity showed that PET estimated hotter thermal sensation those for the individuals at rest, indicating that the physical type of a person may strongly influence the thermal sensation and comfort during intense physical activity. Increasing trend observed in all the indices of human thermal comfort during the period of study shows consistency among them.
Key words
Rio 2016 Olympic Games; weather conditions; thermal sensations; biometeorology
INTRODUCTION
Olympic Games are conducted since the end of 19th Century during the months of July and August in different countries that have different climates. The climate factor affects the performance of the athletes, especially in the competitions conducted outdoors. Those months are part of midsummer if the chosen city is in the Northern Hemisphere or are part of midwinter if the city is in the Southern Hemisphere. Thus these months can offer extreme conditions that may cause discomfort for the spectators and participants.
In this century Brazil organized several important international sports and games competitions, the Pan-American Games in 2007, FIFA World Cup in 2014 and the Summer Olympics in 2016. Although Brazil is mainly a tropical country, sudden changes in weather conditions are not uncommon and these can interfere in the organization of sports events and can influence the performance of the athletes and the comfort of the spectators. Brazil lacks systematic studies of the human comfort factor and its influence on the performance of athletes. Therefore, the idea that the outcome of the competition strongly depends on weather conditions has not reached the minds of athletes, trainers and organizers, except in very special modalities of sports (Pallotta et al. 2015PALLOTTA M, HERDIES DL & GONÇALVES LGG. 2015. Study of weather and thermal comfort on sport performance applied to Rio de Janeiro’s city marathon. Rev Bras de Meteorol 30: 223-240.., Lucena 2017LUCENA RL, STEONKE ET, PACHECO C, VIEIRA LL, BETANCOURT MO & STEINKE VA. 2017. The Brazilian World Cup: too hot for soccer? Int J Biometeorol 61(12): 2195-2203., Tucker & Gilliland 2007TUCKER P & GILLILAND J. 2007. The effect of season and weather on physical activity: a systematic review. Public Health 121(12): 909-922., Chan & Ryan 2009CHAN CB & RYAN DA. 2009. Assessing the Effects of Weather Conditions on Physical Activity Participation Using Objective Measures. Int Env Res and Pub Health 6(10): 2639-2654., Humpel et al. 2002HUMPEL N, OWEN N & LESLIE E. 2002. Environmental factors associated with adults participation in physical activity: a review. Amer J Prev Med 22(3): 188-199., Suminski et al. 2008SUMINSKI RR, POSTO WC, MARKET P, HYDER M & SARA PA. 2008. Meteorological conditions are associated with physical activities performed in open-air settings. Int J Biomet 52(3): 189-197., Westerterp et al. 2005WESTERTERP KR, PLASKI G & GORIZ AHC. 2005. Water loss as a function of energy intake, physical activity and season. Br J Nutr 93(02): 199-203.). One sport event that uses weather information is automobile racing in which rain or shine can make a big difference.
During any physical exercise or activity, and even during rest periods, the human body is submitted to meteorological conditions. Butera (1998)BUTERA FB. 1998. Chapter 3 – Principles of thermal comfort. Renew Sustain Energy Rev 2: 39-66. likened the human body to a thermodynamic machine that produces work and heat for which it takes in oxygen and food as fuel. Thus, it is necessary to have thermoregulation between the environment and the body for the maintenance of body metabolism. This process includes a series of mechanisms that permit stabilization of body temperature in the presence of variable external thermal conditions (Pimenta et al. 2015PIMENTA AI, OLIVEIRA B, CAMPOS J, NETO MJ & PEREIRA R. 2015. Conceito de conforto térmico humano. PROJETO FEUP. Disponível em: http://paginas.fe.up.pt/~projfeup/submit_14_15/uploads/relat_Q1FQI04_1.pdf.
http://paginas.fe.up.pt/~projfeup/submit...
). When the body temperature increases, the hypothalamus, the principal region of human brain responsible for commanding the body to act correctly, promotes dilatation of the veins and pores in a way to increase the rate of heat transfer through blood circulation and transpiration for the equilibrium of body temperature. On the other hand, when a reduction in body temperature is detected, the hypothalamus promotes constriction of vases and pores in order to reduce or arrest loss of heat, and to trigger involuntary contractions of the muscles (tremors and cramps) and to increase the rate of metabolism and consequently to increase the body temperature. Thus, the thermoregulation is essential for all living beings, for the maintenance of the rate of cell metabolism as well as for the integrity of the organism (Pimenta et al. 2015PIMENTA AI, OLIVEIRA B, CAMPOS J, NETO MJ & PEREIRA R. 2015. Conceito de conforto térmico humano. PROJETO FEUP. Disponível em: http://paginas.fe.up.pt/~projfeup/submit_14_15/uploads/relat_Q1FQI04_1.pdf.
http://paginas.fe.up.pt/~projfeup/submit...
). When there is a temporary imbalance between the heat generated by metabolism and the loss of heat by the body to the environment the body feels discomfort.
It is necessary to study the thermal comfort of individuals in order to find levels of satisfaction of the body with the ambient for executing habitual activities, be they intellectual or manual/physical, and to attain maximum efficiency. According to the American Society of Heating, Refrigerating and Air-conditioning Engineers (ASHRAE) the human thermal comfort is related to the satisfaction with the environment in which one is situated. There are several variables that influence directly the thermal comfort of a person (Mayer 1993, Höppe 1999HÖPPE P. 1999. The physiological equivalent temperature - a universal index for the biometeorological assessment of the thermal environment. Int J Biomet 43: 71-75., Lee 2015LEE H. 2015. Increasing heat waves require human-biometeorological analyses on the planning-related potential to mitigate human heat stress within urban districts. PhD thesis, Albert-Ludwigs-University of Freiburg, Germany. doi: 10.6094/UNIFR/10428.). Environmental variables such as air temperature, humidity, wind, short and long wave radiation from the three-dimensional environment are among them. Some personal factors such as the clothing used by the person, the level of activity, age, sex, weight and the food habits also influence the thermal comfort. Fanger (1972)FANGER PO. 1972. Thermal comfort. New York: McGraw Hill. commented that a person feels thermally comfortable when all the heat generated by the body is equal to the heat lost to the ambient.
This article discusses the importance of analyzing weather conditions for high performance physical activities. Thus, the objective of this study is to analyze the thermal comfort of the spectators and athletes in the athletic events in the Olympic Games in 2016, in the period August, 12-17. Specific objectives are to (1) evaluate the meteorological conditions during the sports events and to discuss significant weather conditions, (2) calculate the thermal comfort indices associated with spectators who answered our questionnaire, and (3) analyze the thermal comfort of a few competitors in the event.
Theoretical aspects
Human thermal comfort is measured in terms of human-biometeorological indices. However, many times the applicability of the indices becomes difficult as the comfort varies from person to person depending on several factors such as his/her physical type, the physical activity and the clothing used (Pallotta et al. 2015PALLOTTA M, HERDIES DL & GONÇALVES LGG. 2015. Study of weather and thermal comfort on sport performance applied to Rio de Janeiro’s city marathon. Rev Bras de Meteorol 30: 223-240..). Nevertheless, the comfort indices have been used in many studies to estimate the influence of meteorological variables in physiological stimulus of the human body (Höppe 1999HÖPPE P. 1999. The physiological equivalent temperature - a universal index for the biometeorological assessment of the thermal environment. Int J Biomet 43: 71-75., Holst & Mayer 2011HOLST J & MAYER H. 2011. Impacts of street design parameters on human biometeorological variables. Meteorol Zeitsc 20: 541-552., Lee et al. 2013LEE H, HOLST J & MAYER H. 2013. Modification of human-biometeorologically significant radiant flux densities by shading as local method to mitigate heat stress in summer within urban street canyons. Adv Met article ID 312572, 13 p. Doi: 10.1155/2013/312572., 2016, Pallotta et al. 2015PALLOTTA M, HERDIES DL & GONÇALVES LGG. 2015. Study of weather and thermal comfort on sport performance applied to Rio de Janeiro’s city marathon. Rev Bras de Meteorol 30: 223-240.., Lee et al. 2016LEE H, MAYER H & CHEN L. 2016. Contribution of trees and grasslands to the mitigation of human heat stress in a residential district of Freiburg, Southwest Germany. Landsc Urban Plan 148: 37-50.). The equations used for such estimates are, in great majority, empirical combinations of meteorological parameters.
Since the beginning of 20th Century studies such as Büttner (1938)BÜTTNER K. 1938. Physikalische Bioklimatologie. Akademische Verlagsgesellschaft Leipzig., as cited in Höppe (1999)HÖPPE P. 1999. The physiological equivalent temperature - a universal index for the biometeorological assessment of the thermal environment. Int J Biomet 43: 71-75., recognized that, for the evaluation of the environmental thermal influence on human body, all the components of thermal parameters which are necessary for modeling the energy balance of human body must be taken into account. Since 1970 several authors started using physiologically relevant indices derived from the stand point of energy balance for the evaluation of the thermal comfort (Matzarakis et al. 2007MATZARAKIS A, RUTZ F & MAYER H. 2007. Modelling radiation fluxes in simple and complex environments – application of the RayMan model. Int J Biomet 51: 323-334. doi:.10.1007/s00484-006-0061-8.). These authors listed some important parameters to be considered and they are: air temperature, vapor pressure, wind speed and the mean radiant temperature (Kántor & Unger 2011KÁNTOR N & UNGER J. 2011. The most problematic variable in the course of human biometeorological comfort assessment - the mean radiant temperature. Cent Eur J Geosci 3: 90-100.) besides the type and intensity of physical activity, rate of production of heat by the body and the resistance of clothing to heat transfer.
Lucena (2017), through the thermal discomfort index (ID) verified in twelve Brazilian cities the real climatic condition during matches of the soccer world cup (2014) and observed that there was no risk to the health of athletes due to extreme heat in the cities.
The present study intends to analyze the relation between the meteorological variables and the comfort level of spectators and athletes during the Rio 2016 Olympic Games. We have chosen the athletic competitions because many of them are conducted in the stadium and attracted many visitors from all over the world. According to Pallotta et al. (2015)PALLOTTA M, HERDIES DL & GONÇALVES LGG. 2015. Study of weather and thermal comfort on sport performance applied to Rio de Janeiro’s city marathon. Rev Bras de Meteorol 30: 223-240.., in such events it is necessary to analyze the empirical thermal comfort indices as well as physiological temperatures for producing a complete analysis. Thus, we have calculated Effective Temperature (ET), Net Effective Temperature (NET) and Physiological Equivalent Temperature (PET) (Mayer & Höppe 1987MAYER H & HÖPPE P. 1987. Thermal comfort of man in different urban environments. Theor Appl Climatol 38: 43-49.). The first two variables ET and NET utilize meteorological variables only and are given by Pallotta et al. (2015)PALLOTTA M, HERDIES DL & GONÇALVES LGG. 2015. Study of weather and thermal comfort on sport performance applied to Rio de Janeiro’s city marathon. Rev Bras de Meteorol 30: 223-240...
where Ta is air temperature in °C and RH is relative humidity in % and v is wind speed in m s-1, at level of the ground (1,5m). It is easily seen from Eq. 1 that for Ta = 10°C or RH = 100%, ET equals Ta. For Ta greater than 10°C, and RH less than 100%, ET is less than Ta, and for Ta less than 10°C, ET is greater than Ta. In Rio de Janeiro the temperature is never less than 10°C and therefore ET never exceeds Ta. From Eq. 2 we can see that NET = 37°C for Ta = 37°C and RH = 100%. However, Ta is normally less than 37°C and as v increases the denominator of the second term on the right side decreases and therefore NET decreases. We have to remember that for calm winds (v = 0.1 m s-1) and for saturated air conditions (RH = 100%) NET equals ET. That is, for indoor environments NET ≅ ET. Thus, ET and NET are applicable, respectively, for indoor and outdoor settings.
For the variable PET the reader is referred to the work of Matzarakis et al. (2007)MATZARAKIS A, RUTZ F & MAYER H. 2007. Modelling radiation fluxes in simple and complex environments – application of the RayMan model. Int J Biomet 51: 323-334. doi:.10.1007/s00484-006-0061-8., which utilizes the RayMan Model for its calculation taking into account the heat balance of human body (Lee & Mayer 2016LEE H & MAYER H. 2016. Validation of the mean radiant temperature simulated by the RayMan software in urban environments. Int J Biomet 60: 1775-1785.). Höppe (1999)HÖPPE P. 1999. The physiological equivalent temperature - a universal index for the biometeorological assessment of the thermal environment. Int J Biomet 43: 71-75. explained that PET is the air temperature at which, in a typical indoor setting (without wind and solar radiation), the heat budget of the human body is balanced with the same core and skin temperature as under the complex outdoor conditions to be assessed. One important parameter that enters the calculation of PET is the Mean Radiant Temperature (Tmrt ) which is discussed in the last Section (Thermal comfort indices). PET allows a person to compare the integral effect of complex thermal conditions outside with his experience indoors. From this we understand that PET is essentially applicable for outdoors.
Table I shows the ranges of different indices and temperatures and the degrees of thermal comfort/discomfort sensations they represent. Those ranges are adapted from Pallotta et al. (2015)PALLOTTA M, HERDIES DL & GONÇALVES LGG. 2015. Study of weather and thermal comfort on sport performance applied to Rio de Janeiro’s city marathon. Rev Bras de Meteorol 30: 223-240.., a study on the performance of athletes in sports events.
Comfort/discomfort zones according to Effective Temperature (ET), Net effective temperature (NET) and Physiological Equivalent Temperature (PET) for different degrees of thermal perception. PTC isv perceived thermal comfort.
MATERIALS AND METHODS
Data
An Automatic Weather Station (AWS) was installed near the João Havelange Olympic Stadium (JHOS) (currently called Nilton Santos Stadium) where track races, jumps, hammer and discus throws, heptathlon and decathlon, of both men and women, were held. The stadium is situated at 22.88° S and 43.28° W and 70 m altitude and has a capacity to accommodate nearly 45 thousand spectators. The AWS, erected 15 meters east of the stadium (for security reasons it was not possible to install inside the stadium), had an integrated sensor model WXT520 of Vaisala installed at a height of 2 m above surface over an aluminum tripod for measuring wind velocity, air temperature, relative humidity, atmospheric pressure and precipitation. Additionally a global radiation sensor was installed coupled to the AWS station. The equipment included a solar panel, data-logger, charge stabilizer, and a 12 V battery. The data was transmitted at high frequency (once a minute) through the Global System for Mobile (GSM) stations. The cloud observations were obtained from METAR weather messages from the Rio de Janeiro International Airport which is situated 11 km from the stadium at 22.49° S and 43.15° W.
The AWS data, gridded analysis of the Global Forecast System (GFS), with 1.0° spatial resolution and 6 hour temporal resolution, of the National Centers for Environmental Predictions (NCEP), surface synoptic data provided by the Brazilian National Institute of Meteorology (INMET), synoptic charts and GOES satellite imagery provided by the Center for Weather Forecasts and Climate Studies (CPTEC) of the National Institute for Space Research (INPE) were used to analyze the predominant meteorological conditions during the period of the athletic competitions. In addition, the METAR data provided by the Meteorological Network of the Air Command (REDEMET) of the Air Space Control Department (DECEA) were also used for the analysis of significant wind episodes.
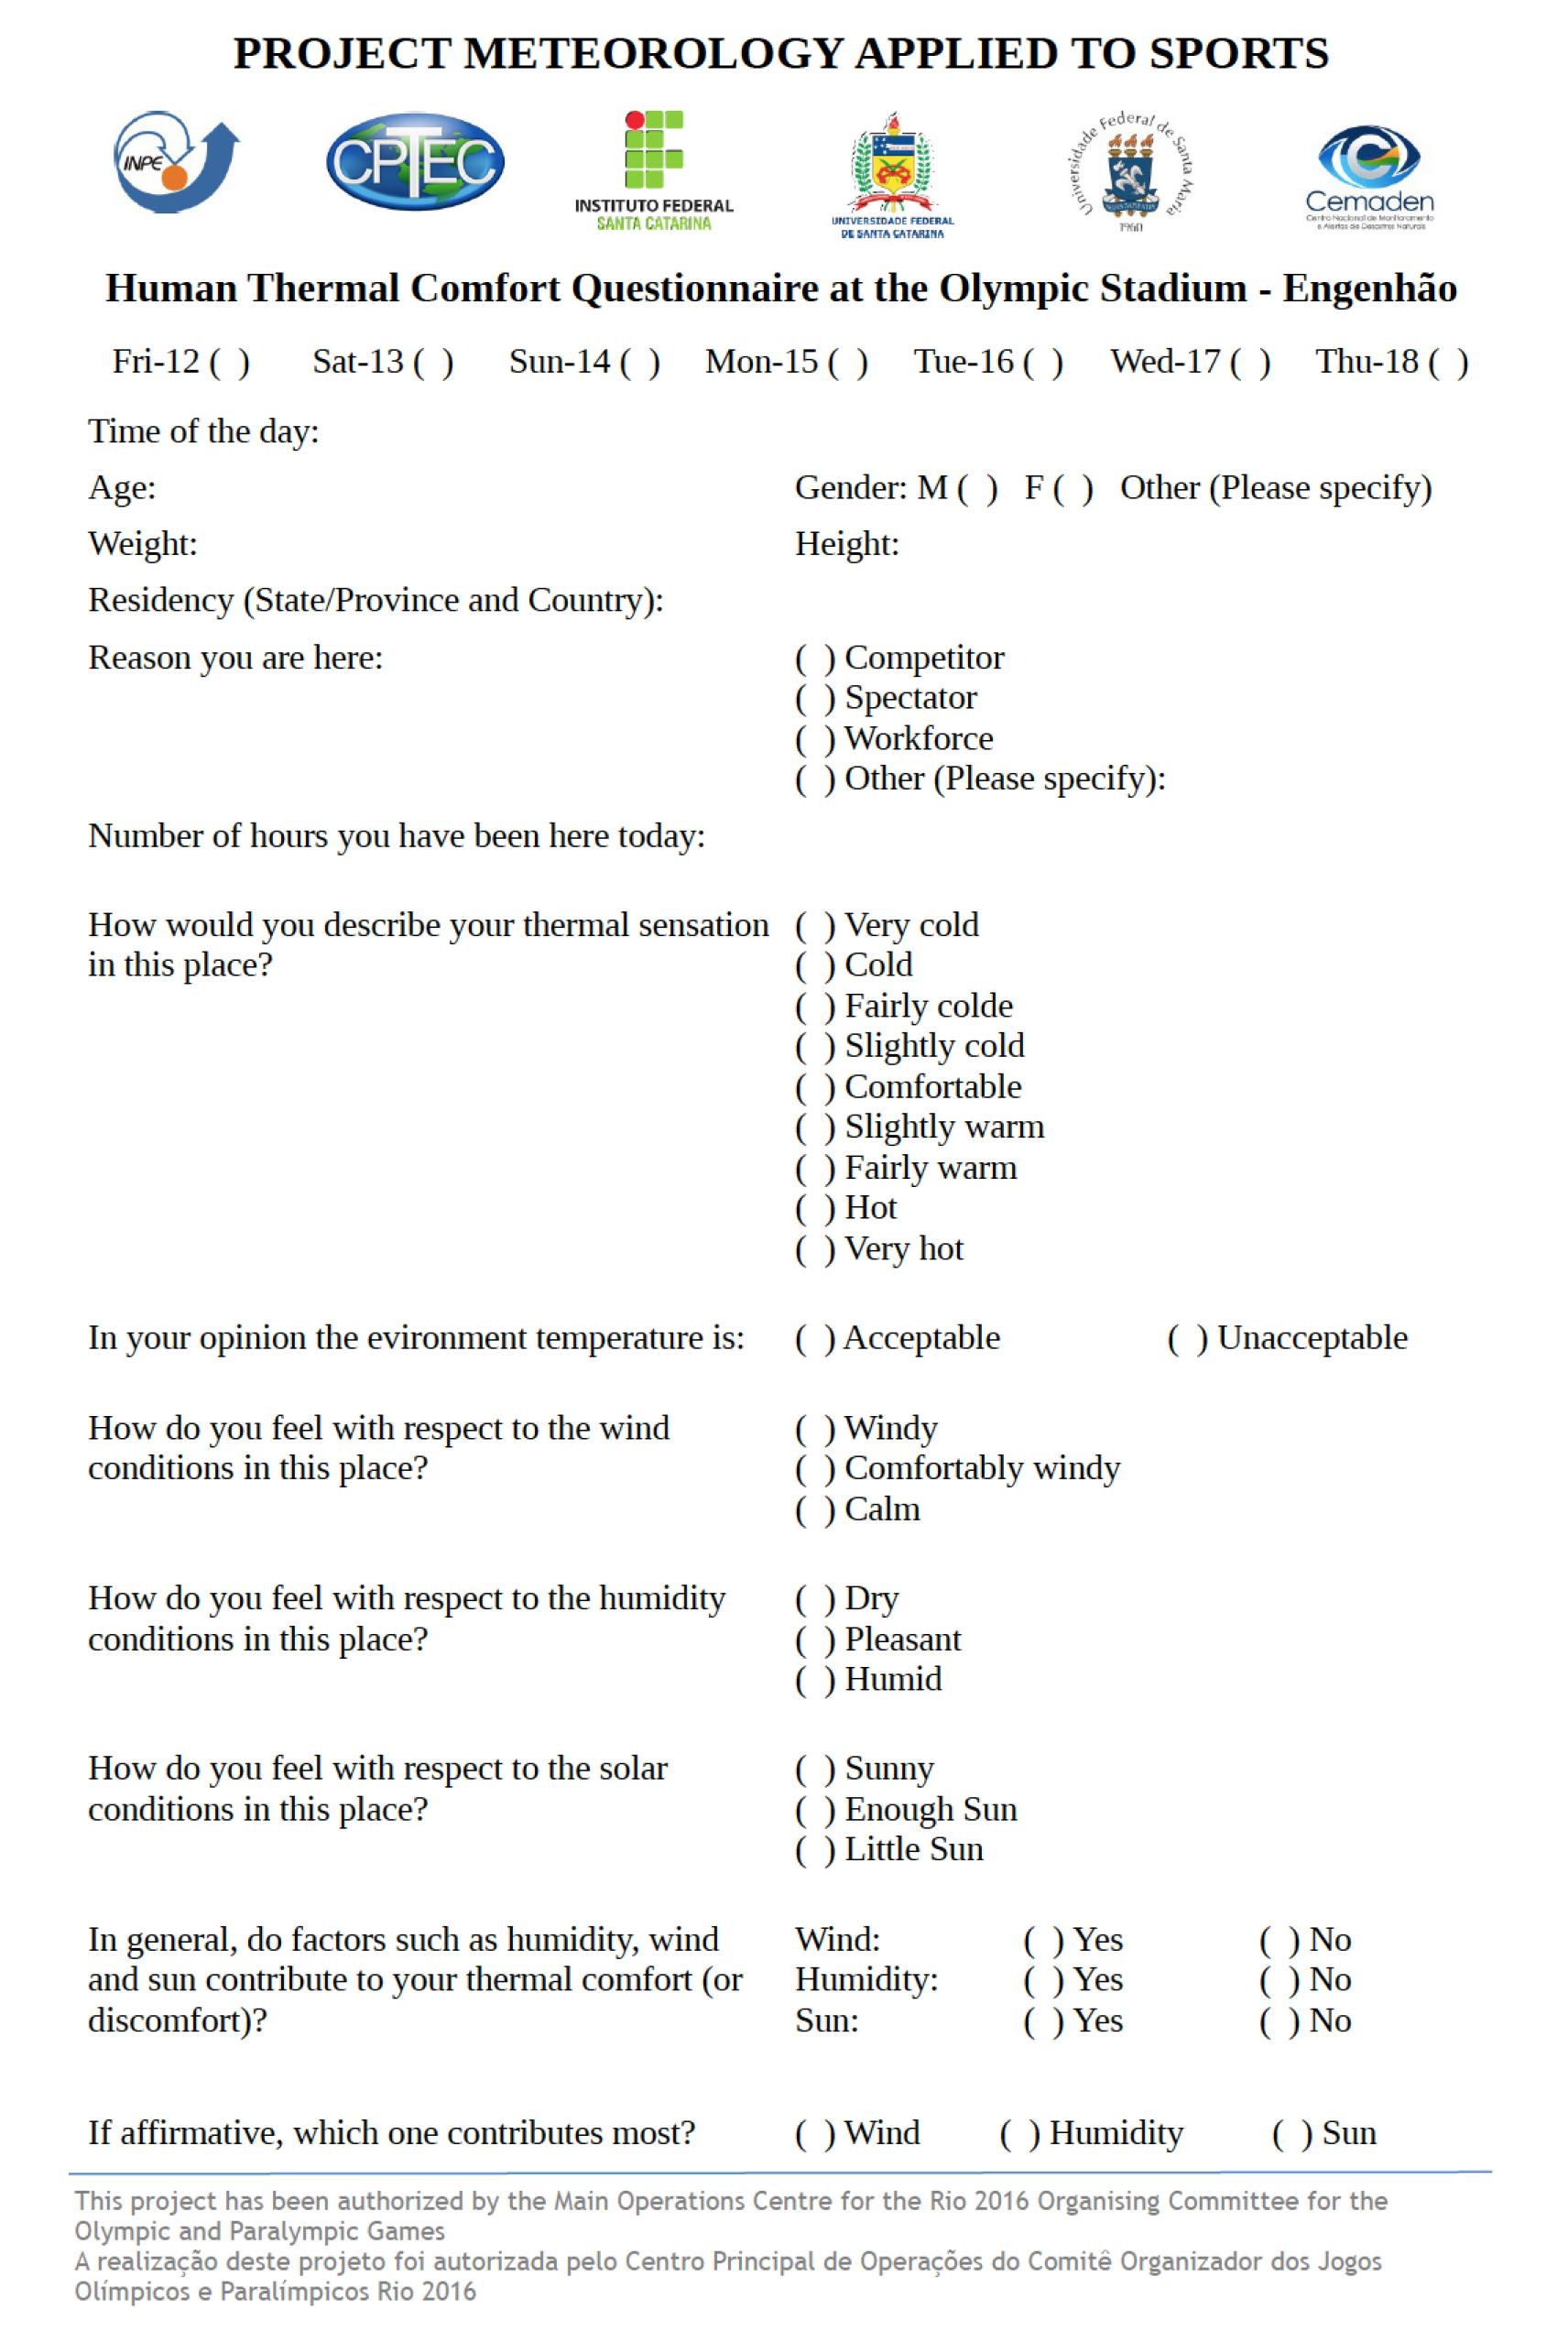
During the competition hours (09:30 – 14:30 and 17:45 – 23:30 LT), opinions of different people, spectators and volunteers of different age groups present in the JHOS, about comfort/discomfort sensation along with their physiological data were gathered. For this a questionnaire containing the physical aspects of the person, native place, thermal sensation and his or her perception of the meteorological conditions, was previously elaborated (see Appendix). The spectators were approached in the stadium (JHOS) under different microclimates and no portable meteorological station was used. The stadium was large and the concentration of the spectators was heterogeneous and around noon time some places of the stadium received direct insolation. Thus the microclimate was not homogeneous. Also, many people declined to answer our questionnaire and due to strict security measures it was not possible to approach the participant athletes.
Thermal comfort indices
From the meteorological variables registered by the AWS and the personal data of the interviewees (weight, height, age and sex), the thermal comfort indices and the thermal sensation of the spectators were calculated. The indices ET and NET were calculated using Eqs. 1 and 2. The indexes chosen were those whose calculation required few and ordinary meteorological variables, such as temperature, humidity and wind, so that a possible data unavailability would not affect the analysis and future validations. These indexes are indicated for some previous studies as the most used in researches in Brazil, being representative and with good applicability for the country, including sport events (Coelho et al. 2010COELHO MS, GONÇALVES FL & LATORE MR. 2010. Statistical Analysis at Predicting Respiratory tract Disease Hospital Admissions from Environmental Variables in the City of Sao Paulo. J Env Pub Health (10): 2-11., Nedel 2008NEDEL AS. 2008. Condições Meteorológicas favoráveis a ocorrencia de doenças respiratórias em crianças na cidade de São Paulo. Tese de doutorado. Universidade de São Paulo., Pallotta et al. 2015PALLOTTA M, HERDIES DL & GONÇALVES LGG. 2015. Study of weather and thermal comfort on sport performance applied to Rio de Janeiro’s city marathon. Rev Bras de Meteorol 30: 223-240..). The PET is obtained by RayMan Model. Utilizing the options given in the software, physiological parameters and clothing characteristics of the individuals noted in the questionnaire were fed to the model to calculate PET for resting spectators.
As part of the study we calculated the thermal indices for two record-breaking athletes, and three spectators (interviewed during athlete’s races) fictitiously running at a speed of 20 km h-1 using their physiological data reported in their answers. The level of activity for the spectators and for the athletes was estimated according Metabolic Equivalent of Task (MET) units (Ainsworth et al. 2011AINSWORTH BE, HASKELL WL, HERRMANN SD, MECKES N, BASSETT DR JR, TUDOR-LOCKE C, GREER JL, VEZINA J, WHITT-GLOVER MC & LEON AS. 2011. Compendium of Physical Activities: a second update of codes and MET values. ASMed Sci Sports Exerc 43(8): 1575-1581.). For example, for a resting person the MET is equal to 1.0 and for a person running at 23 km/h MET equals 22.5.
The RayMan model utilizes the Level of Activity (LA) in Watts and is obtained by using Eq. 3, taken from the Compendium of Physical Activities (Ainsworth et al. 2011AINSWORTH BE, HASKELL WL, HERRMANN SD, MECKES N, BASSETT DR JR, TUDOR-LOCKE C, GREER JL, VEZINA J, WHITT-GLOVER MC & LEON AS. 2011. Compendium of Physical Activities: a second update of codes and MET values. ASMed Sci Sports Exerc 43(8): 1575-1581.), which relates the weight of a person to convert the Metabolic Equivalent of Task (MET) into Watts. For example, a person of 85 kg at rest spends 1 MET = 104 W and for athletic conditions the conversion is made using Eq. 3.
where LAw is the level of activity in Watts, LAMET is the level of activity in MET and W is the weight of the athlete.
RESULTS AND DISCUSSION
Synoptic analysis
A cold frontal system and a meso-trough associated with a squall-line passed over the venue of the Rio 2016 Olympics and caused significant weather changes during the period of this study. The frontal system passed on 11 August and caused fall of air temperature during the two subsequent days. The trough passed over Rio de Janeiro on 15 August and produced strong gales over the city, including over some locations of the competitions. Figure 1 shows the synoptic weather conditions over southeastern Brazil during the period.

Evolution of synoptic situation over Brazil during Rio Olympics. Black isolines: Sea Level Pressure (hPa). Color Shades: 1000-500 hPa thickness (m). Vectors: 10 m wind (m s-1) for 12 UTC on 12 (a), 13 (b), 14 (c), 15 (d), 16 (e) and 17 (f) August 2016. City of Rio de Janeiro marked with a dark square on the maps. High and Low Pressure Centers are marked with H and L, respectively.
The frontal system passage over southeastern of Brazil was associated with an extratropical cyclone in the South Atlantic off the coast of the region. In the wake of the movement of the front into the Atlantic, air temperature declined over southern and southeastern Brazil as can be seen from 1000-500 hPa thickness fields in (Figure 1 a, b). On 12 August (Figure 1a) a part of the cold front remainead stationary over the continent north of Rio de Janeiro. It was associated with a low pressure center of 1012 hPa in the Atlantic located at 29°S and 35°W. On 13 (Figure 1f) the low pressure center moved southeastward to 32°S and 28°W, with a speed of 7° longitude in 24 h. Over the southeastern coast of Brazil a high pressure center of 1020 hPa associated with the cold air mass predominated on this day.
Onward from 14 (Figure 1c), with the eastward movement of the high pressure center into the ocean, a warm air mass invaded southeastern Brazil and raised the air temperature. On 15 the region was warm. Maximum temperature, Tmax, shown in Table II was greater than 30°C. Warm air advection over the continent contributed to the formation of a low pressure area with its center at 41°S and 55°W near the Argentina coast. Associated with this new low center a baroclinic trough extended into southeastern Brazil on 16 (Figure 1e).
Daily mean meteorological parameters of the AWS at JHOS. TMED is mean air temperature. RHMED is mean relative humidity. PMED is mean atmospheric pressure. RMED is mean global radiation. TMIN and TMAX are daily air minimum and maximum temperatures, respectively. Local times of TMIN and TMAX are shown in parentheses.
The meteogram presented in Figure 2 shows the temporal evolution of the five meteorological variables monitored by the AWS. The diurnal range of air temperature (Figure 2a) was small (4°C) on 12 and has increased gradually to 16°C on 16 August when the skies were cleared (figure not shown). The daily maximum temperature rose above 30°C after the high pressure center moved away. On 15, the warmest day, the temperature rose sharply to reach 35°C at around 1400 h. However, the interviews with the spectators were held from 1000 h to 1100 h only. Figure 2b shows the progression of relative humidity. In the forenoon hours RH was around 65% on most of the days. A gradual decrease of surface pressure from 1020 hPa on 12 to 1004 hPa on 16 was observed (Figure 2c) showing the movement of the high pressure center away from the region. The pressure stabilized around 1010 hPa thereafter. The anemogram (Figure 2d) shows low wind speed (less than 2 m s-1) till 1300 h on 15, except on two occasions, one each on 12 and 13 in the afternoon hours. On 15 around 1500 h there was a sudden pressure drop of 7 hPa from 1009 hPa to 1002 hPa in about 3 hours. During this period, the wind speed gained intensity attaining magnitude in excess of 8 m s-1. Strong wind speed, occasionally reaching gale speed of over 12 m s-1, persisted from 1400 h till 2200 h on 15. These observations indicate the passage of a squall line in the afternoon of 15. Associated with the squall line some brief and light precipitation also occurred (Figure 2e).

Time series with hourly data of, a air temperature (°C), b relative humidity (%), c sea-level pressure (hPa), d maximum wind speed (m s-1) and e cumulative precipitation (mm) measured by the AWS at JHOS.
Table II shows the mean daily characteristics of the meteorological variables collected by the AWS installed at JHOS. The air temperature and pressure changes observed were in accordance with the synoptic conditions and changes, indicating the predominance of a cold air mass during the first few days of the athletic events. On 15 the mean pressure decreased and the mean air temperature increased as a consequence of the movement of the high pressure center into the Atlantic. The relative humidity lowered due to higher temperatures. The low values of mean global radiation (RMED) in the beginning of the period are due to cloudiness associated with the cold frontal passage. The mean daily relative humidity (RHMED) decreased from 74% on 12 to 57% on 17 August as the mean daily air temperature (TMED) increased from 19.2°C to 26.8°C.
The weather changes have caused some disruptions to the schedule of the games. The beginning of sailing competitions, marked for 1300 h at Marina de Gloria on 12 August, was delayed by one hour due to strong wind speed. The hourly wind speed registered by the AWSs of INMET along the shore of Rio de Janeiro on 12 and 15 are given in Figure 3a. The wind speed was persistently intense from 0000 h through 1200 h on 12 August with magnitude exceeding 5 m s-1 and reaching 10 m s-1 at some stations. The wind speed became moderate to light (~5 m s-1 or less) in the late afternoon hours. The evolution of pressure during the day at several stations (not presented) showed a rather calmer situation. The strong wind speed observed was due to local effects of orography, land-sea contrast and diurnal warming. A second event of intense wind speed was observed on 15 in the Olympic Park when an aerial camera near Carioca Arena was dislodged lightly hurting some visitors. The top panel (Figure 3a) shows the hourly wind magnitude on this day where wind speed reached and exceeded 15 m s-1 at many places from 1800 h through 2200 h. At COPA (Forte de Copacabana) station the wind speed exceeded 20 m s-1 during the period between 1800 h and 1930 h. The AWS at the Olympic Stadium also registered wind magnitude of 11.8 m s-1 (Figure 2d). At 1840 h the aerodrome at Jacarepagua (SBJR) sent a special Metar SPECI message of gales.

Hourly time series of INMET´s automatic weather stations (AWSs) and METAR observations in the Municipality of Rio de Janeiro for 11-12 and 14-15 August 2016 (local time). METAR sites: SBGL (Galeão), SBJR (Jacarepagua), SBRJ (Santos Dumont); INMET AWSs: COPA (Forte de Copacabana), MRBA (Restinga da Marambaia), VMIL (Vila Militar). (a) Wind speed in m s-1; (b) air temperature in °C; (c) evolution of observed air temperature (Ta), Effective Temperature (ET), Net Effective Temperature (NET) and Physiological Equivalent Temperature (PET) during the days of competition. Time series labeled 12 and 15 refer to days 11-12 August and 14-15 August, respectively. Time is informed in local time. In (a) the ellipses highlight SPECI reports. Red arrow indicates the SPECI from SBJR reported at 18:40 UTC 15 August. In (c) all units in °C.
The hourly air temperature series at the INMET AWSs on 12 and 15 August are shown in Figure 3b. On 12 the diurnal range of air temperature was less than 5°C, with an increase in temperature occurring between 1500 h and 1700 h. The low value of the range was due to cloudiness caused by the passage of a frontal system on the previous day. Steep rise of air temperature was recorded during the afternoon of 15. The diurnal thermal range was nearly 20°C. The air temperature started rising from around 0900 UTC through 1800 UTC and 1900 UTC. This steep rise of air temperature caused discomfort for the spectators as well as for the athletes. One can infer that, besides radiational heating, there was a squall line (described above) strong associated with the warm air advection over the region. On the night of this day precipitation was observed at the JHOE and the athletic competitions were interrupted on a few occasions. Curiously, toward the end of this day the pole-jump world record was broken.
Perceived thermal comfort
Answers to the questionnaire by the interviewees during the athletic competitions was compared with the thermal sensation or Perceived Thermal Comfort (PTC). The questioning occurred mostly in the forenoon hours as shown in Table IIIa. Total number of interviewees was 100 of which 51 were males and 49 females, in the age groups of 14 to 75 years and belonging to different countries of the world. Of these 62% were Brazilians, 8% were Argentineans, 8% were Americans and the rest are from other countries. In general the PTC has a direct relation with the air temperature at the time of interview. Table IIIa also shows the mean (Tamean), maximum (Tamax) and minimum (Tamin) air temperature registered during the periods of interview (different from the daily TMIN and TMAX shown in Table II. The PTC was “moderately cold” (MC) on the cooler days and “extremely warm” (EW) on warmer days but most interviewed said the weather was comfortable. 62% interviewed on 15 to 17 said they felt comfortable in spite of EW weather. Only on 12 when the air temperature was below 20°C (Figure 2a) all the 14 people interviewed felt MC. Only 6% of all the interviewees said that the thermal environment was unacceptable. In some sectors of the stadium there was direct insolation during some periods of the day. This might have reflected in the answers of these.
Time, number of people interviewed, perceived thermal comfort range and mean, maximum and minimum air temperature during the hours of the interviews (a). Tamean, Tamax, Tamin are mean, maximum and minimum temperatures during the interview period. Personal information and thermal comfort indexes for athletes and spectators submitted to observed meteorological conditions (b). For abbreviations of the indices see Section 2 (Theorical aspects).
Thermal comfort indices
Mean thermal comfort indices for the spectators at rest (level of activity = 104 W) for the periods of competitions are obtained on the six days of our study. Figure 3c shows the evolution of the calculated mean indices during the six days of the athletic competitions. We can immediately see from Figure 3c, that ET and NET were less than the observed air temperature (Ta). The relative humidity and wind helped to reduce the values of these two indices. On 12 the difference between ET and NET was about 4°C and the difference decreased to about 1°C by 14 and remained low during the rest of the period. The lowering of NET in relation to ET was due to the wind effect. At lower air temperatures ET does not differ much from Ta and at higher air temperatures the difference between Ta and ET was larger.
In general PET was less than Ta. Especially on 12, 13 and 14 PET was lower than Ta perhaps because of lower Tmrt due to cloudiness. On 16 PET was somewhat lower than Ta when there was rain (Figure 3c). PET exceeded Ta on 15 and 17 due to higher air temperatures and insolation. In general all the temperatures plotted in Figure 3c showed increasing trend from 12 to 17, which means that there is consistency among them.
One can analyze the indices and temperatures based on the intervals of thermal sensation given in Table I. The mean values of the empirical indices for the spectators at rest remained at 17.9°C for ET and 14.3°C for NET, giving a thermal sensation of “slightly cold” (SC) and “cold” (C), on 12. The physiological index PET for this day indicated “slightly cool” (SC) and MC for the spectators interviewed, which is approximately in accordance with their perception. This sensation is responsible for cooling of the body and vasoconstriction symptoms.
On 13 also the calculated indices of thermal sensation were different. While the empirical indices indicated “moderately cold” (MC) and “slightly cool” (SC), the physiological indices showed “no heat stress” (CO). For the only two females interviewed the sensation was “moderately cool” (MC). However, according to the perception of the interviewees the thermal sensation was one of “comfortable”, showing a disagreement between the calculations and PTC (perceived thermal comfort). The same situation was observed with the interviews on 14 when the interviews were held during the night.
On 15, with gradual increase of Ta at the location of the stadium, the empirical indices indicated “no thermal stress” (Comfortable, CO) or “slightly cool” condition. However, PET indicated “slight warm stress” (SW). The latter results agree with perceived thermal sensation of the majority of the interviewees. All the same, three of the 25 interviewed complained unacceptable thermal ambient with a sensation of “extremely warm” (EW) and all the three weighed more than 80 kg.
Day 16 started with cool early morning hours, cooler than the previous day morning, but the indices presented some disagreements among them. The empirical indices showed no thermal stress (CO) and the physiological index PET indicated slightly warm (SW) situation. Although the minimum air temperature on 16 was lower than the previous day, 12 out of 19 interviewees reported slightly warm (SW) and very warm (EW) sensations. This sensation was possibly associated with their exposition to direct solar radiation in the part of the stadium where they were seated. On the last day of the study period, 17 August, the mean air temperature was high. However, the empirical indices remained constant indicating neutral thermal sensation. And, the PET indicated SW situation for the interviewees at 1000 h and EW with extreme discomfort at noon time when the air temperature rose by 5°C. These results were in agreement with the perception of the interviewees who expressed thermal sensation between comfortable and very warm. The EW situation causes vasodilatation and consequently sweating in profusion.
The indices were calculated for two female athletes in the competitions for the same hour when the A1 and A2 athletes were running. The level of activity is obtained with the help of the mean speed, the distance run by the athlete or the time taken for completion of the sport event. Athlete A1 set world record in 1000 m race with mean speed of 23 km h-1 and A2 set world record in 3000 m hurdles race with mean speed of 20 km h-1. Their personal data is given in Table IIIb. For A1 on 12 the indices indicated cold stress (MC) in terms of ET and NET, and the physiological index PET indicated “extremely cold” (EC) condition. For A2 on 17 ET and NET showed comfortable sensation, without any thermal stress. However, the physiological index disagreed as PET indicated slight cold stress (SC).
The results above indicate that the degree of thermal sensation in terms of PET was cooler than that PTC during the athletic events of Rio Olympics. The physiological type of the person is highly relevant for estimating or calculating the thermal comfort indices of the athlete in physical activity. Table IIIb shows the differences among physiological types, of the two athletes and three spectators interviewed. As ET and NET use only the meteorological variables, there was no difference in these indices among different individuals. In other words, ET and NET do not take into consideration the physical activity and the physiological data of the individuals. On 12 the air temperature was lower than that on 17 and therefore the indices on the first day and the last day of competitions were different. On 12 the thermal sensation was slightly cool (SC) to moderately cool (MC). However, PET showed Extreme Cold (EC) sensation for both the Spectator 1 and the athlete A1. On 17 also the PET was higher for the athlete than for the spectators, mainly because the athlete A2 was lighter (58 kg) than the spectators (above 80 kg). Besides that, PET is seen to be representative for the individuals at rest, because when submitted to high levels of physical activity PET indicated cooler thermal sensation.
From the formulae (1) and (2) we see that ET and NET can differ appreciably from Ta for smaller relative humidity values. At very low RH human body does not feel comfortable due to nostril, eye and skin irritation. This aspect of the discomfort effect of low RH conditions is not taken into account by the formulae. Therefore, ET and NET represent only the thermal comfort obtained from meteorological observations, without considering physiological aspects of the individuals. The sports events were held mostly in the forenoon hours or late evening hours of the day and at this time of the day the relative humidity was around 65% and therefore during the sports events RH did not affect the human comfort. Some scientists think that these two indices are outdated as they do not consider the radiation absorbed by humans. Pallotta et al. (2015)PALLOTTA M, HERDIES DL & GONÇALVES LGG. 2015. Study of weather and thermal comfort on sport performance applied to Rio de Janeiro’s city marathon. Rev Bras de Meteorol 30: 223-240.. did not provide justification for the formulae given in Eqs. (1) and (2), because they are based on algebraic or statistical models (de Freitas & Grigorieva 2015DE FREITAS CR & GRIGORIEVA EA. 2015. A comprehensive catalogue and classification of human thermal climate indices. Int J Biomet 59: 109-120.).
As aptly pointed by Höppe (1999)HÖPPE P. 1999. The physiological equivalent temperature - a universal index for the biometeorological assessment of the thermal environment. Int J Biomet 43: 71-75. thermal comfort is the integral effect of all meteorological parameters relevant for heat exchange between the body and its environment. Comfort is a function of many physiological and meteorological parameters. Air temperature is important for the body to exchange heat with the environment. Vapor pressure is important for evaporation of perspiration. Wind becomes important when the body is sweating. Radiation is important because its absorption by the body raises the skin temperature. The importance of the meteorological parameters and the microclimatology of the location increases when a person is situated in a crowded place such as a sports stadium or when the person is exerting. Hence this work is considered relevant.
A widely used human thermal comfort index, Physiological Equivalent Temperature (PET) is calculated in this work. PET is the air temperature at which, in a typical indoor setting without wind and solar radiation, the heat budget of the body is balanced with the same core and skin temperature as under the complex outdoor conditions to be assessed (Höppe 1999HÖPPE P. 1999. The physiological equivalent temperature - a universal index for the biometeorological assessment of the thermal environment. Int J Biomet 43: 71-75.). This temperature allows a person to compare the integral effects of complex thermal conditions outside with his experience indoors. PET transfers the actual thermal bioclimate to an equivalent fictitious indoor environment in which the same thermal sensation is expected. PET, although a temperature, is a measure of bioclimate and is considered a genuine climate index. For calculating indoor PET value the RayMan Model makes some assumptions such as wind velocity is taken to be 0.1 m s-1 and relative humidity is considered to be 50% at air temperature Ta = 20°C Coincidentally, for v = 0.1 m s-1 and RH = 100%, NET equals Ta. However, calculation of PET involves many other variables and considerations. PET values around 20°C are considered comfortable by experience (see Table I). PET values greater than 20°C indicate increasing probability of heat stress and values less than 20°C are too cool for comfort. However, PET alone does not determine thermal comfort because at PET = 20°C and clad in swimming trunks a person may feel cold whereas the same person wearing a woolen coat may sweat. PET is regarded as the basis for the assessment of the thermal comfort. This can be used all year round, in both warm and cold seasons (Höppe 1999HÖPPE P. 1999. The physiological equivalent temperature - a universal index for the biometeorological assessment of the thermal environment. Int J Biomet 43: 71-75.). Typically, in winter on a windy day PET may be up to 15°C lower than the observed air temperature, Ta, and on a hot summer day with radiation directly affecting the body PET can be 20°C higher than Ta (Höppe 1999HÖPPE P. 1999. The physiological equivalent temperature - a universal index for the biometeorological assessment of the thermal environment. Int J Biomet 43: 71-75.). PET is developed to help urban planners and can be easily used.
PET calculation involves, besides the air temperature, humidity, wind and Mean Radiant Temperature (Tmrt ). The idea is that the thermal condition in an urban microclimate in summer is determined mainly by the global radiation field and this is represented by Tmrt (Jendritzky et al. 1979JENDRITZKY G, SONNING W & SWANTES HJ. 1979. An objective evaluation method for the description of the thermal surroundings in urban and landscape planning (‘Klima-Michel-Modell’). Acad Spatial Res Plan Report 28.). Kántor & Unger (2011)KÁNTOR N & UNGER J. 2011. The most problematic variable in the course of human biometeorological comfort assessment - the mean radiant temperature. Cent Eur J Geosci 3: 90-100. conveniently define Tmrt as the temperature of a fictive black body radiation enclosure (emissivity = 1) which would result in the same net radiation energy exchange with the subject as the actual more complex radiation environment. Their Figure 1 is a good illustration of the concept. The RayMan software takes into account three dimensional radiation flux densities for the determination of Tmrt . Tmrt is the most important parameter influencing outdoor thermal comfort during sunny conditions and is a suitable measure for the stress of the human organism due to the heat effect of the radiation from the whole surrounding sphere. It summarizes the effect of all radiant heat fluxes reaching the body. According to Mayer (1993) Tmrt is a suitable measure for the heat stress on the human organism due to the effect of the radiation from the whole sphere. However, it is also the most problematic variable in human biometeorological comfort assessment. The difference in its values between a forest microclimate and a street canyon exposed to sun in summer can be as large as 30°C. The RayMan Model uses Tmrt along with meteorological variables to calculate or estimate PET. In these calculations physical human characteristics are often set constant. In recent times Tmrt is being measured experimentally using sophisticated radiation measuring equipment called (stationary) human-biometeorological measuring system (Mayer et al. 2008MAYER H & HÖPPE P. 1987. Thermal comfort of man in different urban environments. Theor Appl Climatol 38: 43-49.). More recently, Lee & Mayer (2016)LEE H & MAYER H. 2016. Validation of the mean radiant temperature simulated by the RayMan software in urban environments. Int J Biomet 60: 1775-1785. made experimental determination of Tmrt and PET values simulated by RayMan Model and also compared Tmrt simulated and Tmrt experimental at Freiburg, Germany. They found that under heterogeneous conditions the inaccuracy of simulated Tmrt increases. Tmrt governs the PET in the daytime of clear sky summer days. Therefore, the inaccuracies, if any, in PET determination in this study are due to the inaccuracies of Tmrt. Tmrt simulated and Tmrt experimental are somewhat correlated. They are better correlated for values higher than 45°C (Lee & Mayer 2016LEE H & MAYER H. 2016. Validation of the mean radiant temperature simulated by the RayMan software in urban environments. Int J Biomet 60: 1775-1785.). Tmrt error increases with lower sun elevation. It is better simulated under homogeneous conditions. From the results of Lee and Mayer we think that the experimental determination of Tmrt needs improvements and some upgrading of RayMan software is also recommended. At JHOS the conditions were heterogeneous due to the presence of structures around the AWS. Therefore, the PET values presented here should be considered cautiously.
The present study is an application of thermal comfort indices in a sports event and thus can be regarded as a field experiment. Our study reveals the variability of thermal comfort for the selected microclimate during a seven-day period during the Rio Olympics. A large stadium with open roof can be considered an outdoor setting. However, since the wind inside a stadium is either absent or is very light it is not strictly an outdoor environment. Therefore the results obtained in this study have to be considered with caution.
ASHRAE thermal sensation scale in terms of PET given in Holst & Mayer (2011)HOLST J & MAYER H. 2011. Impacts of street design parameters on human biometeorological variables. Meteorol Zeitsc 20: 541-552. is 30° – 34°C → slightly warm, 35° – 40°C → warm and over 40°C → hot. PET values shown in Figure 3 ranged from 16°C to 30°C, i. e., below any warm sensation level. Still a few individuals interviewed during the study period reported warm sensation. This is perhaps due to the ranges shown in Table I are more applicable for central European conditions and people. Each country or region of the globe has to develop its own sensation and comfort ranges in terms of PET.
In the beginning of this decade a Universal Thermal Climate Index (UTCI), Blazejczyk et al. (2010), is in use in some places. This is not employed in our study. We suggest future studies of thermal comfort during sports events of the kind of Olympic Games include these new and modern ideas and instruments. However, a recent study by Zare et al. (2018)ZARE S, HOSHEMINIJAD N, SHIRVAN HE, HEMMATZO R, SAREBONZADEH K & AHMADI S. 2018. Comparing Universal Thermal Climate Index (UTCI) with selected thermal indices /environmental parameters during 12 months of the year. Weather and Clim Ext 19: 49-57. compared UTCI with other thermal indices and found that PET is highly significantly correlated with UTCI (R2 = 0.96). That is, the PET presented in the present study is almost as good as UTCI.
CONCLUSIONS
In general, the Rio Olympics athletics competition period (August, 5-21) was characterized by gradual elevation of air temperature due to the movement of a high pressure area away from the southeastern Brazil into the Atlantic Ocean. No severe heat waves or cold waves affected the site of the games. A frontal system passed over the city of Rio de Janeiro on 11 and a second system, a mesoscale trough and associated squall line, on 16 August 2016. During the passage of the squall line the wind speed intensified producing gales at the stadium where the competitions were held. The high wind speed was responsible for some incidents in the open air area. Such facts support the necessity of monitoring and prediction of meteorological conditions in sports events that attract large gatherings of people.
The present study is an attempt to relate the meteorological conditions with thermal comfort of the spectators as well as the athletes during some high performance sports events in the period August 12-17. Approximately one half of the 100 spectators interviewed expressed that the conditions were comfortable during the six-day period studied. This sensation was due basically to dry weather and low air temperature (according to the figures). In relation to the spectators who felt discomfort, some had cold sensation due to the passage of a cold front in the beginning of the period. The remaining interviewees had a feeling of slightly warm to very warm sensation as a consequence of gradual increase of air temperature from 13 August. Direct incidence of solar rays over some parts of the stadium in the afternoon periods also contributed to this sensation.
The calculated thermal comfort indices increased, in general, gradually during the period, indicating a direct relation with the meteorological data collected by the AWS near the stadium. ET and NET were below the air temperature, indicating that both humidity and wind contributed to the reduction of the human-biometeorological indices. Toward the end of the period, PET was high, as a consequence of high air temperature. All the indices shown in Figure 3c showed an increasing trend during the period of study compatible with the thermal conditions perceived and did not present values incoherent with their scale.
The indices for the athletes with high level of physical activity showed that PET estimated cooler thermal sensation. PET is seen to be representative for the individuals at rest, because when submitted to high levels of physical activity PET indicated cooler thermal sensation.
The indices of three spectators submitted to the levels of physical activity of the athletes showed disagreements, due principally to the differences in their physical types. That is, physical type is a relevant parameter for thermal sensation under physical activity. PET obtained values of slight cold stress or neutrality. The ranges of thermal sensation and stress used here need to be revised in order to serve to relate meteorological conditions to thermal sensation at all levels of physical activity and for each physical type of persons.
Human thermal comfort indices have been widely used in research involving human thermoregulation. Evidence shows that the combined action of meteorological variables influences the lifestyle and daily activities of the human population, whether at rest ou in high performance physical activities. Finally, it is suggested to repeat this research in other sporting events in Brazil, at different season of the year, in order to evaluate the athletes’ performance.
ACKNOWLEDGMENTS
PS wishes to acknowledge the support obtained from the Conselho Nacional de Desenvolvimento Científico e Tecnológico (CNPq). The authors are grateful to the Olympic Public Authority (OPA) and the Rio 2016 Organizing Committee, especially Márcio Mello, Rodrigo Rangel and Sheila Morello, for all support and support during and prior to the study period. Thanks also to the company Hobeco for the partnership and logistical support to obtain the meteorological data in the João Havelange Olympic Stadium. The date and information of the project can be found at the address: mquadro95@gmail.com.
REFERENCES
- AINSWORTH BE, HASKELL WL, HERRMANN SD, MECKES N, BASSETT DR JR, TUDOR-LOCKE C, GREER JL, VEZINA J, WHITT-GLOVER MC & LEON AS. 2011. Compendium of Physical Activities: a second update of codes and MET values. ASMed Sci Sports Exerc 43(8): 1575-1581.
- BLAZEJCYK K, BROEDE P, FIALA D, HAVENITH G, HOLMÉR I, JENDRITZKY G, KAMPMANN B & KUNERT A. 2010. Principles of the new universal thermal climate index (utci) and its application to bioclimatic research in european scale. Misc Geogr (14): 91-102.
- BUTERA FB. 1998. Chapter 3 – Principles of thermal comfort. Renew Sustain Energy Rev 2: 39-66.
- BÜTTNER K. 1938. Physikalische Bioklimatologie. Akademische Verlagsgesellschaft Leipzig.
- CHAN CB & RYAN DA. 2009. Assessing the Effects of Weather Conditions on Physical Activity Participation Using Objective Measures. Int Env Res and Pub Health 6(10): 2639-2654.
- COELHO MS, GONÇALVES FL & LATORE MR. 2010. Statistical Analysis at Predicting Respiratory tract Disease Hospital Admissions from Environmental Variables in the City of Sao Paulo. J Env Pub Health (10): 2-11.
- DE FREITAS CR & GRIGORIEVA EA. 2015. A comprehensive catalogue and classification of human thermal climate indices. Int J Biomet 59: 109-120.
- FANGER PO. 1972. Thermal comfort. New York: McGraw Hill.
- HOLST J & MAYER H. 2011. Impacts of street design parameters on human biometeorological variables. Meteorol Zeitsc 20: 541-552.
- HÖPPE P. 1999. The physiological equivalent temperature - a universal index for the biometeorological assessment of the thermal environment. Int J Biomet 43: 71-75.
- HUMPEL N, OWEN N & LESLIE E. 2002. Environmental factors associated with adults participation in physical activity: a review. Amer J Prev Med 22(3): 188-199.
- JENDRITZKY G, SONNING W & SWANTES HJ. 1979. An objective evaluation method for the description of the thermal surroundings in urban and landscape planning (‘Klima-Michel-Modell’). Acad Spatial Res Plan Report 28.
- KÁNTOR N & UNGER J. 2011. The most problematic variable in the course of human biometeorological comfort assessment - the mean radiant temperature. Cent Eur J Geosci 3: 90-100.
- LEE H. 2015. Increasing heat waves require human-biometeorological analyses on the planning-related potential to mitigate human heat stress within urban districts. PhD thesis, Albert-Ludwigs-University of Freiburg, Germany. doi: 10.6094/UNIFR/10428.
- LEE H, HOLST J & MAYER H. 2013. Modification of human-biometeorologically significant radiant flux densities by shading as local method to mitigate heat stress in summer within urban street canyons. Adv Met article ID 312572, 13 p. Doi: 10.1155/2013/312572.
- LEE H & MAYER H. 2016. Validation of the mean radiant temperature simulated by the RayMan software in urban environments. Int J Biomet 60: 1775-1785.
- LEE H, MAYER H & CHEN L. 2016. Contribution of trees and grasslands to the mitigation of human heat stress in a residential district of Freiburg, Southwest Germany. Landsc Urban Plan 148: 37-50.
- LUCENA RL, STEONKE ET, PACHECO C, VIEIRA LL, BETANCOURT MO & STEINKE VA. 2017. The Brazilian World Cup: too hot for soccer? Int J Biometeorol 61(12): 2195-2203.
- MATZARAKIS A, RUTZ F & MAYER H. 2007. Modelling radiation fluxes in simple and complex environments – application of the RayMan model. Int J Biomet 51: 323-334. doi:.10.1007/s00484-006-0061-8.
- MAYER H. 1993. Urban bioclimatology. Experientia 49: 957-963. doi: 10.1007/BF02125642.
- NEDEL AS. 2008. Condições Meteorológicas favoráveis a ocorrencia de doenças respiratórias em crianças na cidade de São Paulo. Tese de doutorado. Universidade de São Paulo.
- MAYER H, HOLST J, DOSTAL P, IMBERY F & SCHINDLER D. 2008. Human thermal comfort in summer within an urban street canyon in Central Europe. Meteorol Zeitsc 17: 241-250.
- MAYER H & HÖPPE P. 1987. Thermal comfort of man in different urban environments. Theor Appl Climatol 38: 43-49.
- PALLOTTA M, HERDIES DL & GONÇALVES LGG. 2015. Study of weather and thermal comfort on sport performance applied to Rio de Janeiro’s city marathon. Rev Bras de Meteorol 30: 223-240..
- PIMENTA AI, OLIVEIRA B, CAMPOS J, NETO MJ & PEREIRA R. 2015. Conceito de conforto térmico humano. PROJETO FEUP. Disponível em: http://paginas.fe.up.pt/~projfeup/submit_14_15/uploads/relat_Q1FQI04_1.pdf
» http://paginas.fe.up.pt/~projfeup/submit_14_15/uploads/relat_Q1FQI04_1.pdf - SUMINSKI RR, POSTO WC, MARKET P, HYDER M & SARA PA. 2008. Meteorological conditions are associated with physical activities performed in open-air settings. Int J Biomet 52(3): 189-197.
- TUCKER P & GILLILAND J. 2007. The effect of season and weather on physical activity: a systematic review. Public Health 121(12): 909-922.
- WESTERTERP KR, PLASKI G & GORIZ AHC. 2005. Water loss as a function of energy intake, physical activity and season. Br J Nutr 93(02): 199-203.
- ZARE S, HOSHEMINIJAD N, SHIRVAN HE, HEMMATZO R, SAREBONZADEH K & AHMADI S. 2018. Comparing Universal Thermal Climate Index (UTCI) with selected thermal indices /environmental parameters during 12 months of the year. Weather and Clim Ext 19: 49-57.
APPENDIX

Publication Dates
-
Publication in this collection
24 Mar 2021 -
Date of issue
2021
History
-
Received
23 Sept 2019 -
Accepted
2 Apr 2020


