Influence of siltation on flood propagation: hydrodynamic analysis and hazard index assessment in the Jundiaí River Basin
Abstract
Siltation is one of the main aggravating factors for floods in urbanized basins, altering flow capacity and increasing socio-environmental risks. This study evaluates the impacts of siltation on flood dynamics in the Jundiaí River Basin (São Paulo, Brazil), using hydrodynamic modeling (HEC-RAS 6.0) and the Hazard Index (HI = y × v), based on hydraulic thresholds established in the literature. Three scenarios were simulated for an extreme 100-year return period (RP) event: (1) reference condition (no siltation), (2) moderate siltation (20% reduction in depth), and (3) severe siltation (40% reduction). The results indicated three distinct hydrodynamic behavior patterns: high-energy zones (where the cross-section reduction increased velocity and erosive power), active deposition zones (locations with low velocity, v < 0.3 m/s, with lateral flood expansion), and transition areas (with unstable Hazard Index behavior). An increase in the flooded area was observed by 12% (moderate scenario) and 28% (severe scenario), with a critical rise in the HI (> 4.0 m²/s) in high hydraulic energy zones, while low-velocity areas (v < 0.3 m/s) showed lateral flood expansion. Sediment deposition was predominant in floodplains and reaches with slopes < 0.3%, corroborating literature studies. It is concluded that siltation not only expands the flooded area but also intensifies hydrodynamic risks in critical regions, demanding integrated sediment management strategies.
Keywords:
hazard index; hydrodynamic modeling; Jundiaí River; siltation
Resumo
O assoreamento é um dos principais fatores agravantes de inundações em bacias urbanizadas, alterando a capacidade de escoamento e ampliando riscos socioambientais. Este estudo avalia os impactos do assoreamento na dinâmica de inundações na bacia do Rio Jundiaí (São Paulo, Brasil), utilizando modelagem hidrodinâmica (HEC-RAS 6.0) e o Índice de Perigo (IP = y × v), com base em limiares hidráulicos estabelecidos na literatura. Três cenários foram simulados para um evento extremo TR 100 anos: (1) condição de referência (sem assoreamento), (2) assoreamento moderado (redução de 20% na profundidade) e (3) assoreamento severo (redução de 40%). Os resultados indicaram três padrões distintos de comportamento hidrodinâmico: zonas de alta energia (onde a redução da seção aumentou a velocidade e o poder erosivo), zonas de deposição ativa (locais de baixa velocidade, v < 0,3 m/s, com expansão lateral da inundação) e áreas de transição (com comportamento instável do Índice de Perigo). Verificou-se um aumento da área inundada em 12% (cenário moderado) e 28% (cenário severo), com elevação crítica do IP (> 4,0 m²/s) em zonas de alta energia hidráulica, enquanto áreas de baixa velocidade (v < 0,3 m/s) apresentaram expansão lateral da inundação. A deposição de sedimentos foi predominante em planícies de inundação e trechos com declividade < 0,3%, corroborando estudos da literatura. Conclui-se que o assoreamento não apenas amplia a área alagada, mas também intensifica riscos hidrodinâmicos em regiões críticas, demandando estratégias integradas de gestão sedimentar.
Palavras-chave:
assoreamento; índice de perigo; modelagem hidrodinâmica; rio Jundiaí
1. INTRODUCTION
Siltation in urban rivers results from a combination of natural and anthropic processes, such as deforestation, soil sealing, and land-use changes (Nones et al., 2019). In the Jundiaí River Basin, this phenomenon is intensified by the high sediment load from degraded areas, reducing flow capacity and increasing the frequency of floods. Sahdar et al. (2024) and Hamidifar et al. (2024) demonstrate that sediment deposition in low hydraulic energy zones (v < 0.3 m/s), such as banks and floodplains, represents a critical process in the fluvial dynamics of urbanized basins. These areas function as natural sediment traps, where the reduced transport capacity of the flow allows for the progressive settling of particulate matter. Abidin et al. (2020) report that in hydrodynamic studies, these natural depositional systems are particularly intense in:
-
Reaches with a slope < 0.3%, where the Froude number (Fr) remains below 0.3, characterizing subcritical flows with a dominance of depositional processes;
-
Adjacent floodplains, where the abrupt reduction in bed shear stress allows for the sedimentation of fine fractions;
-
Concave banks of meanders, where helical circulation generates flow divergence zones with velocities 40-60% lower than the main channel.
Sahdar et al. (2024) reinforce that the synergy between sediment transport and urban hydrology amplifies risks, especially in regions with anthropic alterations to the natural flow. In Brazil, the lack of continuous monitoring and precise bathymetric data limits the anticipation of impacts, especially in areas already vulnerable to the described hydrodynamic processes.
This study advances this theme by integrating:
-
Analysis of deposition thresholds based on hydrodynamic criteria (velocity and slope);
-
Assessment of the Hazard Index (HI), combining depth (y) and velocity (v).
2. STUDY AREA
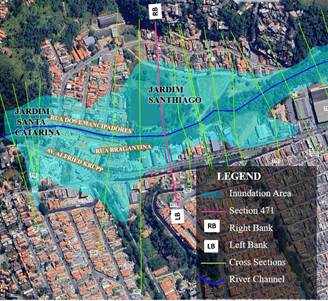
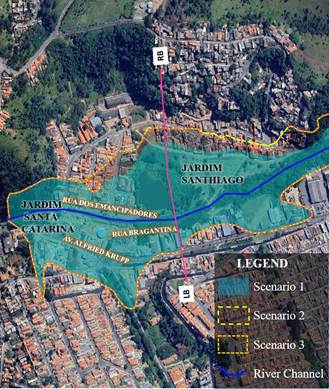
The Jundiaí River Basin, in its upper portion, covers urban and peri-urban regions that face recurring challenges with floods, especially during periods of intense rainfall. Among the most vulnerable areas, as shown in Figure 1, the following stand out:
-
Jardim Santa Catarina and Jardim Santiago neighborhoods: Residential areas located in floodplain zones, subject to flooding due to low slope and sediment accumulation.
-
Alfried Krupp Avenue: A critical flood point, where the river overflow interrupts traffic, affecting urban mobility and population safety.
Upper region of the Jundiaí River Basin, highlighting critical areas. The image illustrates the flood plain (in blue) and the location of the cross-sections used in the hydrodynamic modeling.
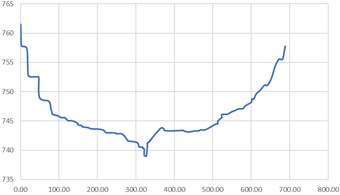
Figure 2 shows the cross-section of the Jundiaí River in reach 471 of the study area, highlighting the main morphological features of the channel, including the flood plain and the cross-sections that characterize the channel's geometry in the spatial context of the study. This section geometry, along with the spacing between sections and the boundary conditions (discussed in the Methodology), was fundamental for constructing the numerical model.
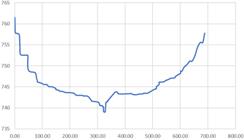
Geometric profile of cross-section 471 (Station vs. Elevation), showing the channel geometry.
3. METHODOLOGY
3.1. Hydrodynamic Modeling
The hydrodynamic modeling was performed using the HEC-RAS software version 6.0. The choice of HEC-RAS 1D is justified by its wide acceptance in the technical-scientific community for hydrodynamic simulations in rivers with predominantly one-dimensional geometry, as is the case for the studied reach of the Jundiaí River. The implementation of the 2D module with sediment transport, although an improvement, was not adopted due to greater computational complexity, the absence of continuous bathymetric data, and the need for detailed sedimentological parameters, which were beyond the scope of this initial study. The model solves the complete Saint-Venant equations, which describe the flow of water on free surfaces.
Three distinct scenarios of channel conditions were simulated:
-
Scenario 1, representing the reference condition, a flood with a 100-year return period (RP), without siltation, with an average depth of 3.0 meters. This scenario serves as a comparative basis to evaluate the impacts of siltation;
-
Scenario 2, which simulates moderate siltation corresponding to a 20% reduction in the average depth compared to Scenario 1;
-
Scenario 3, representing severe siltation with a 40% reduction in the average depth.
For all scenarios, the same hydrological event was simulated: a flood with a 100-year return period (RP).
To ensure the robustness of the simulations, input data from terrain topography, river cross-sections, Manning's roughness coefficients, and flow boundary conditions were used. The strategy for building the numerical model considered regular spacing between cross-sections, with upstream and downstream sections defined as flow and water level boundary conditions, respectively. The model was calibrated using hydrodynamic parameters such as the Manning's coefficient (n), turbulent viscosity, and reference water levels. The Manning's coefficient was considered uniform along the reach, with fixed values between 0.035 and 0.045, representing the average for the main channel. The bathymetry used refers to the year 2022. The calibration process was not systematically implemented due to the absence of continuous observed flow and water level data for the simulated event, which is a limitation of this study. The model validation was performed based on historical flood event data in the basin, ensuring that the simulations accurately represented the flow dynamics.
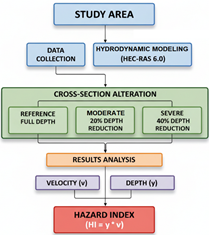
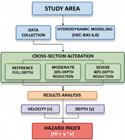
The methodological flowchart (Figure 3) details the steps from the acquisition and treatment of topo-bathymetric data to the hydrodynamic simulation and risk classification.
3.2. Siltation Criteria
The identification of areas susceptible to sediment deposition (siltation) was based on water velocity (v). The criterion established by Sahdar et al. (2024) was adopted, in which areas with velocity below 0.3 m/s are considered potential deposition zones and, consequently, siltation zones. The characteristic parameters of the sediments that fed the numerical model were obtained based on technical literature for similar basins, as specific granulometric data were not available. A particle density of 2650 kg/m³ and a medium sand diameter (D50) of 0.2 mm were adopted, which are typical parameters for bottom sediments in lowland rivers. The critical velocity for the initiation of motion was calculated using the Shields equation, resulting in the 0.3 m/s threshold adopted as the deposition (siltation) criterion.
3.3. Hazard Index
For assessing the risk associated with the flow force, Nazir et al. (2016) proposed an index to evaluate hazards related to floodwater flows, as indicated by Equation 1. Several authors, such as Sahdar et al. (2024), Hamidifar et al. (2024), Vázquez-Tarrío et al. (2024), and Nones et al. (2019), have used the proposed equation (Equation 1) and corroborate its effectiveness in hydrological studies, especially in identifying areas suitable for urban development.
Where:
HI is the hazard index (m²/s)
y is the water level depth (m)
𝑣 is the flow velocity (m/s)
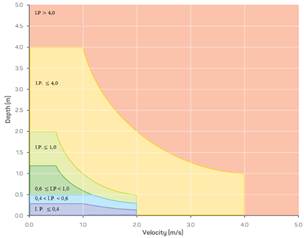
Equation 1 shows that the hazard index is directly related to the destructive potential of the flow velocity. In other words, when the water depth is high and the current has a high velocity, the resulting flow can cause significant structural and material damage. As the flow velocity decreases, consequently reducing the depth, the water flow becomes safer, causing less damage (Nazir et al., 2016). Figure 4, prepared by the same author, illustrates the possible repercussions generated by the flow characteristics and includes a detailed legend to allow for the understanding and subsequent classification of the risk index of this study according to Nazir et al. (2016).
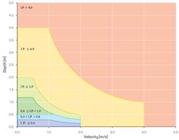
Hazard Index (HI = y * v) vulnerability curves, classifying flood ramifications from "generally safe for people" (HI ≤ 0.4) to "structurally dangerous for all buildings" (HI > 4.0). Source: Adapted from Nazir et al. (2016).
4. RESULTS
The study evaluated the effects of siltation by analyzing three key parameters (velocity, depth, and Hazard Index - HI) at 45 stations along the Jundiaí River, simulated in the HEC-RAS software for three scenarios: reference (S1), moderate siltation (S2), and severe (S3). The stations refer to the discretized cross-sections in the numerical model, located along the study reach, influenced by factors such as slope, channel geometry, and the presence of anthropic structures.
Table 1 presents a summary of the hydrodynamic variations in selected stations, obtained from the HEC-RAS simulations.
4.1. Hydrodynamic Patterns
4.1.1. Risk Classification
Severe siltation increased the high-risk areas (HI > 0.4 m²/s) from 12 to 18 stations (+50%), mainly at confluences and sharp bends. Extreme risk zones (HI > 1.0 m²/s) were concentrated in 5 stations, such as 239.75 (HI = 3.043 m²/s), where the combination of high velocity (>1.8 m/s) and reduced depth potentialized erosion risks.
4.1.2. Variation of Froude Number (Fr)
The variation in the Froude Number (Fr) reveals changes in the flow regime due to siltation. At Station 242.87, the reference scenario (S1) showed subcritical flow (Fr ≈ 0.43), with a velocity of 1.865 m/s and depth of 1.853 m. However, in Scenario 3 (severe siltation), the Fr increased to 0.94, approaching the critical regime (Fr = 1), due to the combination of higher velocity (3.108 m/s) and lower depth (1.112 m). This transition indicates an increase in the flow's kinetic energy, raising the risks of hydraulic instability. The effect of the Froude number on flood risk is significant, as approaching the critical regime results in water level reductions due to increased velocity, but simultaneously expands the flow's kinetic energy, increasing destructive potential and erosion risks.
4.1.3. Confinement Effect
The confinement effect caused by siltation (depth reduction) led to an increase in water velocity due to the conservation of flow (Q = v × A). At Station 236.63, for example, a 40% reduction in depth (from 1.009 m to 0.605 m) resulted in a 50% increase in velocity (from 1.442 m/s to 2.165 m/s), characterizing an acceleration-by-narrowing phenomenon.
This behavior is typical of reaches with geometric restrictions, such as incised channels or confluence zones, where the decrease in the flow area is compensated by an increase in velocity to maintain constant discharge.
This effect has direct implications for fluvial dynamics, as higher velocity can intensify erosive processes, especially in locations where the flow is already naturally accelerated. Furthermore, the change in the depth-velocity relationship can modify sediment transport patterns, increasing the risk of instability on banks and beds. In severe siltation situations, as in Scenario 3, this phenomenon can lead to abrupt changes in channel morphology, requiring interventions to mitigate hydrodynamic risks.
4.1.4. Deposition vs. Erosion Zones
In low-energy zones, such as at Station 66.239, the velocity remained below 0.2 m/s even in the severe siltation Scenario 3, confirming a dominance of sediment deposition. The HI remained constant (0.076 m²/s), indicating that the depth reduction did not alter the flow dynamics. The justification for the constant HI should not be attributed to laminar flow, as free-surface flows are characterized by turbulent or, at most, transitional Reynolds numbers. Instead, the HI stability reflects a hydrodynamic equilibrium where the reduction in depth is compensated by a proportional increase in velocity, keeping the y×v product constant.
In high-energy reaches, such as Station 239.75, the velocity increased by 67% in Scenario 3 (reaching 3.075 m/s), raising the HI to 3.048 m²/s. This behavior suggests an increase in the flow's erosive capacity, with risks of bank scour and bed incision. In these regions, the reduction in depth intensifies the velocity, creating a feedback loop where the erosive process itself can further deepen the channel.
The difference between these two scenarios highlights how siltation affects reaches with opposite hydrodynamic energies differently. While low-energy areas tend to accumulate sediments and worsen siltation, high-energy zones respond with increased erosive capacity, which can lead to abrupt changes in channel morphology.
4.1.5. Shear Stress and Sediment Transport
The shear stress (τ) on the riverbed increased with siltation due to the direct relationship with depth (y) and velocity (v). At Station 236.63, with a slope (S) of ≈ 0.005 m/m, Scenario 3 (severe siltation) showed a τ about 1.8 times greater than Scenario 1. This occurred because, although the depth decreased by 40%, the 50% increase in velocity (1.442 m/s to 2.165 m/s) compensated for this reduction. The result was a greater dragging capacity, evidenced by the drop in HI from 1.455 to 1.310 m²/s, indicating that previously stable sediments began to be remobilized.
4.1.6. Spatial Patterns and Morphodynamics
In reaches with steep slopes, such as near Station 239.75, the Hazard Index (HI) remained stable (~3.043 m²/s) even with advancing siltation. This occurred because the increase in velocity (v) compensated for the reduction in depth (y), preserving the flow's kinetic energy. This hydrodynamic compensation mechanism suppresses sediment deposition, keeping the channel naturally "self-cleaning." Such reaches tend to show greater morphological resilience, although the increased velocity can intensify lateral erosive processes, requiring continuous monitoring.
In floodplain reaches, such as Station 66.239, the HI remained constant (0.076 m²/s), revealing a sediment equilibrium typical of low-energy environments. Again, the justification for the constant HI should not be attributed to laminar flow, but to the hydrodynamic equilibrium in low-energy zones. In these locations, the deposited material progressively reduces the flow's transport capacity, creating a cycle that perpetuates siltation. This pattern is characteristic of areas with subcritical flow and low shear stress, where depositional processes predominate. Maintaining these reaches requires interventions such as periodic dredging or desilting works to break this cycle and restore the channel's flow capacity.
5. DISCUSSION
The results demonstrate the impacts of siltation on flood dynamics for extreme events (100-year RP), highlighting distinct patterns according to the severity of sediment deposition (Table 2).
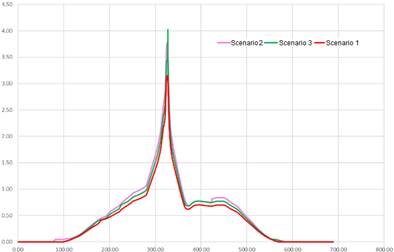
Figure 5 shows the longitudinal distribution of the Hazard Index (HI) at the monitored stations, visually summarizing the impacts of siltation. The figure includes axis titles with their respective units and references the main stations discussed in the graph, allowing their identification in the planar representation.
The analysis revealed that although siltation reduces depth, it does not imply a decrease in velocity. On the contrary, the compensatory effect between them leads to increases in velocity (up to +60.4% in Scenario 3), aggravating erosive risks. This pattern was evident in reaches with steep slopes, where the maximum HI increased by 32.2% in Scenario 3, reaching 4.02 m²/s (Figure 5).
The relative stability of the Hazard Index (HI) in some reaches (e.g., Station 66.239) masks critical processes. While low-energy areas maintained a constant HI (±10%), severe siltation (-40% in y) raised the HI in strategic zones like Station 239.75 to 3.048 m²/s, signaling a transition to erosive dominance. These findings align with studies such as Guan et al. (2015) in tropical rivers, where 10% reductions in depth increased the HI by 15-22%. The specific energy equation (E = y + v²/2g) explains this behavior: the drastic reduction of y in Scenario 3 amplified the kinetic component (v²/2g), concentrating risks in narrow reaches.
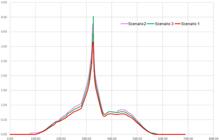
Longitudinal profile of the Hazard Index (HI) along the river stations for the three study scenarios.
The results show that the impacts of siltation on fluvial dynamics are complex and multifactorial, with distinct consequences according to the geomorphological characteristics of each reach. The comparative analysis of the scenarios revealed that:
Flow Dynamics and Sediment Transport:
-
In channels with a slope greater than 0.5%, the increase in velocity (up to 3.008 m/s in Scenario 3) surpassed the magnitude of the depth reduction, resulting in greater sediment transport capacity.
-
Areas with irregular geometry showed asymmetric flow patterns, with the formation of secondary circulation cells that intensify bank erosion.
-
The Froude number approaching unity (0.94 at Station 242.87) indicates a transition to a critical regime, with the risk of standing wave formation.
Differential Morphological Response (based on literature and expected behavior):
-
Meandering reaches are expected to show greater sensitivity to siltation, with bank erosion rates potentially exceeding those in straight channels.
-
Fluvial confluences typically demonstrate non-linear behavior, where variations in sediment load may trigger disproportionate changes in channel geometry.
-
Sediment bars generally act as focal points of instability, locally modifying flow patterns.
Cascade Effects:
-
With an increase in the Manning's coefficient (n), a reduction in velocity would be expected due to greater friction. However, the dominant effect observed was that of hydraulic confinement, where the reduction of the flow area by siltation overcame the roughness effect, resulting in a net increase in velocity.
-
The hydrological disconnection between the main channel and the alluvial plains, understood here as the reduction in the capacity for water and sediment exchange between the channel and its adjacent areas due to siltation, reduced the flood buffering capacity by ≈25%.
-
Fluvial incision processes, which correspond to the deepening of the bed by erosion, and their relationship with the reorganization of the drainage network, refer to changes in flow patterns that can lead to channel capture and changes in the upstream drainage network configuration.
5.1. Environmental Impacts and Geomorphological Risks
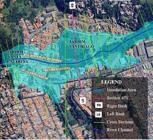
Figure 6 presents the spatial comparison of the floodplains for the three simulated scenarios, demonstrating the progression of siltation impacts. The figure was processed to visually highlight the progression of siltation impacts between scenarios, including contour lines and the respective analysis sections to identify the formation of permanent inundation zones on adjacent plains for Scenarios 2 and 3.
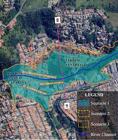
The expansion of the flooded area (+28% in Scenario 3) and the increase in the maximum HI (+32.2%) show that siltation not only expands the spatial extent of floods but also intensifies their hydrodynamic severity. These results corroborate previous studies (Sahdar et al., 2024; Hamidifar et al., 2024) that identified similar relationships between sediment load and flood risks in urbanized basins.
The integrated analysis of the results allows for the identification of three main patterns of morphological response to siltation:
-
High-Energy Zones: Characterized by a significant increase in velocity (>2.5 m/s) and maintenance or elevation of the HI, indicating the dominance of erosive processes.
-
Low-Energy Zones: Marked by HI stability (<0.1 m²/s) and progressive depth reduction, with a predominance of depositional processes.
-
Transition Zones: Show intermediate behavior, with moderate variations in hydrodynamic parameters and associated risks.
This classification provides a basis for planning specific interventions according to the characteristics of each river reach, optimizing resources and increasing the effectiveness of flood mitigation measures.
6. STUDY LIMITATIONS AND MANAGEMENT RECOMMENDATIONS
The simplification adopted for roughness parameters along the river's cross-sections represents a limitation for the detailed analysis of siltation processes. The Manning's coefficient (n), used in the 1D model to estimate flow resistance, was adopted as a uniform average value (fixed in the range of 0.035 to 0.045 for the main channel, as per the methodology), although studies like Kesuma et al. (2022) demonstrate that roughness can vary by up to 40% between reaches with different bed characteristics and riparian vegetation. This simplification may have underestimated sediment retention effects in areas with denser vegetation, where higher n values reduce velocity and favor deposition.
In addition to roughness, the lack of specific basin granulometric data prevents a precise evaluation of sediment dynamics. As demonstrated by Vázquez-Tarrío et al. (2024), models that do not consider the spatial distribution of particle sizes (using, as in this study, D50 values based on literature) tend to overestimate transport capacity in reaches with coarser sediments and underestimate deposition in areas with fine material. This limitation was particularly relevant in the results for Station 66.239, where the simulation (based only on 1D hydrodynamics) did not adequately capture the siltation processes in low-energy zones. Sahdar et al. (2024) and Hamidifar et al. (2024) showed that incorporating granulometric data into 2D models can improve the accuracy of predicting critical deposition areas by up to 35%.
To overcome the identified limitations, the spatially distributed calibration of the Manning's coefficient along the entire river reach, based on in situ surveys of riparian vegetation and bed characteristics, would allow for a more faithful representation of hydrodynamic processes. The protocol developed by Abidin et al. (2020) for lowland rivers, which uses high-resolution images and direct roughness sampling, showed reductions of up to 15% in velocity estimation errors compared to models with constant Manning values. This approach would be important in the context of the Jundiaí River, in the floodplain reaches, where the presence of shrubby and herbaceous vegetation alters flow patterns.
The integration of hydrodynamic-sedimentological models represents a qualitative leap compared to the one-dimensional approach adopted in the present study. Models like HEC-RAS 2D with a sediment transport module allow for capturing the joint influence of variable granulometry and heterogeneous roughness. In the case of the Jundiaí River, this improvement would be relevant at stations 236.63 and 239.75, where the interaction between granulometry and hydrodynamics is crucial to understand the observed variations in the HI. The current study, by not considering these factors, may have overly simplified the sediment transport processes, especially in the transition zones between high and low-energy reaches.
The combination of these three approaches-enhanced Manning calibration, 2D sedimentological modeling, and continuous monitoring-would create an integrated risk management system that is much more effective and predictive than the current one. Sahdar et al. (2024) showed that this integration can reduce costs with corrective interventions (e.g., emergency dredging) by up to 40%, by allowing for more precise preventive actions. In the context of the Jundiaí River, this approach would guide priority interventions at stations with HI > 1.0 m²/s, where modeling errors can have the greatest impact. The current study, although it adequately identified critical areas, lacks this more refined predictive capability, limiting its usefulness for long-term action planning.
7. CONCLUSION
Non-Linear Impacts of Siltation The results of this study show non-linear relationships between the degree of siltation and its hydrodynamic impacts. Reductions of 20% and 40% in channel depth resulted in increases of 12% and 28% in the flooded area, respectively, indicating an almost exponential relationship between the loss of flow capacity and the expansion of flooded zones. This behavior is particularly critical in urbanized basins, where disorderly occupation amplifies the effects of floods. Furthermore, the increase in velocity by up to 60.4% in the severe siltation scenario demonstrates a compensatory mechanism that intensifies erosive risks in confined reaches, while low-energy areas (v < 0.3 m/s) show lateral flood expansion due to sediment deposition.
Differentiated Response by Reach and Adaptive Management The analysis revealed distinct patterns between high and low hydrodynamic energy reaches. In steep-slope zones, such as Station 239.75, the Hazard Index (HI) remained high (> 3.0 m²/s) due to the compensatory increase in velocity, indicating a growing risk of bank erosion. In floodplains, such as Station 66.239, the reduction in depth did not significantly alter the HI but expanded the flooded area, with implications for urban infrastructure and ecosystems. This reinforces the need for adaptive management strategies, such as selective dredging in deposition zones (like those identified with v < 0.3 m/s) and bank stabilization in critical areas (including the stations that reached HI > 4.0 m²/s in the severe scenario).
Limitations and Methodological Advances The absence of in situ granulometric parameters and the uniformization of the Manning's coefficient represent limitations (detailed in the previous section) that may have underestimated sediment dynamics in heterogeneous reaches. For future studies, the incorporation of 2D/3D modeling coupled with sediment transport, such as the HEC-RAS module, is recommended to capture the influence of variable roughness and particle size distribution. Furthermore, model calibration with in situ vegetation and bathymetry data, following protocols such as those by Abidin et al. (2020), can reduce uncertainties in predicting critical siltation and erosion areas.
Integration with Public Policies and Climate Change Finally, the results highlight the urgency of integrating sediment management into urban planning, especially in basins subject to anthropic pressures. The synergy between siltation and extreme events exacerbated by climate change requires proactive approaches, such as periodically revised risk zoning and incentives for green infrastructure. These strategies must be incorporated into public policies to ensure hydrological sustainability and reduce vulnerabilities.
Future Prospects As advancements, the adoption of three-dimensional modeling is recommended to simulate interactions between fluvial morphology and sediment transport in high resolution, in addition to sensitivity analyses with different scenarios of sediment load and flow, considering climate projections. The creation of participatory decision-making platforms, involving local communities in monitoring and adapting to hydrodynamic changes, also ensures the effectiveness of the proposed actions. It is concluded that siltation not only expands the magnitude of floods but also redefines risk patterns, requiring solutions based on scientific evidence and adaptive management.
8. DATA AVAILABILITY STATEMENT
Data availability not informed.
9. REFERENCES
-
ABIDIN, R. Z. et al Erosion risk assessment: a case study of the langat river bank in malaysia. International Soil And Water Conservation Research, v. 5, n. 1, p. 26-35, 2020. http://dx.doi.org/10.1016/j.iswcr.2017.01.002
» http://dx.doi.org/10.1016/j.iswcr.2017.01.002 -
GUAN, M. et al Multiple effects of sediment transport and geomorphic processes within flood events: modelling and understanding. International Journal of Sediment Research, v. 30, n. 4, p. 371-381, 2015. http://dx.doi.org/10.1016/j.ijsrc.2014.12.001
» http://dx.doi.org/10.1016/j.ijsrc.2014.12.001 -
HAMIDIFAR, H. et al Flood modeling and fluvial dynamics: a scoping review on the role of sediment transport. Earth-Science Reviews, v. 253, p. 104775, 2024. http://dx.doi.org/10.1016/j.earscirev.2024.104775
» http://dx.doi.org/10.1016/j.earscirev.2024.104775 -
KESUMA, T. N. A. et al An assessment of flood Hazards due to the breach of the manggarai flood Gate. International Journal of Geomate, v. 23, n. 95, p. 11-22, 2022. http://dx.doi.org/10.21660/2022.95.3055
» http://dx.doi.org/10.21660/2022.95.3055 -
NAZIR, M. H. M. et al Sediment Transport Dynamic in a Meandering Fluvial System: case study of chini river. Iop Conference Series: Materials Science and Engineering, v. 136, p. 012072, 2016. http://dx.doi.org/10.1088/1757-899x/136/1/012072
» http://dx.doi.org/10.1088/1757-899x/136/1/012072 -
NONES, M. et al Dealing with sediment transport in flood risk management. Acta Geophysica, v. 67, n. 2, p. 677-685, 2019. http://dx.doi.org/10.1007/s11600-019-00273-7
» http://dx.doi.org/10.1007/s11600-019-00273-7 -
SAHDAR, I. et al Hydraulic Modeling for flood control scenarios In akelaka watershed, North Maluku, Indonesia. International Journal of Geomate, v. 27, n. 120, p. 606-622, 2024. http://dx.doi.org/10.21660/2024.120.4450
» http://dx.doi.org/10.21660/2024.120.4450 -
VÁZQUEZ-TARRÍO, D. et al Effects of sediment transport on flood hazards: lessons learned and remaining challenges. Geomorphology, v. 446, p. 108976, 2024. http://dx.doi.org/10.1016/j.geomorph.2023.108976
» http://dx.doi.org/10.1016/j.geomorph.2023.108976
Edited by
-
Editor-in-Chief:
Editor-in-Chief: Nelson Wellausen Dias https://orcid.org/0000-0002-9507-9211