
Abstract
Electricity is undoubtedly one of the most important resources in the modern world. As the demand for electric energy increases, conventional resources that are transformed into electric energy are being exhausted, generating a need to search for alternative sources, resulting in a significant increase in energy costs. This study presents an integrated project of an intelligent microgrid and energy management aimed at reducing energy costs. At the Federal University of Paraná (UFPR), electricity represents an annual cost of over BRL 13 million, which is the third largest operating expense of the university. In addition, the public education budget in Brazil has been decreased in recent years. Therefore, this study was conducted within the scope of UFPR and aimed to analyze three alternatives to reduce electric energy costs: i) demand management through an analysis of energy bills, ii) migration to the free energy market, and iii) the development of an in-house photovoltaic generation facility. A computational tool to optimize the contracted demand and simulate the annual savings with the free market and distributed generation projects was developed using Microsoft Excel. Payback, the net present value, and the internal rate of return were calculated. Finally, the economic viability of all alternatives was proven, with demand management demonstrating an economic potential of greater than BRL 500,000 per year, use of the free market saving more than BRL 300,000, and the developed in-house photovoltaic generation system achieving an economic impact of more than BRL 600,000 per year.
Keywords:
electricity consumption; distributed generation; free energy market; energy management; economic viability
INTRODUCTION
In the current global context, a strong increase in electricity demand is occurring. Global electricity consumption grew 2.6% in 2017 from the previous year [11 Global Energy Statistical Yearbook 2018 [Internet]. Grenoble: ENERDATA. c2009-2019. available from: https://yearbook.enerdata.net/electricity/electricity-domestic-consumption-data.html
https://yearbook.enerdata.net/electricit...
]. Figure 1 shows a historical assessment of electricity consumption between 1990 and 2017.
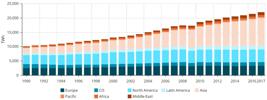
Although this growth is clearly due to the increase in the world population, it is also due to the economic growth of previously undeveloped countries owing to the correlation between the level of development of a country and its consumption of electricity per capita: The United States has an annual per capita consumption of 11,974 kWh versus only 2,414 kWh/year in Brazil. Even Australia, a developed country that has a similar climate to Brazil, consumes much more energy per capita, at 9,624 kWh/year.[22 The World Factbook. Langley (VA) [Internet]. Central Intelligence Agency (CIA). Available from: https://www.cia.gov/library/publications/the-world-factbook/.
https://www.cia.gov/library/publications...
]
Therefore, in the coming years Brazil will likely experience a significant growth in energy consumption. In the latest edition of Brazil’s Ten-Year Energy Plan [33 Ten-Year Expansion Plan 2017-2027 [Internet]. Brasília. The Energy Research Company. Available from: http://www.epe.gov.br/sites-pt/publicacoes-dados-abertos/publicacoes/PublicacoesArquivos/publicacao-332/PDE%202027.pdf.
http://www.epe.gov.br/sites-pt/publicaco...
], prepared annually by the Energy Research Company, an annual growth of 3.8% per year is expected to occur until 2024, which will represent an increase in demand of approximately 2,900 MW. At the same time, through a national energy balance [44 National Energy Balance. Brasília. The Energy Research Company. Available from: https://ben.epe.gov.br/downloads/Relatorio_Final_BEN_2017.pdf.
https://ben.epe.gov.br/downloads/Relator...
], alternative energy sources, notably biomass, solar, and wind, accounted for only 13.7% of the Brazilian electricity matrix in 2017.
Another important trend is the enormous growth in the price of energy in Brazil during past years. In the state of Paraná, where the Federal University is located, and therefore where the present study was conducted, the local power distribution company increased its tariffs by 16% in 2016 alone, despite only a 2% inflation rate across Brazil. Considering that electricity is the second largest cost of a university’s budget and that the overall budget for the universities in Brazil has been cut during the past few years, this cost increase is indeed meaningful.
In summary, concern for the future of the world’s energy matrix, combined with the strategic importance of electricity in terms of the costs involved, makes it important to study and propose new ways for a more efficient energy use.
Thus, this study explores three different alternatives: First, a computational tool was developed to optimize the contracted demand from the power distribution company. Next, migration to the Brazilian free energy market was simulated, and finally, a distributed generation system was designed. Herein, details on the specifics of the Brazilian rules and the energy market will be further described.
MATERIAL AND METHODS
Energy Management
In Brazil, energy prices for large consumers such as the Federal University of Paraná are divided in two different parts: the energy price and the demand price. The demand price is related to the maximum power (in kW) that a consumer demands from the grid. Consumers must inform their demand to the power distribution company in advance. If the actual demand exceeds the informed demand, the tariffs applied are far more expensive than the regular tariffs, and if the actual demand is lower than informed, consumers still pay for the full contracted demand. Therefore, accuracy is important when informing the demand because if there are differences between the informed demand and the actual demand, both up or down, unnecessary costs will be incurred.
In addition, two different calculation methods apply in Brazil: a green tariff and a blue tariff. A green tariff has only one price for power demand during all times of the day, whereas a blue tariff charges more for the demand during peak hours and less throughout the rest of the day. Consumers can choose between these two options.
Equation 1 summarizes the cost composition for demand tariffs:
where D is the actual power demand, Dt is the demand tariff, D+ is the amount of power exceeding the contracted demand (Dt+ being the tariff for this case), and D_ is the amount of power contracted but not utilized (Dt_ being the tariff for this case).
For the blue tariff, equation (1) must be applied twice, once for peak hours and again for the rest of the day.
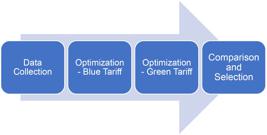
To optimize the contracted demand, a 12-month analysis was conducted, for which the actual demand data, measured by the local power distribution company, were collected. Two optimization problems were then solved to find the contracted demand that would result in the lowest annual costs for both the green and blue tariffs. Finally, the costs obtained from the two optimization processes were compared, and the best alternative was selected. The difference between the best alternative and the actual cost paid by the university is the potential savings. Figure 2 summarizes this process.
Free Energy Market
Large consumers such as the Federal University of Paraná have two different market options in contracting energy in Brazil: a captive market, where tariffs are regulated by the National Electrical Energy Agency and the free market, where prices are negotiated without restrictions by consumers and generators.
With constant price increases in the captive market, increasing numbers of consumers are opting out of it, migrating their businesses to the free market. Figure 3 shows the evolution of the number of free-market consumers during the past few years.

To enter the free market, consumers must hire an accredited company to make transactions between the different agents in the Electrical Energy Commercialization Chamber, and an administration fee may apply.
Another factor to be considered is the type of energy to be purchased. Brazil divides energy into two categories:
- conventional energy, generated by thermal and hydraulic sources;
- incentivized energy, generated by alternative sources such as solar, wind, and biomass.
Although incentivized energy has greater production costs and therefore higher overall costs, the Brazilian law stipulates a discount of 50%–100% in the transmission and distribution fees when this type of energy is purchased. Thus, there is not a clear solution that provides the lowest costs to consumers. Owing to such uncertainty, both scenarios were considered, namely, purchasing conventional energy only or incentivized energy only when considering a 50% discount in the tariffs for the latter.
To compare the costs between the free and captive markets, the following methodology was utilized:
- The real costs for a 12-month period in the captive market were collected (from the local power distribution company).
- An accredited company that can deal energy in the commercialization chamber (namely, COPEL Energia) was consulted, and energy tariffs in the free market were obtained.
- The costs of the migration (mainly owing to the mandatory upgrade in the measurement systems of the consumers, according to Brazilian regulations) were obtained.
- The financial indicators of the project (net present value, internal rate of the return, and the payback time) were calculated.
It was estimated that each measurement system that requires changes for compliance with the Brazilian regulations incurs a cost of BRL 20,000.00 [55 Lang LF. Photovoltaic generation and free energy market viability analysis for the Federal University of Paraná [dissertation]. Curitiba: Federal University of Paraná; 2017.].
Solar Energy System
There is currently a project being conducted at the Federal University of Paraná that includes the installation of a solar power system, with a peak power of 1 MW. Thus, this amount of power was considered for the simulations applied in this project.
The choice of photovoltaic panels to be utilized was made using the relation between the investment to be realized and the peak power capacity of the panel (BRL/Wp) as the main criterion. Six different models were compared, as shown in Table 1.
Thus, a Sinosola SA275 - 60P panel was selected, with a peak power of 275 W and a cost of BRL 2.07 per watt. A total of 3.836 panels were considered, with a total peak power of 1054,9 kW.
For the inverters, the same method was utilized: Four different models were considered, and the model that provided the lowest cost per kilowatt of input power was selected, according to Table 2.
Thus, to satisfy an input power of 1054.9 kW, 19 Schneider Electric on Grid 500 and two Fronius Symo 20.0 inverters were selected.
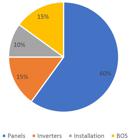
In addition to the panels and inverters, there are other costs involved, such as installation costs; additional components (string boxes, conductors, etc.), generally called a Balance of System; and metal structures for the panel support when considering the slope required for optimal generation. It was concluded that the cost of the metal structures is equal to 73% of the cost of the panels and inverters [66 De Souza GP. Analysis of the technical and economic feasibility of migrating captive consumers to the free energy market: case study in red ceramic industries located in Sombrio / SC [dissertation]. Araranguá: Federal University of Santa Catarina; 2016.]. For the additional components and installation, the cost breakdown proposed by Ruther in 2004 is as shown in Figure 4 [77 Ruther R. Photovoltaic Solar Buildings: The Potential of Photovoltaic Solar Generation Integrated with Urban Buildings and Interconnected to the Public Electricity Grid in Brazil. Florianópolis: Federal University of Santa Catarina; 2004.].
The solar irradiation data were obtained from SunData, one of the most respected databases on solar energy in Brazil. In the city of Curitiba, where UFPR is located, the daily average irradiation is 4.39 kWh/m2*day.
Within the time frame of a single day, an estimation of the energy production of the system can be obtained from equation (2)
where E is the energy to be generated daily, Pfv is the power of the solar panels, IR is the daily solar irradiation, and PR is the performance ratio of the system, which is estimated to be 80%.
Finally, an economic viability study was conducted according to the following procedure:
-
the total installation cost was obtained;
-
the expected energy production was calculated according to equation (2);
-
the total financial savings were calculated, in which the amount of energy produced by the solar panels (and therefore not consumed from the grid) was multiplied by the current energy tariff.
-
The financial indicators (NPV, IRR, and payback time) were calculated.
RESULTS
For the energy management part of the study, the green tariff was best suited for this case. In a real scenario, the Federal University of Paraná contracted an average power of 5.078 kW throughout its 23 measuring systems in 2018. After the optimization process, the total amount of contracted power could be reduced to 4.931 kW. The overall difference was small, but each of the 23 units has its own situation: some were over-contracting, paying for a demand that was not used, and several others were under-contracting, paying high fares for not complying with the contract. Thus, the financial savings were quite significant: with the optimized contracted demand, the university would save BRL 214,660.75 in one year.
The free market alternative also provided a good financial return: For the migration of the 23 units of UFPR, the total costs for upgrading the measurement systems would be BRL 460,000.00.
Considering the purchase of incentivized energy, COPEL Energia provided data that suggest a reduction of 27.83% in the energy tariffs when compared to the captive market. When applied to a 12-month period (the year 2017), this reduction combined with the discount in distribution and transmission fees correspond to approximately BRL 3.7 million in savings. The NPV of this case was BRL 3.146 million, with an IRR of 67% and a payback time of 2 months.
For conventional energy, COPEL Energia suggested a reduction of 31.95% in tariffs, but without discounts of the distribution and transmission fees, and the annual savings were approximately only BRL 3.5 million. The NPV for this case was BRL 2.928 million, with an IRR of 63% and a payback time of 2 months.
Finally, the installation of the solar panels also resulted in economic viability. The total costs of installation estimated using the methodology proposed earlier in this paper was BRL 5.98 million. The annual energy production according to equation X is 1.352 MWh/year, which accounts for a savings of BRL 686,539,97.
Considering a 25-year life cycle for the solar-panel system, a 0.8% decrease in generation each year owing to a degradation of the components, and an annual readjustment of 7.6% in energy prices (which was the 10-year average in Brazil from 2007 to 2017), the financial indicators of this project are as follows:
-
NPV of BRL 10.306 million;
-
IRR of 16,56%;
-
payback time of 10 years.
DISCUSSION
The objective of this work was to analyze three alternatives for reducing the costs of electricity at UFPR, namely, energy management, the free energy market, and solar photovoltaic generation, in terms of the annual potential of the economy and the economic viability of the investments.
It was highlighted that all three alternatives reached economic viability, with a positive net present value and an internal rate of return of higher than the minimum attractiveness rate of 12%.
Migration to the free energy market showed an extremely interesting potential, with almost immediate payback times (2 months). It is also interesting to see that incentivized energy reached the best financial indicators when compared to conventional energy.
Regarding energy management, it was shown that simple actions with no expenses, namely, simply changing the informed demand to the power distribution company, can result in a large difference in costs.
Solar energy has also shown significant progress. Although the payback time remains high, the annual savings of solar energy were the greatest among the three alternatives.
-
HIGHLIGHTS
-
• Three different alternatives for financial savings in electrical energy markets
-
• High-powered microgrid (1 MW)
-
• Brazilian market context
REFERENCES
-
1Global Energy Statistical Yearbook 2018 [Internet]. Grenoble: ENERDATA. c2009-2019. available from: https://yearbook.enerdata.net/electricity/electricity-domestic-consumption-data.html
» https://yearbook.enerdata.net/electricity/electricity-domestic-consumption-data.html -
2The World Factbook. Langley (VA) [Internet]. Central Intelligence Agency (CIA). Available from: https://www.cia.gov/library/publications/the-world-factbook/
» https://www.cia.gov/library/publications/the-world-factbook/ -
3Ten-Year Expansion Plan 2017-2027 [Internet]. Brasília. The Energy Research Company. Available from: http://www.epe.gov.br/sites-pt/publicacoes-dados-abertos/publicacoes/PublicacoesArquivos/publicacao-332/PDE%202027.pdf
» http://www.epe.gov.br/sites-pt/publicacoes-dados-abertos/publicacoes/PublicacoesArquivos/publicacao-332/PDE%202027.pdf -
4National Energy Balance. Brasília. The Energy Research Company. Available from: https://ben.epe.gov.br/downloads/Relatorio_Final_BEN_2017.pdf
» https://ben.epe.gov.br/downloads/Relatorio_Final_BEN_2017.pdf -
5Lang LF. Photovoltaic generation and free energy market viability analysis for the Federal University of Paraná [dissertation]. Curitiba: Federal University of Paraná; 2017.
-
6De Souza GP. Analysis of the technical and economic feasibility of migrating captive consumers to the free energy market: case study in red ceramic industries located in Sombrio / SC [dissertation]. Araranguá: Federal University of Santa Catarina; 2016.
-
7Ruther R. Photovoltaic Solar Buildings: The Potential of Photovoltaic Solar Generation Integrated with Urban Buildings and Interconnected to the Public Electricity Grid in Brazil. Florianópolis: Federal University of Santa Catarina; 2004.
Publication Dates
-
Publication in this collection
25 Nov 2019 -
Date of issue
2019
History
-
Received
05 Nov 2018 -
Accepted
26 July 2019


