Abstract
Because it is not known where in the reflex arch, i.e., afference, central nervous system or efferences, hyperglycemia affects baroreflex function, the present study examined the effect of short-term (30 min) hyperglycemia on aortic depressor nerve function measured by a mean arterial pressure vs aortic depressor nerve activity curve, fitted by sigmoidal regression, or by cross-spectral analysis between mean arterial pressure and aortic depressor nerve activity. Anesthetized male Wistar rats received an intravenous bolus (0.25 mL) injection, followed by 30 min of infusion (1 mL/h) of 30% glucose (N = 14). Control groups received a bolus injection and infusion of 0.9% saline (N = 14), or 30% mannitol (N = 14). Glucose significantly increased both blood glucose and plasma osmolarity (P < 0.05). Mean arterial pressure did not change after glucose, saline or mannitol infusion. Mean arterial pressure vs nerve activity curves were identical before and 10 and 30 min after the beginning of glucose, saline or mannitol infusion. Slow (0.3 Hz) oscillations of arterial pressure were induced by controlled bleeding, and cross-spectral analysis was applied to arterial pressure and aortic nerve activity. Transfer function magnitude (aortic depressor nerve activity/mean arterial pressure ratio in the frequency domain) was calculated as an index of gain of the aortic depressor nerve. Transfer function magnitude was similar in all groups during induced or spontaneous oscillations of arterial pressure. In conclusion, the present study demonstrates, by means of two different approaches for assessing baroreceptor function, that aortic depressor nerve activity was not altered by short-term (30 min) hyperglycemia.
Pressoreceptors; Hyperglycemia; Arterial pressure; Spectral analysis
Braz J Med Biol Res, November 2007, Volume 40(11) 1567-1576
Does acute hyperglycemia alter rat aortic depressor nerve function?
D.A. Huber, J.M. do Carmo, J.A. Castania, R. Fazan Jr. and  Correspondence and Footnotes
 H.C. Salgado
Departamento de Fisiologia, Faculdade de Medicina de Ribeirão Preto, Universidade de São Paulo, Ribeirão Preto, SP, Brasil
 References
Correspondence and Footnotes
Correspondence and Footnotes
Correspondence and Footnotes
Abstract
Because it is not known where in the reflex arch, i.e., afference, central nervous system or efferences, hyperglycemia affects baroreflex function, the present study examined the effect of short-term (30 min) hyperglycemia on aortic depressor nerve function measured by a mean arterial pressure vs aortic depressor nerve activity curve, fitted by sigmoidal regression, or by cross-spectral analysis between mean arterial pressure and aortic depressor nerve activity. Anesthetized male Wistar rats received an intravenous bolus (0.25 mL) injection, followed by 30 min of infusion (1 mL/h) of 30% glucose (N = 14). Control groups received a bolus injection and infusion of 0.9% saline (N = 14), or 30% mannitol (N = 14). Glucose significantly increased both blood glucose and plasma osmolarity (P < 0.05). Mean arterial pressure did not change after glucose, saline or mannitol infusion. Mean arterial pressure vs nerve activity curves were identical before and 10 and 30 min after the beginning of glucose, saline or mannitol infusion. Slow (0.3 Hz) oscillations of arterial pressure were induced by controlled bleeding, and cross-spectral analysis was applied to arterial pressure and aortic nerve activity. Transfer function magnitude (aortic depressor nerve activity/mean arterial pressure ratio in the frequency domain) was calculated as an index of gain of the aortic depressor nerve. Transfer function magnitude was similar in all groups during induced or spontaneous oscillations of arterial pressure. In conclusion, the present study demonstrates, by means of two different approaches for assessing baroreceptor function, that aortic depressor nerve activity was not altered by short-term (30 min) hyperglycemia.
Key words: Pressoreceptors, Hyperglycemia, Arterial pressure, Spectral analysis
Introduction
Diabetes is commonly associated with peripheral neuropathy, with functional, morphological, and metabolic changes in peripheral nerves (1). Dysfunction of the baroreflex has been well described not only in diabetic patients (2,3) and chronic models of diabetes (4-6), but also in short-term (5 days) experimental diabetes (7). Even though modest elevations of plasma glucose are associated with reduction of reflex control of heart rate in healthy volunteers (8,9), there is no report in the literature dealing with the acute effects of elevated blood glucose on the afferent arm (baroreceptors) of the arterial baroreflex in non-diabetic subjects. It has been shown that acute hyperglycemia increases muscle sympathetic nerve activity in healthy subjects after 1 h of glucose infusion (10). In addition, it has been reported that acute hyperglycemia (15 to 30 min) reduces nerve conduction velocity and nerve blood flow in rats (11). However, the mechanism(s) by which the increase in blood glucose affects the baroreflex is (are) not apparent. Accordingly, it is not known precisely where the derangement caused by hyperglycemia on the baroreflex occurs, i.e., in the afferent arm (arterial baroreceptors), central nervous system, or efferent arm (sympathetic or parasympathetic system) of the reflex arch.
The relationship between arterial pressure and aortic depressor nerve (ADN) activity is the most common approach used to evaluate baroreceptor function in rats and other species (12). Nevertheless, the arterial pressure vs ADN activity curve depends on remarkable changes in arterial pressure for the characterization of the entire ADN activity range from threshold through saturation of the action potentials (4,12,13). This requires a situation far from the usual physiological condition. On the other hand, transfer function analysis applied to arterial pressure and baroreflex-mediated output parameters, i.e., heart rate or sympathetic nerve activity, has been established as a reliable tool for the analysis of baroreflex function using the spontaneous oscillations of arterial pressure (14,15). Cross-spectral analysis between arterial pressure and ADN activity has been used successfully in our laboratory to characterize the sensitivity of the aortic baroreceptors of anesthetized rats (6).
Therefore, in the present study, the effect of acute hyperglycemia on ADN function in rats was examined by means of two different approaches, i.e., mean arterial pressure (MAP) vs ADN activity curve fitted by sigmoidal regression, and transfer function analysis between MAP and ADN activity. Coherence and transfer function magnitude (ADN activity/MAP ratio, in the frequency domain) were calculated during induced slow (0.3 Hz) oscillations of arterial pressure used to mimic sympathetic modulation of vascular tone (Mayer waves), and during spontaneous (~1.5 Hz) oscillations of arterial pressure caused by respiratory movements.
Material and Methods
Animals
Experiments were performed on male Wistar rats (200-250 g), housed in cages with free access to water and food. All procedures were reviewed and approved by the Ethics in Animal Research Committee of the School of Medicine of Ribeirão Preto, University of São Paulo, SP, Brazil.
Baroreceptor recording in anesthetized rats
On the day of the experiment the animal was anesthetized with sodium pentobarbital (40 mg/kg, ip) and catheters were inserted into the right carotid artery, with the tip positioned close to the aortic arch, for measurement of arterial pressure, and into the right femoral artery and vein, for withdrawal and reinfusion of blood and drug administration, respectively. The left ADN was identified in the neck, carefully isolated from connective tissue, and placed on a bipolar stainless steel pair of electrodes. ADN activity was amplified using a differential high impedance preamplifier (Princeton Applied Research, Oak Ridge, TN, USA) and digitally recorded (10 kHz) with an IBM/PC by means of an A/D interface (CAD 12/36 Lynx Eletrônica, São Paulo, SP, Brazil). Arterial pressure was measured by connecting the carotid catheter to a Statham (P23Gb, Hato Hey, Puerto Rico) pressure transducer, attached to a Hewlett Packard Carrier Amplifier (model 8805B, Palo Alto, CA, USA), and digitally recorded simultaneously with ADN activity. Bipolar recording from the external ADN surface shows bursts of bipolar activity tightly correlated with the systolic phase of the pulse pressure over a small background noise.
The rats were divided into three groups according to type of treatment: glucose (N = 7), saline (N = 7) or mannitol (N = 7). Arterial pressure and ADN activity were recorded continuously for 10 min under basal conditions, and an intravenous bolus injection (0.25 mL) of 30% glucose, 0.9% saline, or 30% mannitol was administered thereafter, followed by constant infusion (1 mL/h) of glucose, saline or mannitol for 30 min.
Baroreceptor function assessment
Mean arterial pressure vs aortic depressor nerve activity curve. MAP vs ADN activity curves were constructed before (basal recording) and after (10 and 30 min) the beginning of the infusion of glucose, saline or mannitol. To determine the MAP vs ADN activity curve, baroreceptor activity was recorded during the increase in arterial pressure elicited by a bolus injection of phenylephrine (8 µg/kg, iv) until saturation (maximal activity) of the action potential. Next, after ADN activity returned to basal level, following arterial pressure normalization, ADN activity was recorded during the decrease in arterial pressure elicited by a bolus injection of sodium nitroprusside (16 µg/kg, iv) until complete disappearance of the action potentials. ADN activity was rectified and its background noise was subtracted (the noise level of each nerve recording was determined after injection of sodium nitroprusside, when arterial pressure reached the threshold level under baroreceptor pressure). Rectified and noise-subtracted ADN activity was integrated, with the integrative processes resetting at the time of every diastolic pressure. To compare multifiber ADN activity from different rats, baroreceptor bursts were normalized as a function of basal activity (basal = 100%) (16) determined before the administration of phenylephrine and sodium nitroprusside, and the MAP vs ADN activity curve, fitted by 4-parameter nonlinear sigmoidal regression, was plotted (Figure 1). The maximum slope (gain) of the baroreceptor curve was calculated from the first derivative of the sigmoidal fit. MAP corresponding to the threshold pressure for baroreceptor activation (MAPth), and MAP needed to achieve maximum ADN activity, i.e., saturation (MAPsat) of ADN activity, were calculated from the third derivative of the sigmoidal curve by means of the identification of the first (MAPth) and second (MAPsat) points of maximal inflexion of the sigmoidal curve.
Cross-spectral analysis. To evaluate baroreceptor function in the frequency domain, small (5 to 10 mmHg) rhythmic oscillations of arterial pressure were artificially induced in anesthetized rats at 0.3 Hz, during a period of 1 to 2 min, before (basal recording) and after (10 and 30 min) the beginning of glucose (N = 7), saline (N = 7), or mannitol (N = 7) infusion.
These oscillations were obtained by withdrawal and reinfusion of a small volume of blood into the femoral artery, led by a sinusoidal wave displayed on an oscilloscope (model 5113, Tektronics, Beaverton, OR, USA). The volume of blood needed to cause arterial pressure oscillation around 10 mmHg varied from 0.2 to 0.4 mL. The frequency of 0.3 Hz was chosen to induce rhythmic oscillations because it matches the well-known low frequency oscillation of arterial pressure (Mayer's waves) exhibited by conscious rats (17), which disappears under anesthesia (18). Spontaneous oscillations induced by breathing (~1.5 Hz in anesthetized rats) were also used to assess baroreceptor function in the frequency domain. ADN activity was integrated (by voltage) in every pulse interval and normalized as a function of basal activity (basal = 100%). The average pulse interval from the entire recording period was used as the time between successive beat-by-beat values of either MAP or integrated ADN activity. Therefore, both MAP and ADN events were assumed to occur at the same time. Beat-by-beat series of MAP and integrated ADN activity were submitted to cross-spectral analysis using an autoregressive algorithm, with the model order chosen according to Akaike's criterion, to obtain the frequency spectrum of MAP oscillations and ADN activity response (19). To quantify the linear dependence of the ADN activity response to MAP oscillations, the coherence function of the cross-spectrum was calculated (19,20). At those frequencies for which coherence was found, the magnitude of transfer function between ADN activity and MAP was calculated. Transfer function magnitude indicates the relative amplitude of ADN activity change per unit of change in MAP, and is expressed as % basal activity/mmHg. We hereafter refer to transfer function magnitude as ADN sensitivity (gain). The phase shift (radians) is also a function of frequency and indicates, with respect to MAP, a lag or lead in the ADN activity response (20). The computer software used to evaluate baroreceptor function by cross-spectral analysis was kindly provided by Dr. Alberto Porta, Department of Technologies for Health, Galeazzi Orthopedic Institute, University of Milan, Milan, Italy.
Statistical analysis
Data are reported as mean ± SEM. MAP, plasma glucose and plasma osmolarity were compared between rats treated with glucose, saline or mannitol by two-way analysis of variance for repeated measures, followed by the post hoc Tukey test. The parameters calculated from the sigmoidal fitting curve (gain, MAPth, Mapsat, and MAP corresponding to 50% of ADN activity range, MAP50) or by cross-spectral analysis (transfer function magnitude) were compared between rats treated with glucose, saline or mannitol by the non-parametric Mann-Whitney test. Differences were considered significant if P < 0.05.
Results
Table 1 shows that glucose infusion increased blood glucose and osmolarity without affecting MAP. Saline did not affect any variable studied, while mannitol markedly increased plasma osmolarity.
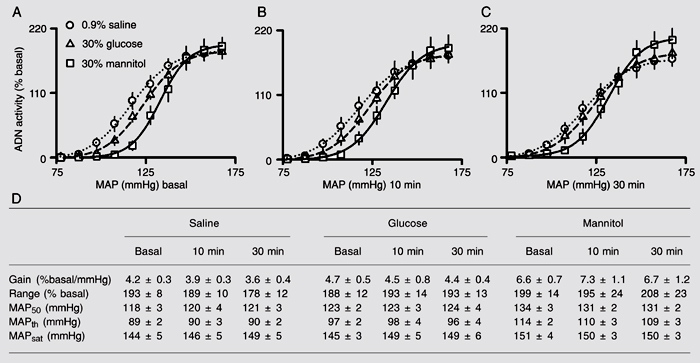
Figure 2 (bottom) shows the data used to construct MAP vs ADN activity curves (Figure 2, top) obtained before (Figure 2A), 10 (Figure 2B), and 30 min (Figure 2C) after the beginning of intravenous infusion of glucose, saline or mannitol. The data in Figure 2D indicate that the basal parameters, i.e., gain of ADN activity, range of ADN activity, MAP50, MAPth, and MAPsat, did not differ between the groups that received glucose or saline. Nevertheless, the group treated with mannitol displayed higher basal gain, MAP50 and MAPth compared to glucose and saline.
Spectral analysis showed two major oscillatory components in either MAP or ADN activity (Figure 3). The slow (induced) oscillations of these parameters were detected at 0.302 ± 0.006 Hz, while spontaneous oscillations were detected within 1.2 to 1.6 Hz. The model order for autoregressive spectral estimation, chosen by Akaike's criterion, ranged from 9 to 13 and averaged 11.6 ± 2.1. Data of power spectral density of MAP and ADN activity, as well as magnitude of squared coherence k2, and phase and transfer function between MAP and ADN activity are shown in Table 2. Glucose, saline or mannitol did not affect the gain of ADN activity at 10 (Figure 4B) or 30 min (Figure 4C) after the beginning of infusion, as compared to the gain before (Figure 4A) infusion.
Theoretical plot of mean arterial pressure (MAP) vs aortic depressor nerve (ADN) activity curve using 4-parameter logistic sigmoidal regression: A1, range; A2, slope coefficient; A3, MAP at 50% of ADN activity range; A4, lower plateau; A1 + A4, upper plateau. MAPth = map threshold for baroreceptor activation; MAPsat = map corresponding to saturation of the discharges (continuous discharges). Inset, 1st derivative of the slope (gain) of the curve.
The plots show mean arterial pressure (MAP) vs aortic depressor nerve (ADN) activity curves (top), expressed as percentage of basal activity using 4-parameter logistic sigmoidal regression, obtained before (basal, A), 10 min (B), and 30 min (C) after the beginning of intravenous infusion of 30% glucose, 0.9% saline, or 30% mannitol. D, Data used to construct the curves. MAP50 = MAP corresponding to 50% of ADN activity range; MAPth = threshold MAP for baroreceptor activation; MAPsat = MAP for saturation of discharges. Data are reported as means ± SEM for 7 rats in each group.
Time series of representative spectra collected from a representative rat during basal recording of mean arterial pressure (MAP, A), integrated aortic depressor nerve activity (ADN, B), coherence (at 0.3 and 1.3 Hz) and phase between the two spectra (C).
Gain of aortic depressor nerve (ADN) sensitivity (% of basal ADN activity/mmHg) assessed by transfer function magnitude obtained by cross-spectral analysis between mean arterial pressure and ADN activity during induced low frequency (0.3 Hz) oscillation and high frequency (~1.5 Hz) spontaneous oscillation before (basal, A) and after (10 min, B; 30 min, C) the beginning of intravenous infusion of 30% glucose, 0.9% saline or 30% mannitol. Data are reported as means ± SEM for 7 rats in each group.
Power spectral density (pwr) of mean arterial pressure (MAP) and aortic depressor nerve (ADN) activity, as well as coherence, phase and transfer function magnitude (TFM) between MAP and ADN activity during induced 0.3-Hz oscillation and spontaneous respiratory (~1.5 Hz) oscillation of arterial pressure obtained before and 10 and 30 min after the beginning of intravenous infusion of 30% glucose, 0.9% saline or 30% mannitol.
Discussion
The important finding of the present study, demonstrated by means of two different approaches for assessing baroreceptor function, i.e., MAP vs ADN activity curve fitted by sigmoidal regression and cross-spectral analysis between MAP and ADN activity, is that ADN activity was not altered by short-term (30-min) hyperglycemia. In addition, it was also demonstrated that the significant increase in plasma osmolarity observed with the infusion of glucose or mannitol also had no effect on baroreceptor function.
There are a number of reports describing an inverse relationship between blood glucose and autonomic function in healthy subjects, i.e., greater plasma glucose levels are related to poorer baroreflex function (8,9). However, to our knowledge, there is no report of an acute effect of elevated glucose levels on ADN activity, which is the afferent arm of the baroreflex arch. In the present study, it was found that baroreceptor function was preserved during a 30-min period of sustained hyperglycemia, when ADN activity was examined by means of the MAP vs ADN activity curve, fitted by 4 parameters sigmoidal regression, and by cross-spectral analysis between MAP and ADN activity.
There is a body of evidence indicating that diabetes, a remarkable example of long-term hyperglycemia, is associated with autonomic neuropathy causing derangement of baroreflex function (3). Dysfunction of the baroreflex has been well described not only in diabetic patients (2,3), but also in experimental models of diabetes (4-6). The finding that the baroreflex control of heart rate was attenuated in healthy volunteers under modest elevations of plasma glucose is at least intriguing (8,9). The sympathetic efferent component of the baroreflex arch has been studied in healthy subjects under acute glucose infusion, but the results obtained were not conclusive (10,21). While Hoffman et al. (10) reported that maintenance of mild hyperglycemia during 1 h increased muscle sympathetic nerve activity in healthy subjects, van Gurp et al. (21) observed that sustained hyperglycemia over a period of 2 h did not affect muscle sympathetic nerve activity in normal volunteers. Moreover, there are reports that glucose induced a pressor effect in healthy individuals (22,23) and rats (24), suggesting an activation of the sympathetic drive by glucose. Besides, there are reports of reduced neural firing of the dorsal motor nucleus of the vagus in rats submitted to sustained hyperglycemia (25,26). Thus, a number of studies dealing with the effect of hyperglycemia on baroreflex control of heart rate (8,9) or with sympathetic function examined using the recording of muscle sympathetic nerve activity are available (10,21). However, to our knowledge, there are no reports of the effect of acute hyperglycemia on baroreceptor function.
In the present study, when the effect of short-term hyperglycemia on ADN function was examined in rats by means of the MAP vs ADN activity curve fitted by logistic sigmoidal regression, ADN sensitivity did not differ between the groups that received intravenous infusion of glucose, saline or mannitol. The absence of baroreceptor dysfunction was also demonstrated using this methodological approach in studies carried out under conditions of chronic hyperglycemia in streptozotocin diabetic rats (12,27) and alloxan diabetic rabbits (4). Thus, our findings agree with the results of these studies, providing support to the fact that acute or chronic elevation of blood glucose does not affect baroreceptor function, as demonstrated by this reliable approach, i.e., MAP vs ADN activity curve.
In addition, the sensitivity (gain) of the baroreceptors, examined by cross-spectral analysis between MAP and ADN activity, revealed no significant difference between the groups that received intravenous infusion of glucose, saline or mannitol. Cross-spectral analysis is a methodological approach that evaluates the relationship between two parameters, and quantifies the coherence, phase and gain of the relationship between these parameters (28,29). The coherence found between MAP and ADN activity at induced (0.3 Hz) and respiratory (~1.5 Hz) oscillations demonstrated a linear correlation between these parameters, with a positive phase, indicating that induced or spontaneous (respiratory) oscillations in arterial pressure determined ADN activity variability at these frequencies. We should take into consideration that in the relationship between arterial pressure and ADN activity, the whole reflex control is operating, characterizing a closed loop condition, where, at least in theory, the use of transfer function is not recommended. Nevertheless, it should be pointed out that in the protocol used in the present study, despite the presence of a closed loop relationship, the strength of the feedback caused by the efferences of the baroreflex (sympathetic and parasympathetic activity) was negligible in pentobarbital-anesthetized rats. Therefore, the arterial pressure vs ADN activity relationship was considered to be an open loop system, and transfer function analysis was used to estimate the gain of the aortic baroreceptors in a situation closer to physiological conditions as compared to rapid changes of arterial pressure from threshold through maximum ADN activity.
The present study demonstrated, by means of two different approaches, i.e., MAP vs ADN activity curve fitted by 4 parameters of nonlinear sigmoidal regression and cross-spectral analysis between MAP and ADN activity, that short-term (30-min) hyperglycemia does not affect ADN function in anesthetized rats.
Perspectives
Remarkable autonomic dysfunction, particularly concerning the baroreflex, has been well described not only in diabetic patients (2,3), but also in chronic experimental models of diabetes (4,5,30). Short-term (5 days) diabetes also exhibited a dysfunction of the baroreflex in rats (7). Moreover, modest elevations of blood glucose are associated with poor baroreflex function in healthy volunteers (8,9). These reports documented a dysfunction of the baroreflex under hyperglycemia, but they did not establish where the derangement was located, whether in the afferent arm (baroreceptors), central nervous system, or efferent arm (sympathetic or parasympathetic) of the reflex arch. It is important to point out that a rapid and sustained (minutes) hyperglycemia may cause sympathoexcitation (10,24,30), i.e., an effect on the efferent arm of the baroreflex. It should be remembered that acute hyperglycemia promotes a remarkable increase in plasma insulin level, leading to sympathetic activation (31). Thus, one might ask if an increase in sympathetic activity under acute hyperglycemia might modulate baroreceptor function, as is the case for the protocol of the present study. Our laboratory has investigated a possible role of sympathetic activity in baroreceptor resetting (adaptation) to acute (32) and chronic (33) changes in arterial pressure. Taking into consideration the findings from our laboratory and data from the literature it seems that sympathetic activity does not modulate baroreceptor function. Moreover, since the results of the present study indicated that baroreceptor function was not altered in a situation where the plasma levels of insulin were certainly augmented, and the sympathetic nervous system was presumably stimulated, we may conclude that with the protocol used in the present study, a possible interaction on baroreceptor function between insulin and sympathetic activity did not become apparent. In conclusion, since there are no reports in the literature evaluating the afferent arm (baroreceptor) of the baroreflex during a brief period of hyperglycemia, the present study is the first to demonstrate that any alteration that may be caused by hyperglycemia on the whole baroreflex, i.e., afferences, central nervous system and efferences, does not involve a dysfunction of the arterial baroreceptors.
Acknowledgments
The authors thank Carlos Alberto Aguiar Silva and Mauro de Oliveira for excellent technical assistance.
Address for correspondence: H.C. Salgado, Departamento de Fisiologia, FMRP, USP, Av. Bandeirantes, 3900, 14049-900 Ribeirão Preto, SP, Brasil. Fax: +55-16-3633-0017. E-mail: hcsalgad@fmrp.usp.br
Research supported by CAPES, CNPq, and FAPESP. Received August 18, 2006. Accepted August 6, 2007.
- 1. Yasuda H, Terada M, Maeda K, Kogawa S, Sanada M, Haneda M, et al. Diabetic neuropathy and nerve regeneration. Prog Neurobiol 2003; 69: 229-285.
- 2. Low PA, Walsh JC, Huang CY, McLeod JG. The sympathetic nervous system in diabetic neuropathy. A clinical and pathological study. Brain 1975; 98: 341-356.
- 3. Hicks KK, Seifen E, Stimers JR, Kennedy RH. Effects of streptozotocin-induced diabetes on heart rate, blood pressure and cardiac autonomic nervous control. J Auton Nerv Syst 1998; 69: 21-30.
- 4. McDowell TS, Hajduczok G, Abboud FM, Chapleau MW. Baroreflex dysfunction in diabetes mellitus. II. Site of baroreflex impairment in diabetic rabbits. Am J Physiol 1994; 266: H244-H249.
- 5. Fazan R Jr, Dias da Silva V, Ballejo G, Salgado HC. Power spectra of arterial pressure and heart rate in streptozotocin-induced diabetes in rats. J Hypertens 1999; 17: 489-495.
- 6. Salgado HC, Fazan Junior R, Fazan VP, Da Silva V, Barreira AA. Arterial baroreceptors and experimental diabetes. Ann N Y Acad Sci 2001; 940: 20-27.
- 7. Maeda CY, Fernandes TG, Timm HB, Irigoyen MC. Autonomic dysfunction in short-term experimental diabetes. Hypertension 1995; 26: 1100-1104.
- 8. Lefrandt JD, Mulder MC, Bosma E, Smit AJ, Hoogenberg K. Inverse relationship between blood glucose and autonomic function in healthy subjects. Diabetes Care 2000; 23: 1862-1864.
- 9. Watkins LL, Surwit RS, Grossman P, Sherwood A. Is there a glycemic threshold for impaired autonomic control? Diabetes Care 2000; 23: 826-830.
- 10. Hoffman RP, Hausberg M, Sinkey CA, Anderson EA. Hyperglycemia without hyperinsulinemia produces both sympathetic neural activation and vasodilation in normal humans. J Diabetes Complications 1999; 13: 17-22.
- 11. Saini AK, Arun KH, Kaul CL, Sharma SS. Acute hyperglycemia attenuates nerve conduction velocity and nerve blood flow in male Sprague-Dawley rats: reversal by adenosine. Pharmacol Res 2004; 50: 593-599.
- 12. Fazan R Jr, Ballejo G, Salgado MC, Moraes MF, Salgado HC. Heart rate variability and baroreceptor function in chronic diabetic rats. Hypertension 1997; 30: 632-635.
- 13. Kent BB, Drane JW, Blumenstein B, Manning JW. A mathematical model to assess changes in the baroreceptor reflex. Cardiology 1972; 57: 295-310.
- 14. Pagani M, Lombardi F, Guzzetti S, Rimoldi O, Furlan R, Pizzinelli P, et al. Power spectral analysis of heart rate and arterial pressure variabilities as a marker of sympatho-vagal interaction in man and conscious dog. Circ Res 1986; 59: 178-193.
- 15. Pagani M, Montano N, Porta A, Malliani A, Abboud FM, Birkett C, et al. Relationship between spectral components of cardiovascular variabilities and direct measures of muscle sympathetic nerve activity in humans. Circulation 1997; 95: 1441-1448.
- 16. Laiprasert JD, Hamlin RL, Heesch CM. Afferent baroreceptor discharge in pregnant rats. Am J Physiol 2001; 281: H2456-H2462.
- 17. Julien C, Chapuis B, Cheng Y, Barres C. Dynamic interactions between arterial pressure and sympathetic nerve activity: role of arterial baroreceptors. Am J Physiol 2003; 285: R834-R841.
- 18. Cerutti C, Barres C, Paultre C. Baroreflex modulation of blood pressure and heart rate variabilities in rats: assessment by spectral analysis. Am J Physiol 1994; 266: H1993-H2000.
- 19. Baselli G, Cerutti S, Civardi S, Liberati D, Lombardi F, Malliani A, et al. Spectral and cross-spectral analysis of heart rate and arterial blood pressure variability signals. Comput Biomed Res 1986; 19: 520-534.
- 20. Nakahara T, Kawada T, Sugimachi M, Miyano H, Sato T, Shishido T, et al. Cholinesterase affects dynamic transduction properties from vagal stimulation to heart rate. Am J Physiol 1998; 275: R541-R547.
- 21. van Gurp PJ, Rongen GA, Lenders JW, Al Nabawy AK, Timmers HJ, Tack CJ. Sustained hyperglycaemia increases muscle blood flow but does not affect sympathetic activity in resting humans. Eur J Appl Physiol 2005; 93: 648-654.
- 22. Marfella R, Verrazzo G, Acampora R, La Marca C, Giunta R, Lucarelli C, et al. Glutathione reverses systemic hemodynamic changes induced by acute hyperglycemia in healthy subjects. Am J Physiol 1995; 268: E1167-E1173.
- 23. Giugliano D, Marfella R, Coppola L, Verrazzo G, Acampora R, Giunta R, et al. Vascular effects of acute hyperglycemia in humans are reversed by L-arginine. Evidence for reduced availability of nitric oxide during hyperglycemia. Circulation 1997; 95: 1783-1790.
- 24. Villafana S, Huang F, Hong E. Role of the sympathetic and renin angiotensin systems in the glucose-induced increase of blood pressure in rats. Eur J Pharmacol 2004; 506: 143-150.
- 25. Doong ML, Yang H. Intravenous glucose infusion decreases intracisternal thyrotropin-releasing hormone induced vagal stimulation of gastric acid secretion in anesthetized rats. Neurosci Lett 2003; 340: 49-52.
- 26. Takahashi T, Matsuda K, Kono T, Pappas TN. Inhibitory effects of hyperglycemia on neural activity of the vagus in rats. Intensive Care Med 2003; 29: 309-311.
- 27. Reynolds PJ, Yang M, Andresen MC. Aortic baroreceptor function in long term streptozotocin diabetic rats. Soc Neurosci Abstr 1994; 16: 221 (Abstract).
- 28. Porta A, Baselli G, Rimoldi O, Malliani A, Pagani M. Assessing baroreflex gain from spontaneous variability in conscious dogs: role of causality and respiration. Am J Physiol 2000; 279: H2558-H2567.
- 29. Porta A, Baselli G, Cerutti S. Implicit and explicit model-based signal processing for the analysis of short-term cardiovascular interactions. Proc IEEE 2006; 94: 805-818.
- 30. Eckberg DL. Sympathovagal balance: a critical appraisal. Circulation 1997; 96: 3224-3232.
- 31. Huggett RJ, Hogarth AJ, Mackintosh AF, Mary DA. Sympathetic nerve hyperactivity in non-diabetic offspring of patients with type 2 diabetes mellitus. Diabetologia 2006; 49: 2741-2744.
- 32. Salgado HC, Krieger EM. Time course of baroreceptor resetting in short-term hypotension in the rat. Am J Physiol 1978; 234: H552-H556.
- 33. Salgado HC, Krieger EM. Baroreceptor resetting during pressure recovery from hypotension. Hypertension 1981; 3: II-147-II-150.
Correspondence and Footnotes

Publication Dates
-
Publication in this collection
09 Nov 2007 -
Date of issue
Nov 2007
History
-
Accepted
06 Aug 2007 -
Received
18 Aug 2006