Abstracts
INTRODUCTION:
Occurrence of apoptosis and expression of proliferative markers are powerful tools to establish a prognosis in the follow-up of cancer.
OBJECTIVE:
To evaluate the growth fraction in papillomas and laryngeal squamous cell carcinomas with three degrees of differentiation through apoptosis and the expression of nucleolus organizer regions.
METHODS:
Retrospective study from which paraffin material was submitted to microtomy and hematoxylin-eosin and silver staining. Stained slides were used to quantify the apoptotic index and the number of nucleolus organizer regions by morphometry.
RESULTS:
Apoptosis was significantly more frequent in well differentiated carcinomas and in papillomas, and a higher growth fraction of expressed nucleolus organizer regions and cells that expressed a greater than average number of nucleolus organizer regions were more frequently noted in undifferentiated carcinomas.
CONCLUSIONS:
Thus, it was possible to verify that a high apoptotic index was associated with a lower chance of tumor differentiation in carcinomas, while a greater number of total nucleolus organizer regions, cells expressing nucleolus organizer regions above average and a higher growth fraction were associated with greater likelihood of abnormal cell proliferation and increased tumor differentiation.
Apoptosis; Larynx; Squamous cell carcinoma; Nucleolus organizer region; Papilloma
INTRODUÇÃO:
A ocorrência de apoptose e a expressão de marcadores proliferativos são ferramentas poderosas no estabelecimento do prognóstico do câncer.
OBJETIVO:
Avaliar a fração de crescimento de papilomas e carcinomas laríngeos de células escamosas, com três graus de diferenciação, através da apoptose e expressão de regiões organizadoras de nucléolo.
MÉTODO:
Estudo retrospectivo, cujo material em blocado em parafina foi submetido à microtomia e coloração em hematoxilina-eosina, e pela prata. As lâminas coradas foram utilizadas para quantificar o índice apoptótico e o número de regiões organizadoras de nucléolo (NORs) através da morfometria.
RESULTADOS:
A apoptose foi significativamente mais frequente em carcinomas bem diferenciados e em papilomas; enquanto que uma maior fração de crescimento, de NORs expressos e de células que expressaram maior número de NORs, foram mais frequentes nos carcinomas indiferenciados.
CONCLUSÕES:
Foi possível verificar que o índice apoptótico elevado indica menores chances de diferenciação tumoral nos carcinomas, enquanto que um maior número de NORs totais e células expressando NORs acima da média, e uma maior fração de crescimento, determinam maiores chances de proliferação celular anormal e maior diferenciação tumoral.
Apoptose; Laringe; Carcinoma de células escamosas; Região organizadora do nucléolo; Papiloma
Introduction
Worldwide, carcinomas of the head and neck occupy the fifth position in incidence, and affect mainly male smokers and drinkers, and the regions of the larynx and oral cavity.11. Ruback MJ, Galbiatti AL, Arantes LM, Marucci GH, Russo A, Ruiz- Cintra MT, et al. Clinical and epidemiological characteristics of patients in the head and neck surgery department of a university hospital, São Paulo. Med J. 2012;130:307-13. It is estimated that in Brazil more than 6000 new cases of carcinoma of the larynx occurred in 2012, and worldwide it is considered the second most common tumor in the respiratory tract and the most common among cancers of the head and neck, representing 2% of all malignancies.22. Ministério da Saúde Instituto Nacional do Câncer. Estimativa 2012: Incidência de Câncer no Brasil; 2011.
Several studies have shown that the number of nucleolar organizer regions stained by silver (AgNORs) in malignant neoplastic cells is often greater than in benign tumor cells or normal cells.33. Trerè D. AgNOR quantification in tumour pathology: what is actually evaluated? J Clin Pathol. 1993;46:189. and 44. Derenzini M, Trerè D. AgNOR proteins as a parameter of the rapidity of cell proliferation. Zentralbl Pathol. 1994;140:7-10.
Rüschoff et al.55. Ruschoff J, Fauser G, Knüchel R, Hofstädter F. AgNOR quan- tification with special reference to staining patterns. Zentralbl Pathol. 1994;140:23-30. concluded that the guided evaluation of the pattern of AgNORs facilitates the understanding of cell biology, since the number and area of points dissociated from AgNORs are mainly related to the rate of proliferation, and differ markedly among cell strains, in the various degrees of differentiation, regardless of the type and size of AgNOR aggregates in the cell. Thus, the relationship between AgNOR quantification at interphase and cell proliferation has been widely investigated in human tumors, by comparing AgNOR relative parameters at interphase with those cell proliferation markers commonly used in tumor pathology.44. Derenzini M, Trerè D. AgNOR proteins as a parameter of the rapidity of cell proliferation. Zentralbl Pathol. 1994;140:7-10.
Antonangelo et al.66. Antonangelo L, Bernardi F, Del C, Capelozzi VL, Takagaki TY, Younes RN, et al. Morphometric evaluation of argyrophilic nucle- olar organizer region is useful in predicting long-term survival in squamous cell carcinoma of the lung. Chest. 1997;111:110-4. examined the relationship between the expression of nucleolus organizer regions stained by silver (AgNORs) and survival time in patients with squamous cell carcinoma of the lung and concluded that the expression of AgNORs was lower in tumors in their early stages, and in tumors that were of a high histological grade; a higher number of AgNORs was associated with lower survival rates. These results encouraged the use of AgNORs' technique in the prognosis for lung cancer.
Rüschoff et al.,55. Ruschoff J, Fauser G, Knüchel R, Hofstädter F. AgNOR quan- tification with special reference to staining patterns. Zentralbl Pathol. 1994;140:23-30. working with normal and neoplastic cells of the urinary system, showed that the size of AgNOR aggregates is related to cell differentiation, and larger AgNOR aggregates were observed in those more differentiated tumors.
Lorand-Metze and Metze,77. Lorand-Metze I, Metze K. AgNOR clusters as a parameter of cell kinetics in chronic lymphocytic leukaemia. Clin Mol Pathol. 1996;49:M357-60. in an attempt to establish a correlation between the staining pattern of AgNORs in chronic lymphocytic leukemia (CLL) and tumor kinetics, concluded that the percentage of circulating lymphocytes with a cluster of AgNORs could be used as a parameter of the kinetics of this tumor, helping to differentiate patients with the disease in both stable and progressive stages, correctly classifying 94% of patients. For all practical purposes, a value of more than 13% of cells with clusters of AgNORs suggested progressive disease.
Cases of squamous cell carcinoma of the oral cavity had their prognosis predicted by quantifying the number of AgNORs, despite the occurrence of some overlapping among individual values. The mean number of AgNORs was higher for lesions with a poor prognosis and with a more aggressive character.88. Marigo H [thesis] Avaliação da razão entre o índice apoptótico e o índice mitótico em carcinomas de células escamosas e papi- lomas da cavidade oral; 1999.
Based on this, AgNORs have been widely used as markers of cell proliferation, showing good diagnostic and prognostic value in the field of tumor pathology.99. Biswal BM, Othman NH. Correlation of nuclear morphometry and AgNOR score with radiation response in squamous cell cancers of the head and neck: a preliminary study. Malays J Med Sci. 2010;17:19-26. , 1010. Moradzadeh Khiavi M, Vosoughhosseini S, Halimi M, Mahmoudi SM, Yarahmadi A. Nucleolar organizer regions in oral squa- mous cell carcinoma. J Dent Res Dent Clin Dent Prospects. 2012;6:17-20. and 1111. Chowdhry A, Deshmukh RS, Shukla D, Bablani D, Mishra S. Quantitative estimation of AgNORs in normal, dysplastic and malignant oral mucosa. Biomed Pap Med Fac Univ Palacky Olo- mouc Czech Repub. 2014;158:282-7.
Recent studies have described the occurrence of apoptosis in several types of human carcinomas, the most undifferentiated tumors being those that usually present the lowest apoptotic index.1212. Kavathia N, Jain A, Walston J, Beamer BA, Fedarko NS. Serum markers of apoptosis decrease with age and cancer stage. Aging. 2009;1:652-63. and 1313. Gorban NA, Kudaibergenova AG, Pankratov VA. Prognostic value of markers for proliferative activity and apoptotic regulation in laryngeal squamous cell carcinoma. Arkh Patol. 2013;75: 3-9. Thus, the apoptosis process seems to have a close relationship with a good prognosis for patients with epithelial tumors of the larynx.
In this context, the objectives of this study were: (a) to determine the apoptotic index; (b) to determine the number of AgNORs; (c) to assess the rate of growth of malignant and benign epithelial neoplasms of the larynx.
Methods
For this research, we conducted a study of a historical cross-sectional cohort. Samples were obtained from patients undergoing surgical treatment of laryngeal tumors during the period between the years 1989 and 2002. All material used was primarily harvested by doctors at the hospital with diagnostic and therapeutic purposes; at that time, there was no knowledge of the possibility of conducting this research. The study was conducted during the period between the years 2002-2004; at that time, we did not have norms establishing guidelines for the use of biological materials in research. Since 2005, with the Resolution 347/05, norms have been established to regulate the storage and use of human biological material in the context of research projects. Resolution 441/11 is an updated version of the Resolution 347/05, in which Article 15 maintained virtually the same provisions of the previous version. Therefore, as this study was conducted prior to this Resolution, the Ethics Committee decided these determinations were not necessary.
Initially, we undertook a survey of hospital clinical records, with the aim of identifying individuals with benign and malignant laryngeal neoplasms. One hundred and forty-two patients were found, among whom 40 were selected because the material embedded in paraffin was in better condition. We disregarded the remainder because of a high incidence of moderately differentiated carcinomas, which did not justify increasing the sample size we had already obtained and judged to be representative.
Gender, race and age were not considered as selection criteria. Thus, based solely on the histopathologic criteria, these patients were divided into groups, and their carcinomas were characterized (based on the degree of keratinization) as well differentiated (grade I - 4 cases), moderately differentiated (grade II - 16 cases) and undifferentiated (grade III - 14 cases). The patient sample included also six benign tumors that were papillomas. Well-differentiated lesions are those in which there occurs keratinization of the individual cells and the formation of multiple horny or keratin beads or pearls of varying size; there are groups of cells actively invading the connective tissue. Moderately differentiated lesions retain, in part, the characteristics of normal epithelium, but the cells already exhibit alterations in their forms. In poorly differentiated lesions the resemblance to squamous epithelium is less pronounced. The characteristic shape of the cells may be altered, as well as the typical intercellular arrangement. The cells show variation in size, staining strength and ability to perform the function of a squamous cell, which is the formation of keratin; these are different and pleomorphic cells, with loss of cohesion and showing numerous and atypical mitotic figures.
With a goal to analyze the histological grade and the apoptotic index, the samples embedded in paraffin were sectioned at 4 µm and stained with hematoxylin-eosin (HE). Other sections were submitted to silver impregnation for quantification of the cell proliferation index by counting NORs. The sections were dewaxed, rehydrated sequentially in absolute alcohol, 70% and 50% and washed in deionized water. The sections were stained with Ploton et al.1414. Ploton D, Menager M, Jeannesson P, Himber G, Pigeon F, Adnet JJ. Improvement in the staining and in the visualization of the argyrophilic proteins of the nucleolar organizer region at the optical level. Histochem J. 1986;18:5-14. technique, modified by Aubele et al.1515. Aubele M, Biesterfeld S, Derenzini M, Hufnagl P, Martin H, Ofner D, et al. Guidelines of AgNOR quantitation. Committee on AgNOR quantitation within the European Society of Pathology. Zentralbl Pathol. 1994;140:107-8. The silver impregnation was performed by two previously prepared solutions: solution A (aqueous solution of silver nitrate, 50%) and solution B (formic acid 1% containing 2 g of colorless gelatin). Solutions A and B were mixed at a ratio of 2:1 at the time of incubation of the sections. The incubation was performed in a wet/dark chamber at 37 °C for 20 min. Subsequently, the sections were washed with deionized water for 15 minutes and dehydrated in 70% alcohol and absolute alcohol, diaphanized in xylene and mounted with Entelan.1616. Luna LG. Manual of histologic staining methods of the Armed Forces Institute of Pathology, 3rd ed. New York: McGraw-Hill; 1968, 258 pp.
One slide from each group (papillomas, grade I, II and III carcinomas) was selected for determining the minimum number of fields to calculate the apoptotic index. In each slide, the highest number of possible fields was analyzed (using a 40× objective), to determine the apoptotic indexes, i.e., the number of apoptotic cells in the field divided by the total number of cells in the same field. The images were generated by a microscope connected to a camera and transferred to a digitizing board in the computer, where the morphometry was performed using a specific computer program (Kontron KS 300 version 2.0). To quantify apoptosis in these lesions, the minimum number of representative microscopic fields was obtained by an analysis of instability of the variation coefficient. 1717. Sampaio IBM. Estatística aplicada à experimentação animal, 2rd ed. Belo Horizonte: Fundação de Estudo e Pesquisa em Medicina Veterinária e Zootecnia; 2002, 265 pp. Among the evaluated fields, mean values for multiple samples of five random fields were obtained, until attaining the total number of fields per slide. These mean values were considered as experimental units and used in the statistical analysis. The standard deviations (SDs) and coefficients of variation for each sample size decreased, as the number of fields considered increased, until the occurrence of stabilization. This stabilization occurred when 10 fields per slide for papillomas and 30 fields per slide for carcinomas of all degrees were obtained.
Next, one slide of each group (papillomas, grade I, II and III carcinomas) was selected; the largest possible number of fields (100× objective) was analyzed and the number of total NORs (i.e., the number clumps per nucleus in the field divided by the total number of nuclei in that same field, using the same method and equipment mentioned above) was registered. The stabilization occurred when 10 fields per slide for papillomas and 15 slides for all grades of carcinomas were achieved.
As to the analysis of the apoptotic index (number of apoptotic cells/total number of cells × 100), the cells were observed by a single researcher, who counted only those cells exhibiting at least three of the following morphological characteristics peculiar to the process: (1) anoikis (presence of a pericellular clear halo); (2) cytoplasm condensation; (3) nuclear condensation (crescents); (4) nuclear fragmentation; (5) cell fragmentation (apoptotic bodies); (6) phagocytosis of apoptotic bodies ("cell cannibalism"). The areas of necrosis were excluded. The cells in apoptosis, and subsequently all the epithelial cells, were counted, in an area corresponding to 53,333.4 µm2 in a total of 10 fields for papillomas and 30 fields for all grades of carcinomas.
As to the analysis of the cell proliferation index (number of NORs/total number of nuclei × 100) in an area corresponding to 8.533,37 µm2, he counted the NORs present in each nucleus and, in parallel, the total number of epithelial nuclei, for a total of 10 fields for papillomas and 15 for all grades of carcinomas. The ratio between the number of cells expressing AgNORs above average and the apoptotic index was regarded as the growth fraction for each tumor type.
Means or medians were obtained for the studied morphometric parameters, in order to characterize the groups. At first, the normality of the data through the Kolmogorov-Smirnov test was verified. When the distribution was normal, we used the Student's t test (a parametric test) to compare the means of different injuries. When the distribution of the data did not show normality, we used the nonparametric Mann-Whitney test to compare the medians of different injuries. All data were analyzed with a significance level of 0.05 with the GraphPad Prism 3.0 software.
Results
Of the 40 selected samples, 34 were from patients with laryngeal carcinoma, 28 men (82.35%) and 6 women (17.65%) with a mean age of 59.5 years. The laryngeal papilloma cases consisted of 4 men (66.66%) and 2 women (33.34%) with a mean age of 36 years.
Histologically, we observed in the samples with Grade I squamous cell carcinoma (SCC) a variable number of keratin pearls scattered throughout the tissue (Fig. 1A), as well as isolated intracellular keratinization. We also noted numerous cells in apoptosis scattered through the tumor displaying condensation of the cytoplasm and anoikis (Fig. 1B). The cellular pleomorphism varied between mild and moderate, and the nuclear size showed little variability. Although an invasion of adjacent tissue by tumor cells was noted, the edges of the epithelial strands and nests were well defined (Fig. 2).
Grade I squamous cell carcinoma (A) Micrograph of grade I squamous carcinoma cells, with the presence of diffuse keratin pearls (CP) (HE, bar = 100 µm). (B) Micrograph of grade I squamous carcinoma cells with various apoptotic cells with condensation of cytoplasm (arrows) and anoikis (*) (HE, bar = 10 µm).
Grade I squamous cell carcinoma. Micrograph of grade I squamous cells, with invasion of connective tissue by tumor cells in the form of very delimited epithelial nests (EN) (HE, bar = 100 µm).
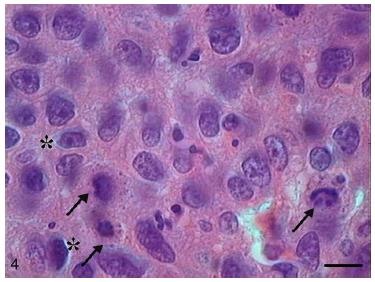
In Grade II SCC (SCC II), we observed fewer keratin pearls and a greater connective tissue invasion by tumor cells (Fig. 3). Mitoses were frequent, many of them atypical. Apoptotic cells with condensation of cytoplasm and anoikis (Fig. 4) were present throughout the tumor tissue, but to a lesser extent than in Grade I SCC (SCC I).
Grade II squamous carcinoma cells. Micrograph of grade II squamous carcinoma cells with connective tissue infiltration by tumor cells (HE, bar = 100 µm).
Grade II squamous carcinoma cells. Micrograph of grade II squamous carcinoma cells with presence of apoptotic cells with condensation of cytoplasm (arrows) and anoikis (*) (HE, bar = 10 µm).
In Grade III SCC (SCC III), pleomorphism and atypical cells were more dominant, the nuclei were seen to be increased in size, and there was nuclear hyperchromatacism and an increased nucleus/cytoplasm ratio (Fig. 5). The cells showed loss of cohesion, with invasion through the connective tissue and also through deeper areas, such as muscle and glandular tissues. Virtually no cell with intracellular keratinization was observed, and there were no keratin pearls. Few cells were in apoptosis, and the condensation of the cytoplasm and anoikis (Fig. 6) occurred without a definite pattern of location and also in isolated epithelial cells present in the stroma.
Grade III squamous carcinoma cells. Micrograph of grade III squamous carcinoma cells with apoptotic cells with nuclear hyperchromatacism (arrows) (HE, bar = 10 µm).
Grade III squamous carcinoma cells. Micrograph of grade III squamous carcinoma cells with presence of a few apoptotic cells with condensation of cytoplasm (arrows) and anoikis (*) (HE, bar = 10 µm).
The papilloma presented exophytic projections (Fig. 7). Each projection was covered by keratinized squamous epithelium with hyperkeratosis and with cells supported by a central part of connective tissue with blood vessels. Furthermore, we observed cells undergoing apoptosis with cytoplasmic condensation and anoikis in the papilloma's finger-like projections (Fig. 8). The apoptotic cells were distributed most frequently in the basal and spinous layers.
Papilloma. Micrograph of papilloma with exophytic projections extending below the surface of the mucosa (HE, bar = 100 µm).
Papilloma. Micrograph of papilloma with cell apoptosis with condensation of cytoplasm (arrows) and anoikis (*) (HE, bar = 10 µm).
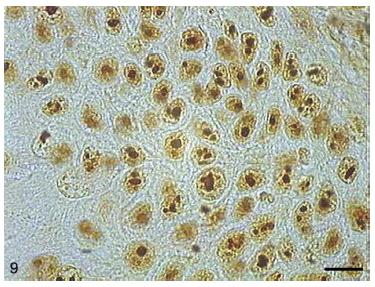
AgNORs were identified in many tumor types in the form of brownish or black clumps with varied shape, size and distribution. In SCC I, AgNORs presented as isolated clumps or formed clusters with rounded or irregular shapes, filling the entire nucleolus or scattered in the nucleus like satellites (Fig. 9). In SCC II, we noted the presence of AgNORs forming rounded clumps, filling the entire nucleolus, or as small satellites scattered throughout the nucleus (Fig. 10). On the other hand, in SCC III, the AgNORs formed dark, irregular adjoining clumps occupying virtually the entire nucleolus, or were isolated in the form of satellites in large nuclei (Fig. 11).
Grade I squamous carcinoma cells with AgNORs. Micrograph of grade I squamous carcinoma cells with AgNORs in the form of isolated lumps or forming large aggregates, with rounded or irregular shapes filling the entire nucleus or present in the nucleolus as satellites (AgNOR, bar = 10 µm).
Grade II squamous carcinoma cells with AgNORs. Micrograph of grade II squamous cell carcinoma containing AgNORs forming rounded clumps filling the entire nucleolus or as small satellites scattered by the nucleus (AgNOR, bar = 10 µm).
Grade III squamous carcinoma cells with AgNORs. Micrograph of grade III squamous carcinoma cells with AgNORs forming dark clumps together and occupying the entire nucleolus or isolated as small satellites in large nuclei (AgNOR, bar = 10 µm).
In the papilloma samples, AgNORs exhibited a distribution similar to that found in SCC I samples, forming small, isolated clumps or as clusters, present as satellites in the nucleus or occupying the entire nucleolus (Fig. 12).
Papilloma with AgNORs. Micrograph of papilloma with AgNORs forming small clumps present in the nucleus as satellites or occupying the entire nucleolus (AgNOR, bar = 10 µm).
With respect to the apoptotic index, SCC I showed a higher value when compared with SCC II (p = 0.0127) and III (p < 0.0001), but not compared papilloma (p = 0.1504). SCC II showed a higher apoptotic index when compared with SCC III (p < 0.0001), but with no significant difference in relation to papilloma (p = 0.8783). Finally, SCC III, when compared with papilloma, showed a lower apoptotic index (p = 0.0008) ( Table 1).
In papilloma samples, the total number of AgNORs per field was significantly higher compared to SCC I (p = 0.035) and significantly lower compared to SCC II (p = 0.0051) and SCC III (p < 0.0001). SCC I had a lower number of total AgNORs per field compared with SCC II (p < 0.0001) and III (p < 0.0001). Likewise, SCC II showed a lower mean of total AgNORs per field compared to SCC III (p < 0.0001) ( Table 2).
Table 3 shows comparisons of the number of cells expressing above average AgNORs per field among the different groups of tumors. There was no significant difference between papilloma and SCC I (p = 0.2021) groups. The number of cells expressing above average AgNORs in papilloma group was lower than in SCC II (p = 0.0053) and III (p < 0.0001). SCC I showed a lower number of cells expressing above average AgNORs versus SCC II (p < 0.0001) and III (p < 0.0001). Likewise, SCC II showed a lower number of cells expressing AgNORs above average versus SCC III (p < 0.0001).
Table 4 shows comparisons of growth fractions (number of cells expressing AgNORs above average per field/apoptotic indexes) among different tumor types. SCC III had a higher growth fraction when compared with other types of tumors (p < 0.0001). SCC II had a higher growth fraction versus SCC I (p < 0.0001), but with no significant difference versus papilloma (p = 0.1595). Papilloma group had a higher growth fraction when compared with SCC I (p = 0.0021).
Discussion
In malignant tumors, the cell mass can be reduced through apoptosis and necrosis; therefore, an interruption or disruption of the apoptotic pathway will facilitate the development of these tumors.1818. Pettigrew CA, Cotter TG. Deregulation of cell death (apopto- sis): implications for tumor development. Discov Med. 2009;8: 61-3. Apoptosis is the only form of cell death found in all stages of tumor growth, which could explain satisfactorily the large cell loss rate that occurs in neoplasia.1919. Searle J, Kerr JF, Bishop CJ. Necrosis and apoptosis: distinct modes of cell death with fundamentally different significance. Pathol Annu. 1982;17:229-59. In rapidly growing tumors, it was observed that apoptosis and mitosis are numerically increased. Cotter et al.2020. Cotter TG, Lennon SV, Glynn JG, Martin SJ. Cell death via apoptosis and its relationship to growth, development and dif- ferentiation of both tumour and normal cells. Anticancer Res. 1990;10:1153-9. observed that in untreated tumors, the proportion of mitotic cells to apoptotic cells is close to 1:1. In the present study, the apoptotic index for SCC I reached the highest value. This fact could explain the less aggressive behavior and a lower rate of growth of this tumor. Even taking into account that the papilloma group showed a numerically lower value than SCC I, there was no significant difference between these groups. Therefore, SCC I and papilloma groups showed similar apoptotic indexes. The literature reports that many benign tumors have a low apoptotic index.2121. Endo A, Koizumi H, Takahashi M, Tamura T, Tatsunami S, Watanabe Y, et al. A significant imbalance in mitosis versus apoptosis accelerates the growth rate of sessile serrated ade- noma/polyps. Virchows Arch. 2013;462:131-9. Such result was shown in our study, in the case of papilloma. On the other hand, in SCC III this index was also low. We can assume that this finding would be a factor contributing to an increased malignancy and a trend for metastasis and for greater chances of tumor growth observed in this type of tumor. Our results were similar to those from the study by Hamada et al.2222. Hamada M, Naomoto Y, Fujiwara T, Kamikawa Y, Tanaka N. Suppressed apoptotic induction in esophageal squamous cell carcinomas expressing extensive p53 protein. Jpn J Clin Oncol. 1996;26:398-404.; these authors found that in SCCs of the esophagus the degrees "well differentiated" and "moderately differentiated" showed high apoptotic indexes compared to tumors with "poorly differentiated" grade, suggesting that apoptosis contributes to a good prognosis. Moreover, other authors have observed in advanced-stage tumors located in the supraglottic region that the high apoptotic index was significantly associated with poor survival, and suggested that, in the future, the presence of a high degree of apoptosis could be used to identify patients with a poor prognosis for laryngeal cancer.2323. Teppo H, Soini Y, Melkko J, Koivunen P, Alho OP. Prognostic factors in laryngeal carcinoma: the role of apoptosis, p53, pro- liferation (Ki-67) and angiogenesis. APMIS. 2003;111:451-7. Likewise, Alcaide et al.2424. Alcaide J, Funez R, Rueda A, Perez- Ruiz E, Pereda T, Rodrigo I, et al. The role and prognostic value of apoptosis in colorectal carcinoma. BMC Clin Pathol. 2013;13:24. reported the occurrence of high numbers of apoptotic cells in colorectal carcinomas, when compared to adenomas and to normal epithelium; the apoptotic index was also higher in metastatic disease (stage 4), when compared to other stages. This assertion is not supported by the findings of this study, because here the high apoptotic index was related to a lower histological grade and a better prognosis.
With respect to the total number of AgNORs per field, the SCC I group showed the lowest value, followed by papilloma, Grade II and SCC III groups. We observed the same with respect to the number of cells expressing above average AgNORs per field. Some studies have shown that the number of AgNORs in malignant neoplastic cells is often greater than in benign neoplastic cells, or in normal cells.1010. Moradzadeh Khiavi M, Vosoughhosseini S, Halimi M, Mahmoudi SM, Yarahmadi A. Nucleolar organizer regions in oral squa- mous cell carcinoma. J Dent Res Dent Clin Dent Prospects. 2012;6:17-20. , 2525. Trerè D. AgNOR staining and quantification. Micron. 2000;31:127-31. , 2626. Guler N, Uckan S, Celik I, Oznurlu Y, Uckan D. Expression of Fas and Fas-ligand and analysis of argyrophilic nucleolar orga- nizer regions in squamous cell carcinoma: relationships with tumor stage and grade, and apoptosis. Int J Oral Maxillofac Surg. 2005;34:900-6. and 2727. Bukhari MH, Niazi S, Khaleel ME, Sharif MA, Ghani R, Mehmood MT, et al. Elevated frequency of p53 genetic mutations and AgNOR values in squamous cell carcinoma. J Cutan Pathol. 2009;36:220-8. In many tumors, the quantification and distribution of AgNORs in the nucleus and nucleolus have shown significant prognostic value.2828. Hanemann JA, Miyazawa M, Souza MS. Histologic grading and nucleolar organizer regions in oral squamous cell carcinomas. J Appl Oral Sci. 2011;19:280-5. Some authors found that tumors with high malignancy have a higher number of AgNORs compared to low-grade tumors, which agrees with the findings of this study.2828. Hanemann JA, Miyazawa M, Souza MS. Histologic grading and nucleolar organizer regions in oral squamous cell carcinomas. J Appl Oral Sci. 2011;19:280-5. , 2929. Alaeddini M, Khalili M, Tirgary F, Etemad-Moghadam S. Argy- rophilic proteins of nucleolar organizer regions (AgNORs) in salivary gland mucoepidermoid carcinoma and its relation to histological grade. Oral Surg Oral Med Oral Pathol Oral Radiol Endod. 2008;105:758-62. and 3030. Masuda EK, Kommers GD, Martins TB, Barros CS, Piazer JV. Mor- phological factors as indicators of malignancy of squamous cell carcinomas in cattle exposed naturally to bracken fern (Pterid- ium aquilinum). J Comp Pathol. 2011;144:48-54.
Previous studies have reported that the average of AgNORs in SCCs of the oral cavity and larynx is higher in tumors with a poor prognosis and with more aggressive characteristics, i.e., poorly differentiated lesions. 2828. Hanemann JA, Miyazawa M, Souza MS. Histologic grading and nucleolar organizer regions in oral squamous cell carcinomas. J Appl Oral Sci. 2011;19:280-5. and 3131. Ghosh S, Bhattacharya S, Konar K, Ghosh TK, Majhi P. Prognostic value of AgNOR in benign and malignant lesions of larynx in a rural medical college hospital, Burdwan, West Bengal. J Indian Med Assoc. 2009;107:722-4. Hanemann, Miyazawa and Souza 2828. Hanemann JA, Miyazawa M, Souza MS. Histologic grading and nucleolar organizer regions in oral squamous cell carcinomas. J Appl Oral Sci. 2011;19:280-5. stated that the method of counting AgNORs is a useful diagnostic tool for identifying different types of oral squamous malignancies and is also a prognostic marker of these carcinomas. Furthermore, this counting helps to differentiate among pre-cancerous, benign and malignant lesions. According to Underwood and Giri, 3232. Underwood JC, Giri DD. Nucleolar organizer regions as diagnos- tic discriminants for malignancy. J Pathol. 1988;155:95-6. AgNORs scatter throughout the nucleus in varying lengths, making their measurement easy. Thus, the quantification of AgNORs is dependent on the degree of dispersion or breakdown of a large relative number of NORs in the nucleus. Therefore, the so-called histologic counting of NORs - both in benign and malignant lesions - does not result in an absolute number, but rather, in a numerical index of their dispersion. This does not impair or necessarily invalidate the usefulness of this counting technique as a discriminant factor for malignancy or transcriptional activity.
As regards to growth fraction, SCC I showed the lowest value, followed by papilloma, SCC II and SCC III. Considering that SCC I presented the highest apoptotic index and the lowest number of AgNORs above average, its growth fraction was the lowest among malignant tumors. The papilloma group showed a slightly higher growth fraction versus SCC I, and was slightly smaller than SCC II. However, these differences were not statistically significant. On the other hand, SCC III showed an extremely high growth fraction, since its apoptotic index was low and the number of above average AgNORs was high. Liu et al. 3333. Liu Z, Gersbach E, Zhang X, Xu X, Dong R, Lee P, et al. MiR-106a represses the RB tumor suppressor p130 to regulate cellular proliferation and differentiation in high-grade serous ovarian carcinoma. Mol Cancer Res. 2013;11:1314-25. have supported our findings, and stated that the degree of differentiation in human cancers generally reflects the degree of malignancy, where the most undifferentiated lesion is the most aggressive, based on an analysis of ovarian carcinomas. These authors suggest that microRNAs are deregulated and therefore overexpressed in these tumors, causing an increase in the rate of cell proliferation.
Karki et al.3434. Karki S, Jha A, Sayami G. The role of argyrophilic nucleolar orga- nizer región (AgNOR) study in cytological evaluation of fluids, especially for detection of malignancy. Kathmandu Univ Med J (KUMJ). 2012;10:44-7. found irregularly shaped AgNORs in malignant cells of pleural and peritoneal effusions, and large and individual AgNORs in benign cells of the same effusions. Arora et al.3535. Arora B, Jeevan D, Punia RS, Kumar S, Arora DR. AgNORs in squa- mous cell carcinoma of head and neck. JIMA. 2002;100:315-6. showed that apparently the number of AgNORs per nucleus in patients with SCC of the larynx increases as the degree of tumor dedifferentiation increases. Furthermore, with a higher tumor grade, NORs decrease in size and become more irregular. In our study, the presence of larger, rounded, regular and less scattered aggregates was noted in the nuclei of SCC I, and smaller and irregular aggregates were observed in SCC III. Therefore, our findings are similar to those described for cancers of the larynx3535. Arora B, Jeevan D, Punia RS, Kumar S, Arora DR. AgNORs in squa- mous cell carcinoma of head and neck. JIMA. 2002;100:315-6. and for cells of pleural and peritoneal effusions.3434. Karki S, Jha A, Sayami G. The role of argyrophilic nucleolar orga- nizer región (AgNOR) study in cytological evaluation of fluids, especially for detection of malignancy. Kathmandu Univ Med J (KUMJ). 2012;10:44-7.
Conclusions
The high apoptotic index indicates lower chances of tumor differentiation in cases of squamous cell carcinomas of the larynx.
The greater the number of total AgNORs and above average AgNOR-expressing cells, the higher the chances of an abnormal cell proliferation and the less differentiated the tumor tends to be.
The higher the growth fraction, defined as the ratio between the number of AgNOR-expressing cells above average and the apoptotic index, the higher the chances of the tumor being of a less differentiated type.
References
-
1Ruback MJ, Galbiatti AL, Arantes LM, Marucci GH, Russo A, Ruiz- Cintra MT, et al. Clinical and epidemiological characteristics of patients in the head and neck surgery department of a university hospital, São Paulo. Med J. 2012;130:307-13.
-
2Ministério da Saúde Instituto Nacional do Câncer. Estimativa 2012: Incidência de Câncer no Brasil; 2011.
-
3Trerè D. AgNOR quantification in tumour pathology: what is actually evaluated? J Clin Pathol. 1993;46:189.
-
4Derenzini M, Trerè D. AgNOR proteins as a parameter of the rapidity of cell proliferation. Zentralbl Pathol. 1994;140:7-10.
-
5Ruschoff J, Fauser G, Knüchel R, Hofstädter F. AgNOR quan- tification with special reference to staining patterns. Zentralbl Pathol. 1994;140:23-30.
-
6Antonangelo L, Bernardi F, Del C, Capelozzi VL, Takagaki TY, Younes RN, et al. Morphometric evaluation of argyrophilic nucle- olar organizer region is useful in predicting long-term survival in squamous cell carcinoma of the lung. Chest. 1997;111:110-4.
-
7Lorand-Metze I, Metze K. AgNOR clusters as a parameter of cell kinetics in chronic lymphocytic leukaemia. Clin Mol Pathol. 1996;49:M357-60.
-
8Marigo H [thesis] Avaliação da razão entre o índice apoptótico e o índice mitótico em carcinomas de células escamosas e papi- lomas da cavidade oral; 1999.
-
9Biswal BM, Othman NH. Correlation of nuclear morphometry and AgNOR score with radiation response in squamous cell cancers of the head and neck: a preliminary study. Malays J Med Sci. 2010;17:19-26.
-
10Moradzadeh Khiavi M, Vosoughhosseini S, Halimi M, Mahmoudi SM, Yarahmadi A. Nucleolar organizer regions in oral squa- mous cell carcinoma. J Dent Res Dent Clin Dent Prospects. 2012;6:17-20.
-
11Chowdhry A, Deshmukh RS, Shukla D, Bablani D, Mishra S. Quantitative estimation of AgNORs in normal, dysplastic and malignant oral mucosa. Biomed Pap Med Fac Univ Palacky Olo- mouc Czech Repub. 2014;158:282-7.
-
12Kavathia N, Jain A, Walston J, Beamer BA, Fedarko NS. Serum markers of apoptosis decrease with age and cancer stage. Aging. 2009;1:652-63.
-
13Gorban NA, Kudaibergenova AG, Pankratov VA. Prognostic value of markers for proliferative activity and apoptotic regulation in laryngeal squamous cell carcinoma. Arkh Patol. 2013;75: 3-9.
-
14Ploton D, Menager M, Jeannesson P, Himber G, Pigeon F, Adnet JJ. Improvement in the staining and in the visualization of the argyrophilic proteins of the nucleolar organizer region at the optical level. Histochem J. 1986;18:5-14.
-
15Aubele M, Biesterfeld S, Derenzini M, Hufnagl P, Martin H, Ofner D, et al. Guidelines of AgNOR quantitation. Committee on AgNOR quantitation within the European Society of Pathology. Zentralbl Pathol. 1994;140:107-8.
-
16Luna LG. Manual of histologic staining methods of the Armed Forces Institute of Pathology, 3rd ed. New York: McGraw-Hill; 1968, 258 pp.
-
17Sampaio IBM. Estatística aplicada à experimentação animal, 2rd ed. Belo Horizonte: Fundação de Estudo e Pesquisa em Medicina Veterinária e Zootecnia; 2002, 265 pp.
-
18Pettigrew CA, Cotter TG. Deregulation of cell death (apopto- sis): implications for tumor development. Discov Med. 2009;8: 61-3.
-
19Searle J, Kerr JF, Bishop CJ. Necrosis and apoptosis: distinct modes of cell death with fundamentally different significance. Pathol Annu. 1982;17:229-59.
-
20Cotter TG, Lennon SV, Glynn JG, Martin SJ. Cell death via apoptosis and its relationship to growth, development and dif- ferentiation of both tumour and normal cells. Anticancer Res. 1990;10:1153-9.
-
21Endo A, Koizumi H, Takahashi M, Tamura T, Tatsunami S, Watanabe Y, et al. A significant imbalance in mitosis versus apoptosis accelerates the growth rate of sessile serrated ade- noma/polyps. Virchows Arch. 2013;462:131-9.
-
22Hamada M, Naomoto Y, Fujiwara T, Kamikawa Y, Tanaka N. Suppressed apoptotic induction in esophageal squamous cell carcinomas expressing extensive p53 protein. Jpn J Clin Oncol. 1996;26:398-404.
-
23Teppo H, Soini Y, Melkko J, Koivunen P, Alho OP. Prognostic factors in laryngeal carcinoma: the role of apoptosis, p53, pro- liferation (Ki-67) and angiogenesis. APMIS. 2003;111:451-7.
-
24Alcaide J, Funez R, Rueda A, Perez- Ruiz E, Pereda T, Rodrigo I, et al. The role and prognostic value of apoptosis in colorectal carcinoma. BMC Clin Pathol. 2013;13:24.
-
25Trerè D. AgNOR staining and quantification. Micron. 2000;31:127-31.
-
26Guler N, Uckan S, Celik I, Oznurlu Y, Uckan D. Expression of Fas and Fas-ligand and analysis of argyrophilic nucleolar orga- nizer regions in squamous cell carcinoma: relationships with tumor stage and grade, and apoptosis. Int J Oral Maxillofac Surg. 2005;34:900-6.
-
27Bukhari MH, Niazi S, Khaleel ME, Sharif MA, Ghani R, Mehmood MT, et al. Elevated frequency of p53 genetic mutations and AgNOR values in squamous cell carcinoma. J Cutan Pathol. 2009;36:220-8.
-
28Hanemann JA, Miyazawa M, Souza MS. Histologic grading and nucleolar organizer regions in oral squamous cell carcinomas. J Appl Oral Sci. 2011;19:280-5.
-
29Alaeddini M, Khalili M, Tirgary F, Etemad-Moghadam S. Argy- rophilic proteins of nucleolar organizer regions (AgNORs) in salivary gland mucoepidermoid carcinoma and its relation to histological grade. Oral Surg Oral Med Oral Pathol Oral Radiol Endod. 2008;105:758-62.
-
30Masuda EK, Kommers GD, Martins TB, Barros CS, Piazer JV. Mor- phological factors as indicators of malignancy of squamous cell carcinomas in cattle exposed naturally to bracken fern (Pterid- ium aquilinum). J Comp Pathol. 2011;144:48-54.
-
31Ghosh S, Bhattacharya S, Konar K, Ghosh TK, Majhi P. Prognostic value of AgNOR in benign and malignant lesions of larynx in a rural medical college hospital, Burdwan, West Bengal. J Indian Med Assoc. 2009;107:722-4.
-
32Underwood JC, Giri DD. Nucleolar organizer regions as diagnos- tic discriminants for malignancy. J Pathol. 1988;155:95-6.
-
33Liu Z, Gersbach E, Zhang X, Xu X, Dong R, Lee P, et al. MiR-106a represses the RB tumor suppressor p130 to regulate cellular proliferation and differentiation in high-grade serous ovarian carcinoma. Mol Cancer Res. 2013;11:1314-25.
-
34Karki S, Jha A, Sayami G. The role of argyrophilic nucleolar orga- nizer región (AgNOR) study in cytological evaluation of fluids, especially for detection of malignancy. Kathmandu Univ Med J (KUMJ). 2012;10:44-7.
-
35Arora B, Jeevan D, Punia RS, Kumar S, Arora DR. AgNORs in squa- mous cell carcinoma of head and neck. JIMA. 2002;100:315-6.
-
Funding This study was supported by FAPEMIG which offered financial support for the realization of this project.
-
☆
Please cite this article as: Ribeiro CV, Vasconcelos AC, Andrade Filho JS. Apoptosis and expression of argyrophilic nucleolus organizer regions in epithelial neoplasms of the larynx. Braz J Otorhinolaryngol. 2015;81:158-66.
-
☆☆
Institution: This project was developed at the Instituto de Ciências Biológicas (ICB), Universidade Federal de Minas Gerais (UFMG); and Escola de Medicina, Universidade Federal de Minas Gerais (UFMG), Belo Horizonte, MG, Brazil.
-
☆☆☆
Case report: a retrospective study of 40 cases of epithelial neoplasms of the larynx, with 3 degrees of tumor differentiation.
Publication Dates
-
Publication in this collection
Apr 2015
History
-
Received
14 Nov 2013 -
Accepted
22 July 2014