ABSTRACT
The objective of this research was to evaluate the changes of phenolics and antioxidant capacity of a ready-to-drinkgreen tea beverage during short storage at commercial conditions. The total phenols (Folin-Ciocalteu), total catechins (4-dimethylaminocinnamaldehyde) and total non-catechins (difference between total phenols and total catechins) were evaluated as part of phenolic analysis, while antioxidant capacity was evaluated by using DPPH (2,2-diphenyl-1-picrylhydrazyl) radical. At the beginning of the experiment, the levels of total phenols, total catechins and total non-catechins were 1220.69 ± 29.73, 636.94 ± 14.60and 584.75 ± 15.12 milligrams of catechin per liter of sample, respectively; these values decreased to 674.38 ± 26.52, 424.54 ± 11.29and 251.83 ± 37.81 milligrams of catechin per liter of sample, respectively, after nine days of storage. The losses of phenolics at the final day of the experiment were 44.67% in total phenols, 33.40% in total catechins and 56.93% in total non-catechins. The initial values of the DPPH antioxidant capacity were 3116.43 ± 90.91 micromoles oftrolox equivalents per liter of sample and 66.09 ± 1.82 percentage of radical scavenging. These values decreased to 1288.86 ± 70.71 micromoles of trolox equivalents per liter of sample and 31.90 ± 2.44percentage of radical scavenging after nine days of storage, which means a loss of 58.62% and 53.24%, respectively. The data obtained in this work give information to the ready-to-drink green tea consumers, manufacturers and food researchers about loss of compounds with beneficial health effects during short storage of greentea at commercial conditions.
Key words
Camellia sinensis; total phenolics; total catechins; total non-catechins; DPPH antioxidant capacity; short storage
Green tea, a product made up from Camellia sinensis, is the most consumed beverage in the world after water. The most important bioactive components of green tea are polyphenols, with the flavonoid compounds as the major group (Cabrera et al. 2006Cabrera, C., Artacho, R., and Giménez, R. (2006). Beneficial effects of green tea - a review. Journal of the American College of Nutrition, 25, 79-99. https://doi.org/10.1080/07315724.2006.10719518
https://doi.org/10.1080/07315724.2006.10...
). Catechins are the main flavonoids, representing 80 to 90% of this phenolic group and approximately 40% of the water-soluble solids in green tea (Reygaert 2017Reygaert, W. C. (2017). An update on the health benefits of green tea. Beverages, 3, 6. https://doi.org/10.3390/beverages3010006
https://doi.org/10.3390/beverages3010006...
). The characteristic catechins of green tea are (-)-epigallocatechin-3-gallate, (-)-epigallocatechin, (-)-epicatechin-3-gallate and (-)-epicatechin. The most widely recognized property of green tea polyphenols is antioxidant activity, arising from their ability toscavenge reactive oxygen species (Yang and Landau 2000Yang, C. S., and Landau, J. M. (2000). Effects of tea consumption on nutrition and health. Journal of Nutrition, 130, 2409-2412. https://doi.org/10.1093/jn/130.10.2409
https://doi.org/10.1093/jn/130.10.2409...
).
Catechins epimerization is carried out in bottled green tea during the sterilization step of its manufacture process, producing the catechin epimers (-)-gallocatechin-3-gallate, (-)-gallocatechin, (-)-catechin-3-gallate and (-)-epicatechin, but heat-epimerized catechins show similar or greater antioxidant capacity than native green tea catechins (Sajilata et al. 2008Sajilata, M. G., Bajaj, P. R., and Singhal, R. S. (2008). Tea polyphenols as nutraceuticals. Comprehensive Reviews in Food Science and Food Safety, 7, 229-254. https://doi.org/10.1111/j.1541-4337.2008.00043.x
https://doi.org/10.1111/j.1541-4337.2008...
). The consumption of green tea is equally divided between the hot and the ready-to-drink products in most of the Western countries, although this balance shifts drastically to an increased in consumption of ready-to-drink green tea during the spring and summer (Del Rio et al. 2010Del Rio, D., Calani, L., Scazzina, F., Jechiu, L., Cordero, C., and Brighenti F. (2010). Bioavailability of catechins from ready-to-drink tea. Nutrition, 26, 528-533. https://doi.org/10.1016/j.nut.2009.06.013
https://doi.org/10.1016/j.nut.2009.06.01...
).
In Mexico, the ready-to-drink green tea products have grown in the last years and most of the large industries commercialize their products at room temperature after sterilization process. This study analyzed the changes of total phenols, total catechins, total non-catechins and DPPH antioxidant capacity of a ready-to-drink green tea beverage during nine days of storage at room temperature.
Bagged green tea product was purchased in a local supermarket. Green tea infusions were prepared by adding 200 mL of distilled water at 85 °C to a 1.4 g bag of green tea and allowed to brew for 15 min in stirring at 200 rpm. After that, samples were placed in 200 mL thread glass bottles, sealed with aluminum bottle caps and heat processed at 121 °C for 1 min. They were then quickly cooled 25 °C with iced bath and storage at room temperature (22 to 25 °C) during nine days with periods of 12 h of lights-on and 12 h of lights-off using 60 W white fluorescents ceiling lamps.
Ten mL of sample were diluted with 40 mL of distilled water. The pH was read in a Corning 440 pH Meter (Woburn, USA). After that, samples were titrated with 0.1 N NaOH to a pH 8.2 (citric acid as predominant) according to Association of Official Analytical Chemist methods (AOAC 1998[AOAC] Association of Official Analytical Chemist International (1998). Official Methods of Analysis. 16th Ed., 4th Rev. Maryland: AOAC International.). For color determination, a 1.5 mL spectrophotometric cuvette was filled with tea sample and color was measured using a CR-20 Konica Minolta Color Reader (Osaka, Japan). Chromatic parameters were obtained using CIELAB (L*, a*, b*) color system. L* defines Lightness (0 = black,100 = white), a* indicates red (positive a*) or green value (negative a*) and b* indicates yellow (positive b*) or blue value (negative b*) (CIE 2004[CIE] Commission Internationale De L’ecleirage (2004). 15 Technical Report: Colorimetry. 3rd ed. Vienna: Commission Internationale De L’ecleirage.). Color view was obtained by online software ColorHexa color converter using L*, a* and b* values (ColorHexa 2017ColorHexa (2017) Color Encyclopedia: Information and Conversion [Computer Software]. ColorHexa; [accessed 2017 July 31]. http://www.colorhexa.com
http://www.colorhexa.com...
).
Phenolics and antioxidant capacity assays were performed in a Barnstead International Turner SP-830 Plus spectrophotometer (Dubuque, United States). Previously to the evaluation samples were diluted 1:10 (v:v) with water. The total phenols content was evaluated by Folin-Ciocalteu reagent according to Chum and Kim (2004)Chum, O. K., and Kim, D. O. (2004). Consideration on equivalent chemicals in total phenolic assay of chlorogenic acid-rich plums. Food Research International, 37, 337-342. https://doi.org/10.1016/j.foodres.2004.02.001
https://doi.org/10.1016/j.foodres.2004.0...
, while the total catechins were quantified by using 4-dimethylaminocinnamaldehyde reagent according to Heil et al. (2002)Heil, M., Baumann, B., Andary, C., Linsenmair, K. E., and McKey, D. (2002). Extraction and quantification of “condensed tannins” as a measure of plant anti-herbivore defence? Revisiting an old problem. Naturwissenschaften, 89, 519-524. https://doi.org/10.1007/s00114-002-0366-3
https://doi.org/10.1007/s00114-002-0366-...
. Results of total phenols and total catechins were expressed as milligrams of catechin per liter of sample (mgCatE∙L–1) based on calibrations curves established with catechin (0 to 200 mg∙L–1).Total non-catechins were obtained by subtraction between total phenols and total catechins. DPPH (2,2-diphenyl-1-picrylhydrazyl) antioxidant capacity was performed based on the reduction of the DPPH absorbance in the presence of sample, according to González-Aguilar et al. (2007)González-Aguilar, G. A., Villegas-Ochoa, M. A., Martínez-Téllez, M. A., Gardea, A. A., and Ayala-Zavala, J. F. (2007). Improving antioxidant capacity of fresh-cut mangoes treated with UV-C. Journal of Food Science, 72, S197-S202. https://doi.org/10.1111/j.1750-3841.2007.00295.x
https://doi.org/10.1111/j.1750-3841.2007...
. Results were expressed as micromoles of trolox equivalents per liter of sample (µmolTE∙L–1) based on a calibration curve established with trolox (0 to 500 µmolTE∙L–1). The percentage of radical scavenging (%RS) was also obtained using the next formula: %RS = (AC-AS)/AC) × 100,where AC = absorbance of control (initial absorbance ofAC = 0.700) and AS = absorbance of sample.
The pH, titratable acidity, color parameters, phenolics and antioxidant capacity were evaluated in intervals ofthree days. All the results were expressed as mean valuesof three samples ± standard deviation. Statistical significance between samples was evaluated by analysis of variance followed by Tukey’s test using Minitab 14.0 statistical software (Minitab 2004Minitab (2004). Minitab 14.0 statistical software [Computer software]. State College: Minitab Inc.). A level of probability of p < 0.05 (5%) was set as statistical significance.
There were statistical differences (p < 0.05) in physicochemical parameters during the experiment (Table 1).The pH of green tea increased from 5.36 at day zero to 6.56 at day nine, while the titratable acidity decreased from 0.069 to 0.049% in the same storage period. On the chromatic parameters, L* and b* decreased from 54.25 to 48.95 and from 27.90 to 25.05, respectively, while a* increased from 2.25 to 6.05, respectively, from day zero to day nine of storage.
pH, titratable acidity and color changes during short storage of ready -to-drink green tea beverage at room temperature (22 to 25 °C).
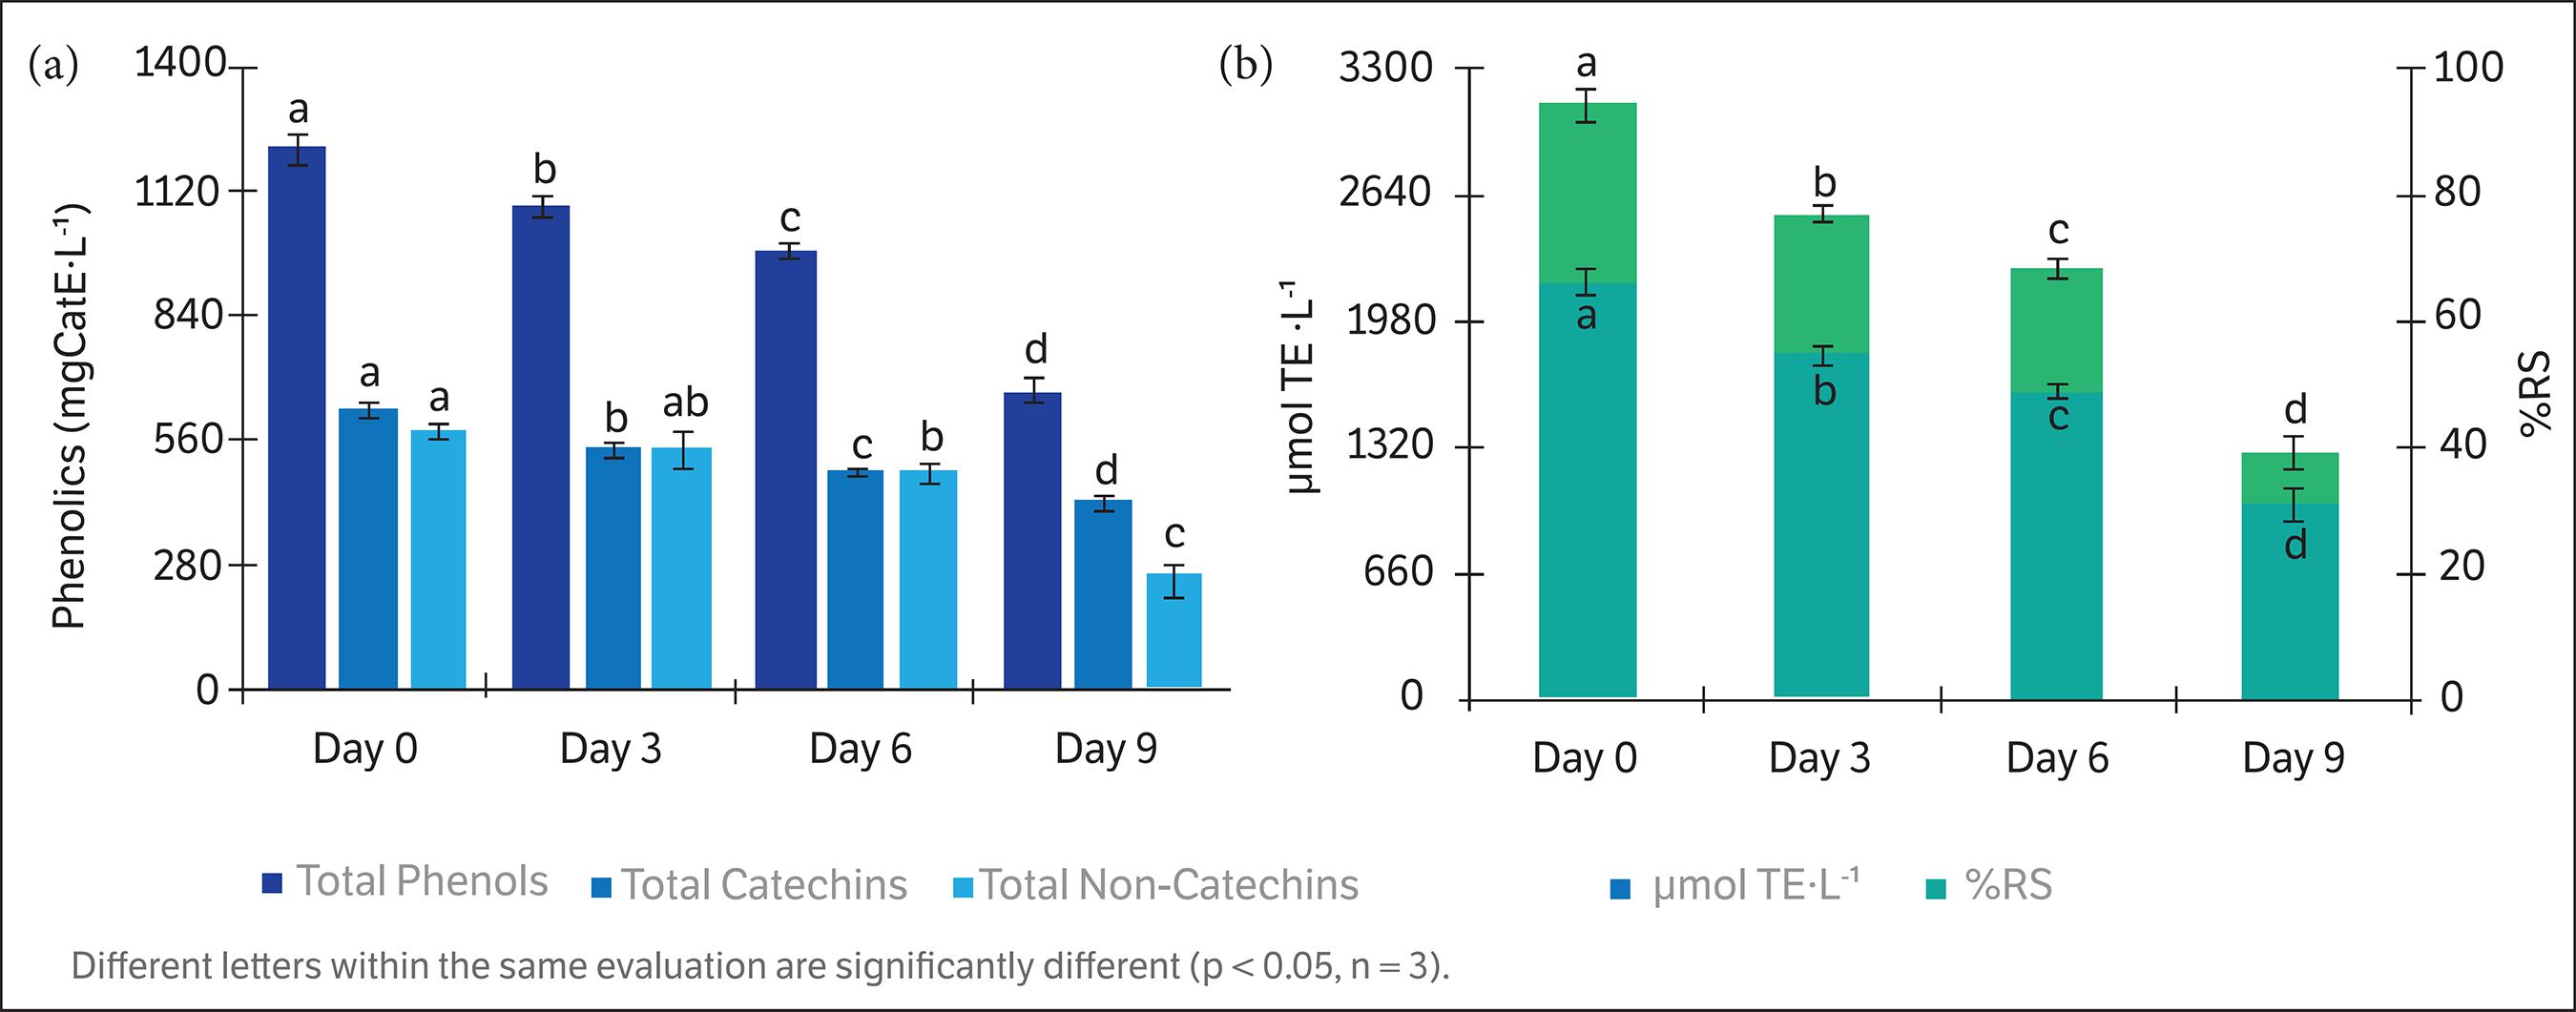
There were significant differences (p < 0.05) in phenolics and antioxidant capacity evaluations during short storage experiment. At the beginning of the experiment, the levels of total phenols, total catechins and total non-catechins were 1220.69 ± 29.73, 636.94 ± 14.60 and584.75 ± 15.12 mgCatE∙L–1, respectively. These values decreased to 674.38 ± 26.52, 424.54 ± 11.29 and251.83 ± 37.81 mgCatE∙L–1 in total phenols, total catechins total non-catechins, respectively, after the nine days of storage. The loss of phenolics in terms of percentage at the final day of the experiment was 44.67% in total phenols, 33.40% in total catechins and 56.93% in total non-catechins (Fig. 1a). The total catechins values in terms of percentage in relation to the total phenols during storage were 52% at initial day, 50% at three and six days and 63% at the final day of the experiment. On the other hand, the initial values of the antioxidant capacity were 3116.43 ± 90.91 µmolTE∙L–1and 66.09 ± 1.82 %RS. These values decreased to1288.86 ± 70.71 µmolTE∙L–1 and 31.90 ± 2.44 %RS after nine days of storage, which meant a loss of 58.62% and53.24% in terms of µmolTE∙L–1 and %RS, respectively (Fig. 1b).
(a) Total phenols, total catechins and total non-catechins changes during short storage of ready-to-drink green tea beverage at room temperature (22 to 25 °C). (b) DPPH antioxidant capacity and the percentage of radical scavenging (%RS) changes during short storage of ready-to-drink green tea beverage at room temperature (22 to 25 °C).
Anaerobic degradation is the main factor in the loss of organic acids during storage of beverages and it is influenced by light, storage temperature and storage time (Randhawa et al. 2014Randhawa, M. A., Rashid, A., Saeed, M., Javed, M. S., Khan, A. A., and Sajid, M. W. (2014). Characterization of organic acids in juices of some Pakistani citrus species and their retention during refrigerated storage. The Journal of Animal and Plant Sciences, 24, 211-215.). Succinic, ascorbic, citric and malic are the major organic acids in green tea (Ding et al. 1997Ding, M.-Y., Chen, P.-R., and Luo, G.-A. (1997). Simultaneous determination of organic acids and inorganic anions in tea by ion chromatography. Journal of Chromatography A, 764, 341-345. https://doi.org/10.1016/S0021-9673(96)00910-7
https://doi.org/10.1016/S0021-9673(96)00...
), but also green tea contains considerable amounts phenolic acids (mainly gallic acid and its quinic ester theogallin) (Kosińska and Andlauer 2014Kosińska, A., and Andlauer, W. (2014). Chapter 12 – Antioxidant capacity of tea: effect of processing and storage. In V. Preedy (Ed.), Processing and Impact on Antioxidants in Beverages (p. 109-120). Amsterdam: Elsevier. https://doi.org/10.1016/B978-0-12-404738-9.00012-X
https://doi.org/10.1016/B978-0-12-404738...
). On the other hand, green tea catechins stability are pH dependent because of they are relatively stableat pH ≤ 4 and they are unstable at pH ≥ 5 (Chen et al. 2001Chen, Z.-Y., Zhu, Q. Y., Tsang, D., and Huang Y. (2001). Degradation of green tea catechins in tea drinks. Journal of Agricultural and Food Chemistry, 49, 477-482. https://doi.org/10.1021/jf000877h
https://doi.org/10.1021/jf000877h...
).
Anaerobic degradation of the organic acids had an effect on the increasing levels pH and this has an effect on thedecreasing levels of titratable acidity during storage.The increasing levels of pH during storage of green tea beverage has an effect on the degradation of green tea catechins in aqueous solutions due to they are unstable at pH ≥ 5 and therefore also the antioxidant capacity of green tea beverage is negative affected. In addition, the degradation of catechins leads to a non-enzymatic browning in the green tea beverage during storage and this has an effect on its visual aspect as is shown in Table 1.
Few studies have been carried out about the effect of storage on the phenolics and antioxidant capacity of green tea infusions. In this regard, Wang et al. (2000)Wang, L. F., Kim, D. M., and Lee, C. Y. (2000). Effects of heat processing and storage on flavanols and sensory qualities of green tea beverage. Journal of Agricultural and Food Chemistry, 48, 4227-4232. https://doi.org/10.1021/jf0003597
https://doi.org/10.1021/jf0003597...
conducted an experiment in which green tea beverages were prepared by steamed and roasted treatments of green tea leaves. The reduction values reported by these authors in total catechins after nine days of storage at 50 °C in green tea beverages prepared from steamed and roasted processing were 63.84% and 41.86%, respectively, which were higher losses than our results for the same period of storage.
On the other hand, Kopjar et al. (2009)Kopjar, M., Piližota, V., Hribar, J., and Simčič, M. (2009). Total phenol content and antioxidant activity of water solutions of plant extracts. Croatian Journal of Food Science Technology, 1, 1-7. reported a loss of the 10.38% in the total phenols content and the 4.07% in the DPPH antioxidant capacity after one week of storage at room temperature in water-soluble green tea extract. Although Nekvapil et al. (2012)Nekvapil, T., Kopriva, V., Boudny, V., Hostovsky, M., Dvorak, P., and Malota, L. (2012). Decrease in the antioxidant capacity in beverages containing tea extracts during storage. The Scientific World Journal. Volume 2012, 361698. https://doi.org/10.1100/2012/361698
https://doi.org/10.1100/2012/361698...
used another method, they obtained findings similar to ours in the loss of the antioxidant capacity. They observed a decrease of 16% and 24% in the antioxidant capacity at four and seven days of storage at22 °C, respectively, in a commercial green tea withaloe vera.
Other studies have evaluated the water hot extracts of green tea at different conditions. Komes et al. (2010)Komes, D., Horžić, D., Belščak, A., Ganić, K. K., and Vulić, I. (2010). Green tea preparation and its influence on the content of bioactive compounds. Food Research International, 43, 167-176. https://doi.org/10.1016/j.foodres.2009.09.022
https://doi.org/10.1016/j.foodres.2009.0...
analyzed three commercial bagged green teas brewed at 80 °C for٣ min. They found values ranging from 1400 to 2560 mg∙L–1 in total phenols and from 683 to 1073 mg∙L–1 in total catechins and around 5000 to 10500 µmolTE∙L–1 in DPPH antioxidant capacity, which is higher than our results at the initial day of the experiment.
Kodama et al. (2010)Kodama, D. H., Gonçalves, A. E. S. S., Lajolo, F. M., and Genovese M. I. (2010). Flavonoids, total phenolics and antioxidant capacity: comparison between commercial green tea preparations. Food Science and Technology, 30, 1077-1082. https://doi.org/10.1590/S0101-20612010000400037
https://doi.org/10.1590/S0101-2061201000...
brewed six commercial bagged green teas at 97 °C for ٥ min. They found an average values of total phenols content ranging from 480 to 1005 mg∙L–1 and DPPH antioxidant capacity ranging from 220000 to 650000 μmol∙L–1. Their results in total phenols are lower than our data but their antioxidant capacity levels are higher than our results.
Rodrigues et al. (2015)Rodrigues, C. V., Silva M. V., Santos A. R., Zielinski A. A. F., and Haminiuk C. W. I. (2015). Evaluation of hot and cold extraction of bioactive compounds in teas. International Journal of Food Science and Technology, 50, 2038-2045. https://doi.org/10.1111/ijfs.12858
https://doi.org/10.1111/ijfs.12858...
extracted phenolic from green tea brewing it at 80 °C for ٧.٥ min with stirring, obtaining2896 mg∙L–1 of total phenols and a radical scavenging of 58.57% of DPPH, which is higher to our content in total phenols but lower than our results in the DPPH radical scavenging at initial day of experiment.
In conclusion, the results of the present study showed that total phenols and total catechins content decreased 44.67% and 33.40%, respectively, after nine days of storage at commercial conditions. In addition, the antioxidant capacity decreased at levels of 58.62% and 53.24% in terms of micromoles of trolox equivalents and percentage of radical scavenging, respectively. Due to the worldwide high consume of ready-to-drink green tea beverages, the results of the present study are important because they inform consumers, manufacturers and food researches about the changes in their phenolic content during short storage.
short storage
- [AOAC] Association of Official Analytical Chemist International (1998). Official Methods of Analysis. 16th Ed., 4th Rev. Maryland: AOAC International.
- Cabrera, C., Artacho, R., and Giménez, R. (2006). Beneficial effects of green tea - a review. Journal of the American College of Nutrition, 25, 79-99. https://doi.org/10.1080/07315724.2006.10719518
» https://doi.org/10.1080/07315724.2006.10719518 - Chen, Z.-Y., Zhu, Q. Y., Tsang, D., and Huang Y. (2001). Degradation of green tea catechins in tea drinks. Journal of Agricultural and Food Chemistry, 49, 477-482. https://doi.org/10.1021/jf000877h
» https://doi.org/10.1021/jf000877h - Chum, O. K., and Kim, D. O. (2004). Consideration on equivalent chemicals in total phenolic assay of chlorogenic acid-rich plums. Food Research International, 37, 337-342. https://doi.org/10.1016/j.foodres.2004.02.001
» https://doi.org/10.1016/j.foodres.2004.02.001 - ColorHexa (2017) Color Encyclopedia: Information and Conversion [Computer Software]. ColorHexa; [accessed 2017 July 31]. http://www.colorhexa.com
» http://www.colorhexa.com - [CIE] Commission Internationale De L’ecleirage (2004). 15 Technical Report: Colorimetry. 3rd ed. Vienna: Commission Internationale De L’ecleirage.
- Del Rio, D., Calani, L., Scazzina, F., Jechiu, L., Cordero, C., and Brighenti F. (2010). Bioavailability of catechins from ready-to-drink tea. Nutrition, 26, 528-533. https://doi.org/10.1016/j.nut.2009.06.013
» https://doi.org/10.1016/j.nut.2009.06.013 - Ding, M.-Y., Chen, P.-R., and Luo, G.-A. (1997). Simultaneous determination of organic acids and inorganic anions in tea by ion chromatography. Journal of Chromatography A, 764, 341-345. https://doi.org/10.1016/S0021-9673(96)00910-7
» https://doi.org/10.1016/S0021-9673(96)00910-7 - González-Aguilar, G. A., Villegas-Ochoa, M. A., Martínez-Téllez, M. A., Gardea, A. A., and Ayala-Zavala, J. F. (2007). Improving antioxidant capacity of fresh-cut mangoes treated with UV-C. Journal of Food Science, 72, S197-S202. https://doi.org/10.1111/j.1750-3841.2007.00295.x
» https://doi.org/10.1111/j.1750-3841.2007.00295.x - Heil, M., Baumann, B., Andary, C., Linsenmair, K. E., and McKey, D. (2002). Extraction and quantification of “condensed tannins” as a measure of plant anti-herbivore defence? Revisiting an old problem. Naturwissenschaften, 89, 519-524. https://doi.org/10.1007/s00114-002-0366-3
» https://doi.org/10.1007/s00114-002-0366-3 - Kodama, D. H., Gonçalves, A. E. S. S., Lajolo, F. M., and Genovese M. I. (2010). Flavonoids, total phenolics and antioxidant capacity: comparison between commercial green tea preparations. Food Science and Technology, 30, 1077-1082. https://doi.org/10.1590/S0101-20612010000400037
» https://doi.org/10.1590/S0101-20612010000400037 - Komes, D., Horžić, D., Belščak, A., Ganić, K. K., and Vulić, I. (2010). Green tea preparation and its influence on the content of bioactive compounds. Food Research International, 43, 167-176. https://doi.org/10.1016/j.foodres.2009.09.022
» https://doi.org/10.1016/j.foodres.2009.09.022 - Kopjar, M., Piližota, V., Hribar, J., and Simčič, M. (2009). Total phenol content and antioxidant activity of water solutions of plant extracts. Croatian Journal of Food Science Technology, 1, 1-7.
- Kosińska, A., and Andlauer, W. (2014). Chapter 12 – Antioxidant capacity of tea: effect of processing and storage. In V. Preedy (Ed.), Processing and Impact on Antioxidants in Beverages (p. 109-120). Amsterdam: Elsevier. https://doi.org/10.1016/B978-0-12-404738-9.00012-X
» https://doi.org/10.1016/B978-0-12-404738-9.00012-X - Minitab (2004). Minitab 14.0 statistical software [Computer software]. State College: Minitab Inc.
- Nekvapil, T., Kopriva, V., Boudny, V., Hostovsky, M., Dvorak, P., and Malota, L. (2012). Decrease in the antioxidant capacity in beverages containing tea extracts during storage. The Scientific World Journal. Volume 2012, 361698. https://doi.org/10.1100/2012/361698
» https://doi.org/10.1100/2012/361698 - Randhawa, M. A., Rashid, A., Saeed, M., Javed, M. S., Khan, A. A., and Sajid, M. W. (2014). Characterization of organic acids in juices of some Pakistani citrus species and their retention during refrigerated storage. The Journal of Animal and Plant Sciences, 24, 211-215.
- Reygaert, W. C. (2017). An update on the health benefits of green tea. Beverages, 3, 6. https://doi.org/10.3390/beverages3010006
» https://doi.org/10.3390/beverages3010006 - Rodrigues, C. V., Silva M. V., Santos A. R., Zielinski A. A. F., and Haminiuk C. W. I. (2015). Evaluation of hot and cold extraction of bioactive compounds in teas. International Journal of Food Science and Technology, 50, 2038-2045. https://doi.org/10.1111/ijfs.12858
» https://doi.org/10.1111/ijfs.12858 - Sajilata, M. G., Bajaj, P. R., and Singhal, R. S. (2008). Tea polyphenols as nutraceuticals. Comprehensive Reviews in Food Science and Food Safety, 7, 229-254. https://doi.org/10.1111/j.1541-4337.2008.00043.x
» https://doi.org/10.1111/j.1541-4337.2008.00043.x - Wang, L. F., Kim, D. M., and Lee, C. Y. (2000). Effects of heat processing and storage on flavanols and sensory qualities of green tea beverage. Journal of Agricultural and Food Chemistry, 48, 4227-4232. https://doi.org/10.1021/jf0003597
» https://doi.org/10.1021/jf0003597 - Yang, C. S., and Landau, J. M. (2000). Effects of tea consumption on nutrition and health. Journal of Nutrition, 130, 2409-2412. https://doi.org/10.1093/jn/130.10.2409
» https://doi.org/10.1093/jn/130.10.2409
Publication Dates
-
Publication in this collection
17 Jan 2019 -
Date of issue
Jan-Mar 2019
History
-
Received
01 Jan 2018 -
Accepted
26 Mar 2018