
ABSTRACT
Land-use change from herbaceous to woody cover -or vice versa- largely affects water fluxes, which in turn can mobilize existing salts dissolved in the soil, and thereby negatively affect soil and/or water quality and site productivity. Secondary salinization was observed after afforestation at the Northern and Eastern subregions of the Río de la Plata Grassland. Based on this, our objective was to determine the degree of association between the climatic (e.g. water balance), edaphic (e.g. texture, presence of petrocalcic horizons) and biological factors (age of plantation, stand density and stand basal area) with the secondary salinization processes under the particular environmental conditions of the Austral Pampas. The lowest electrical conductivity (EC, µS.cm-1) values were found in sites with sandy-textured soils and negative water balance, regardless of tree canopy cover. When EC differences did occur between land uses of the same site (50% of the sites), in most cases - but not in all of them - the highest EC was measured under tree cover. When salinization was significant, no pattern was observed in the salt distribution along the soil profile. An increase of EC was associated with the oldest-unmanaged plantations, with mean age of 40 years, a period much longer than the productive rotation recommended. Under similar edaphic conditions where salinization was observed (i.e. clayed soils, with naturally high salt level), salinization was not significant in relatively young plantations (<rotation period), demonstrating the key role of forest management to decrease its negative impacts on soils.
Keywords:
Salt accumulation; Eucalyptus plantations; Afforestation impacts; Land use change; Water balance
INTRODUCTION
The Río de la Plata Grassland (RPG) in Argentina, South America, is an important area due to its high capacity to produce food products from agriculture (mainly soybean, sunflower, wheat, and maize) for a human growing population. This is possible because the original grassland was replaced by croplands during the last century (Baldi and Paruelo, 2008BALDI, G.; PARUELO, J.M. Land-use and land cover dynamics in South American temperate grasslands. Ecology and Society, v. 13, p. 6-23, 2008. ). In addition, but in a much lower magnitude than annual crops, forest plantation with species of Eucalyptus and Salicaceae were introduced in soils that present different limiting factors for agriculture in this region (Baldi and Paruelo, 2008).
Land-use change from herbaceous to woody cover -or vice versa- largely affects water fluxes in a degree that depends on the interaction between the precipitation level and the vegetation cover. This interaction determines the partition between transpiration, deep drainage and runoff (Jobbágy et al., 2008JOBBÁGY, E.; NOSETTO, M.; SANTONI, C.; BALDI, G. El desafío ecohidrológico de las transiciones entre sistemas leñosos y herbáceos en la llanura Chaco-Pampeana. Ecología Austral, v. 18, p. 305-322, 2008. ; Viglizzo et al., 2015VIGLIZZO, E.F.; NOSETTO, M.D.; JOBBÁGY, E.G.; RICARD, M.F.; FRANK, F.C. The ecohydrology of ecosystem transitions: a meta-analysis. Ecohydrology, v. 8, p. 911-921, 2015. ). The movement and accumulation of salts in the soil is in turn linked to those water fluxes, showing rapid changes in time (e.g. Morris and Collopy, 1999MORRIS, J.D.; COLLOPY, J.J. Water use and salt accumulation by Eucalyptus camaldulensis and Casuarina cunninghamiana on a site with shallow saline groundwater. Agricultural Water Management, v. 39, p. 205-227, 1999. ) and even large differences in close horizontal distances (e.g. Cao et al., 2020CAO, Q.; YANG, B.; LI, J.; WANG, R.; LIU, T.; XIAO, H. Characteristics of soil water and salt associated with Tamarix ramosissima communities during normal and dry periods in a semi-arid saline environment. Catena, v. 193, p. 104661, 2020. ). It is well documented the process of salt accumulation in the root zone and in the groundwater in originally grassland sites that were converted to forest plantations with tree species that reach the water-table (Engel et al., 2005ENGEL, V.; JOBBÁGY, E.; STIEGLITZ, M.; WILLIAMS, M.; JACKSON, R. Hydrological consequences of Eucalyptus afforestation in the Argentine Pampas. Water Resources Research, v. 41, p. W10409, 2005. ; Jobbágy and Jackson, 2007; Nosetto et al., 2013NOSETTO, M.; ACOSTA, A.M.; JAYAWICKREME, D.H.; BALLESTEROS, S.I.; JACKSON, R.; JOBBÁGY, E.G. Land-use and topography shape soil and groundwater salinity in central Argentina. Agricultural Water Management , v. 129, p. 120-129, 2013. ; Thóth et al., 2014). In these sites, salts are accumulated in the rizosphere and aquifers due to the tree roots capacity to exclude solutes and the higher amount of groundwater used by the afforestation. This promotes the lateral movement of the groundwater from the surrounded sites to the tree planted area (Jobbágy and Jackson, 2007; Nosetto et al., 2013).
The replenishment of the groundwater used by the afforestation to feed trees´ transpiration depends on the hydraulic conductivity of the soil, which is related to its texture (proportion of clay, silt and sand). Moreover, the magnitude of the vegetation transpiration depends on the interplay between its physiological capacity and the potential evapotranspiration. In this regard, secondary salinization under afforestation was higher in the drier than in the humid sites in the Northern and Eastern subregions of the Río de la Plata Grassland (Nosetto et al., 2008NOSETTO, M.; JOBBÁGY, E.; TÓTH, T.; JACKSON, R. Regional patterns and controls of ecosystem salinization with grassland afforestation along a rainfall gradient. Global Biogechemical Cycles, v. 22, p. GB2015, 2008. ; 2013). In addition, a positive relationship has been found between the magnitude of accumulated salts in soil and groundwater and several biological variables such as salinity tolerance, maximum aboveground biomass developed and the age of the tree species (Morris and Collopy, 1999MORRIS, J.D.; COLLOPY, J.J. Water use and salt accumulation by Eucalyptus camaldulensis and Casuarina cunninghamiana on a site with shallow saline groundwater. Agricultural Water Management, v. 39, p. 205-227, 1999. ; Nosetto et al., 2008; Thóth et al., 2014).
Most of the antecedents about the impact of afforestation on pampas grasslands come from studies developed in the Flooding and the Rolling pampas, which present particular edaphic and climatic characteristics that differ from the southern located- subregions. In this regard, the Austral Pampas present ancient rocky hills and soils with a relatively good drainage that impedes extensively flooded events (Paruelo et al., 2007PARUELO, J. M.; JOBBÁGY, E.; OESTERHELD, M.; GOLLUSCIO, R.A.; AGUIAR, M.R. Grasslands and steppes of Patagonia and the Río de la Plata plains. In: VEBLEN, T.T.; YOUNG, K.R.; ORME, A.R. The physical geography of South America, 2007. p. 232-248. ). The soils in the plain landscape in this subregion is related to the eolian deposition of loess over a petrocalcic horizon (CaCO3 - cemented layer locally called “tosca”), generating a wide variability in soil depth (Paruelo et al., 2007; Blanco et al., 2007BLANCO, M. DEL C.; STOOPS, G. Genesis of pedons with discontinuous argillic horizons in the Holocene loess mantle of the southern Pampa landscape, Argentina. Journal of South American Earth Sciences, v. 23, p. 30-45, 2007. ; Dietrich et al., 2014DIETRICH, S.; WEINZETTEL, P.A.; VARNI, M. Infiltration and drainage analysis in a heterogeneous soil by electrical resistivity tomography. Soil Science Society of America Journal, v. 78, p. 1153-1167, 2014. ). These petrocalcic horizons could modify the soil water flow patterns and the available water for plants because they are generally considered as a barrier to root growth and water vertical movement (Dietrich et al., 2014; Weil and Brady, 2017WEIL, R.R.; BRADY, N.C. The nature and properties of soils. Pearson Education, Inc. 2017. 1071p. ). A recent study in the Austral Pampas has showed that trees´ water consumption was restricted to the soil layer above the petrocalcic horizon, with almost no connection to the groundwater (Mujica et al., 2019MUJICA, C.; MILIONE, G.; BEA, S.A.; GYENGE, J. A process-based numerical approach to estimate forest groundwater consumption in flatland petrocalcic soils. Journal of Hydroinformatics, v. 11, p. 1130-1146, 2019. ). In this regard, the presence of a tosca horizon would inhibit soil salt accumulation (Jobbágy and Jackson, 2004JOBBÁGY, E.; JACKSON, R. B. Groundwater use and salinization with grassland afforestation. Global Change Biology, v. 10, p. 1299-1312, 2004. ). This particular environmental condition of Austral Pampas would imply, therefore, a different impact of vegetation replacement on water fluxes and the probability of occurrence of secondary salinization of soils compared to other subregions. Determining where and how the salinization phenomenon may occur is important since it is invoked as a limiting factor for sustainable forestry development in these original grassland areas (Jobbágy and Jackson, 2004; 2007; Jobbágy et al., 2008).
Based on this background, the objective of this study was to determine the occurrence of the soil salinization process associated to the replacement of grassland by afforestation in the Austral Pampas, considering the differences in climate conditions, soil texture and the presence of the petrocalcic horizons that differ from the previous studies at the Northern and Eastern subregions of the RPG. In addition, we also considered the biological characteristics of the plantations in the region (e.g. age, canopy cover, stand density) as another potential driver of the secondary soil salinization process.
MATERIAL AND METHODS
Environmental characteristics of the study sites
We established a 500 km East-West transect in the Austral Pampa, closer to the southern limit of the Flooding Pampa, with 16 measurement sites in the center-south of Buenos Aires Province (approx. from 36 to 37 °S to 58 to 62 °W; Figure 1, Table 1). Average annual temperature is 15.2 °C, with average minimum and maximum of 9 and 21.4°C, respectively (Barros et al., 2013BARROS, V.; VERA, C.; AGOSTA, E.; ARANEO, D.; CAMILLONI, I.; CARRIL, A.; DOYLE, M.; FRUMENTO, O.; NUÑEZ, M.; ORTIZ DE ZÁRATE, M. I.; PENALBA, O.; RUSTICUCCI, M.; SAULO, C.; SOLMAN, S. Tercera comunicación nacional sobre cambio climático “cambio climático en Argentina; tendencias y proyecciones”. Centro de Investigaciones del Mar y la Atmósfera. 2013. 341 p. ). A slight gradient of decreased mean temperature is observed from the East-North to the West-South. The annual precipitation ranges from 1,000 mm year-1 at the Eastern and lower than 800 mm year-1 at the Western end of the studied transect (see below), distributed more homogeneously throughout the year at the East than at the West of the region (Paruelo et al., 2007PARUELO, J. M.; JOBBÁGY, E.; OESTERHELD, M.; GOLLUSCIO, R.A.; AGUIAR, M.R. Grasslands and steppes of Patagonia and the Río de la Plata plains. In: VEBLEN, T.T.; YOUNG, K.R.; ORME, A.R. The physical geography of South America, 2007. p. 232-248. ; Barros et al., 2013; Figure 1). This pattern determines a water balance (difference between mean annual precipitation and Penman-Monteith modified by FAO potential evapotranspiration) gradient along the transect, from positive values or near zero in the East to negative values around -200 mm year-1 at the West (Nosetto et al., 2008NOSETTO, M.; JOBBÁGY, E.; TÓTH, T.; JACKSON, R. Regional patterns and controls of ecosystem salinization with grassland afforestation along a rainfall gradient. Global Biogechemical Cycles, v. 22, p. GB2015, 2008. ; Figure 1).
Measured sites (black dots) were grouped in three districts of Buenos Aires Province, Argentina: (G) Guaminí, (A) Azul and (B) Balcarce-Lobería. Water balance was estimated as average annual precipitation minus Penman-Montheith potential evapotranspiration (modified following Nosetto et al., 2008NOSETTO, M.; JOBBÁGY, E.; TÓTH, T.; JACKSON, R. Regional patterns and controls of ecosystem salinization with grassland afforestation along a rainfall gradient. Global Biogechemical Cycles, v. 22, p. GB2015, 2008. ), and is marked with dotted lines. Diagrams of monthly average precipitation and evapotranspiration at the extreme sites of the transect are shown.

Measured sites (black dots) were grouped in three districts of Buenos Aires Province, Argentina: (G) Guaminí, (A) Azul and (B) Balcarce-Lobería. Water balance was estimated as average annual precipitation minus Penman-Montheith potential evapotranspiration (modified following Nosetto et al., 2008NOSETTO, M.; JOBBÁGY, E.; TÓTH, T.; JACKSON, R. Regional patterns and controls of ecosystem salinization with grassland afforestation along a rainfall gradient. Global Biogechemical Cycles, v. 22, p. GB2015, 2008. ), and is marked with dotted lines. Diagrams of monthly average precipitation and evapotranspiration at the extreme sites of the transect are shown.
Soil depth and texture also change from East to West in this region, from clay loam relatively shallow soils (due to the presence of a petrocalcic horizon) to deep sandy soils (Table 1). Along this East- Eest gradient across Pampas, soils shift from Mollisols with high clay accumulation in subsurface horizons, presenting sodic and/or hydromorphic soils (natric and aquic Mollisols to Alfisols) in the flattest portions of the region, to Entisols.
Experimental design and measured variables
Two paired plots in each site were measured (32 different plots): an Eucalyptus spp. plantation plot (E. globulus Labill., E. viminalis Labill., or E. camaldulensis Dehnh.) and a herbaceous plot (annual crop or grazing pasture-grassland). Each plot was located at least 50 m from the afforested/ herbaceous boundary to avoid edge effects.
Soil samples were collected, using an auger, at 5 randomized points per plot during winter (August) 2015. Samples were taken every 20 cm of soil depth down to 200 cm or to the greatest depth possible due to the presence of a petrocalcic horizon. We analyzed the electrical conductivity (EC, µS cm-1) in each soil sample (n=5 per plot and soil layer) in 1:2.5 dilutions with distilled water, by means of an OAKTON PC700 scanner with an EC-temperature 35608-74 probe. We used EC as a proxy for Na+ concentration, following Bosch Mayol et al. (2012), who found a significant relationship between them for these soils. We determined the soil texture of each sample by the Bouyoucos method (e.g. Bouyoucos, 1962BOUYOUCOS, G.J. Hydrometer method improved for making particle size analysis of soils. Agronomy Journal, v. 54, p. 464-465, 1962. ; Elliot et al., 1999ELLIOT, E.T.; JEIL, J.W.; KELLY, E.F.; CURTIS MONGER, H. Soil structural and other physical properties. In: ROBERTSON, G.P.; COLEMAN, D.C.; BLEDSOE, C.S.; SOLLINS, P. Standard soil methods for long term ecological research, Oxford University Press, 1999. p. 74-85. ).
To analyse the structural features of each forest stand, we established sampling areas of different size according to the stand density and tree spatial distribution. We established circular plots 10 or 30 meters in diameter, depending on the distance among the trees, in sites with irregular stand density (sites A3, A4, A5, A6 and G3; Table 1). On the contrary, in sites with regular distributed trees (sites A1, A2, A7, B1, B2, B3, G1, G2, G4, G5 and G6; Table 1), we established areas defined by 4 by 10 rows of trees, measuring the final area a posteriori (Figure 2). After that, stand density was upscaled to the hectare counting the number the trees in each plot.
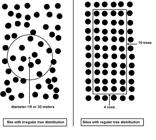
Delimitation of the sampling plots inside the forest plantations (black dots represent trees). Plot size was variable, depending on the stand density and the spatial distribution of the trees.
We used a diameter tape to measure the diameter at breast height (130 cm above the ground; DBH, cm) of all living trees (with DBH > 3 cm) within each sample plot, and a Suunto PM-5/360PC clinometer (Suunto, Finland) to measure the height of the 5 dominant trees (H, m). Stand basal area (AB, m2ha-1) was calculated from the sum of all the individual cross-sectional areas obtained from their DBH and upscaled to the hectare (Table 2). We estimated forest cover by analyzing five flat photographs of the canopy in each plot taken by placing a horizontal camera pointing upwards, and then using ImageJ 1.48v software (Wayne Rasband, National Institutes of Health, US). Other characteristics of the afforested sites such as plantation age, harvesting history, or other interventions were provided by the owners of the plantations. Stand density ranged from 283 to 3438 trees ha-1, and plantation age ranged from 6 to more than 100 years (Table 2). The non-forested plots were identified as crop species, natural grassland or seeded pasture.
Description of the plantation stands: Sites (code letters indicate districts: G-Guaminí, A-Azul and B-Balcarce- Lobería, and numbers indicate the plot identification), stand density (D) diameter at breast height (130 cm above the ground; DBH), basal area (BA), dominant height (H), canopy cover (Cov) and years since plantation establishment (Age).
Statistical analysis
Initially, we compared the soil layers between paired plots in order to describe the spatial distribution of EC at different soil depths (n=5 per soil depth per plot). We compared the different soil layers between plots at similar soil depth, so the maximum depth studied at each site corresponded to the maximum depth reached in one of the paired plots. In both cases (i.e. average EC of the soil profile, and EC of each soil layer), we applied one-way ANOVA after checking ANOVA assumptions using InfoStat version 2011 (Di Rienzo et al., 2011) free software.
In order to detect patterns associated to mean environmental conditions, we made two different data groupings. First, we grouped the plots according to districts (Balcarce-Lobería, Azul and Guaminí, Figure 4A), which varies mainly (but not only) in their water balance. Then, we grouped sites according to their soil texture (clay, loam, silt, sandy, Figure 4B). The independent variable was the average EC of each plot, which resulted from the average of all soil depths in all 5 sampled points per plot. This results in one EC value for the forested plot and one EC value for the non-forested plot in each site. Two-way ANOVA was applied using district/soil texture and land use as factors. It is important to note that there are no combinations of all factors (climate, species, soil texture) because climate and soil vary at the same time along the sampled transect, so it was not possible to separate each individual factor.
In order to test the effect of the biological factors describing the forested plots over the salinization process, we classified the studied 16 sites in two groups: those sites with significant differences in soil EC between the forested and the non-forested paired plot, and those with no significant differences. Then, we compared by One-way ANOVA, the mean values of plantation age, canopy cover and stand basal area between the two groups.
RESULTS
Tree plots structure and canopy cover
In general, the studied plantation plots lacked silvicultural treatments (pruning and thinning). Stand basal area (BA) ranged approximately from 13 to 83 m2 ha-1 (Table 2; Figure 3), with no clear relationship with stand density (Figure 3A). Even with relatively large differences in BA between the plots, tree canopy cover was generally around 60% (Figure 3B).

Relationship between stand density (trees ha-1, A) and canopy cover (%, B) with basal area (BA, m2 ha-1) in Eucalyptus spp. stands (E. viminalis, E. globulus and E. camaldulensis).
Soil variables
Due to the presence of a petrocalcic layer, soil was shallower in the center of the transect in Azul district (40 to 80 cm depth; sites A) than in Balcarce-Lobería (60 to 120 cm depth; sites B) and Guaminí (60 to >200 cm; sites G; all in Figure 1 and Table 1). These results indicate that the deepest and most sandy soils were found in Guaminí district (Western side of the transect, Table 1), which also showed negative water balance (Figure 1). On the other hand, shallower soils with clay texture (Table 1) and more positive water balance were found at the center (Azul) and at the Eastern of the transect (Balcarce-Lobería).
Average EC of the soil profiles (from soil surface to the maximum depth in each site) ranged from 50 to 800 µS cm-1 in soils under the forest plantations, and from 50 to 350 µS cm-1 in soils under herbaceous vegetation (Table 3), increasing with the percentage of clay in the soil texture (insert in Figure 4B). Average soil EC was lower at the West, Guaminí district (mean around 75 µS cm-1) compared to the other sites (mean value of 235 µS cm-1 considering Azul and Balcarce-Lobería districts; Figure 4A). No significant differences were observed between forested and non-forested plots grouping the data by both the district and soil texture (Fig 4A and B).
Soil electrical conductivity (EC, µS cm-1, average ± s.d) in each paired afforestation and herbaceous plot (Eg= Eucalyptus globulus, Ev= Eucalyptus viminalis, Ec= Eucalyptus camaldulensis, Ng= natural grassland, F= fallow, W= wheat). Asterisks in the site code denote statistical differences between paired plots in at least one depth along the soil profile..

Soil electrical conductivity (EC, μS cm-1) of plots with herbaceous cover (crops and grasslands) and those with Eucalyptus afforestation, in the different districts (Balcarce-Lobería, Azul and Guaminí, panel A) and in the different soil textures (panel B) along the study transect. Different letters denote significant differences (P < 0.05).
Comparing forested plots along the studied transect, the highest average EC values were observed in the sites with high clay content in the soil, which coincides also with the most positive water balance.
Although no significant differences were observed between land uses considering the average of the whole soil profile, significant differences between afforested and herbaceous plots in at least one soil layer were found in 10 out of the 16 paired plots analyzed (Figure 5).

Soil electrical conductivity (EC, μS cm-1) at different sampling depths in plots covered by herbaceous vegetation (crops and grasslands) and Eucalyptus spp. in districts: Guaminí (panels A to C), Azul (panels D to I) and Balcarce-Lobería (panel J). Only the 10 plots in which statistical differences in at least one soil layer are depicted. Asterisks denote significant differences between soils layers between the two vegetation types in each site (P < 0.05).
In Guaminí district (Figure 5 A to C), three different EC distribution patterns were observed between the herbaceous and forested plots: (1) differences in soil EC only in the shallowest soil portion (Figure 5A, site G2), (2) differences in EC throughout the entire soil profile (Figure 5B, G4) and (3) differences in EC only at the deepest layers (Figure 5C, G5). Where differences were observed only in the shallowest part of the soil, EC was higher in the herbaceous (wheat) than in the afforested plot (site G2; Table 1, Figure 5A).
In the center of the transect (Azul district), soil depth was limited by the presence of petrocalcic horizons at depths between 40 and 80 cm. As was observed in Guaminí, we found one situation in which EC was higher in the herbaceous plot (natural grassland) compared with the adjacent forested plot (Figure 5D). In those paired plots with statistical differences, the higher EC values were found at different soil layers: in the deepest ones (Figure 5 D, H and I; sites A2, A6 and A7), in the shallowest layers (Figure 5 E and F; sites A3 and A4), and throughout the entire soil profile (Figure 5 G; site A5). The greatest differences between herbaceous and forested plots were observed at the site where EC was naturally higher (Figure 5 H; site A6).
In the Balcarce-Lobería district, located at the Eastern side of the transect where the water balance is positive, significant differences were found only in one paired plot (Figure 5J; site B3). In this case, significant differences were found in all soil layers, with the greatest difference in the deepest layer (Figure 5J).
The mean age of the plantations leading to significant changes in soil EC was higher than the age of plantations with no significant differences with herbaceous plots (Figure 6). This suggests that a quite long period of about 30 years of non-management is needed to induce significant changes in soil EC. In contrast, the canopy cover and the stand basal area were similar in sites with and without significant changes in EC due to land use change (Figure 6).

Mean (SD) age, canopy cover and basal area of plantations with and without significant changes of soil EC compared to the contiguous herbaceous plot. Different letters represent statistical differences between groups of plantations (P < 0.05), which were only observed in the age of plantation.
DISCUSSION
Regional patterns and magnitude of secondary salinization
It has been proposed that planting trees in flat areas, formerly natural grasslands, leads to a secondary salinization process in the soils linked to the higher water consumption of the trees compared to the original vegetation (Nosetto et al., 2008NOSETTO, M.; JOBBÁGY, E.; TÓTH, T.; JACKSON, R. Regional patterns and controls of ecosystem salinization with grassland afforestation along a rainfall gradient. Global Biogechemical Cycles, v. 22, p. GB2015, 2008. ). However, our results indicate that this is not a regional generalized process and also, that the mean values of EC were, in general, lower than those described for the northern region of the Pampas (Flooding and Inner Pampa; Engel et al., 2005ENGEL, V.; JOBBÁGY, E.; STIEGLITZ, M.; WILLIAMS, M.; JACKSON, R. Hydrological consequences of Eucalyptus afforestation in the Argentine Pampas. Water Resources Research, v. 41, p. W10409, 2005. ; Jobbágy and Jackson, 2007JOBBÁGY, E.; JACKSON, R.B. Groundwater and soil chemical changes under phreatophytic tree plantations. Journal of Geophysical Research, v. 112, g02013, 2007. ; Nosetto et al., 2013).
In the reported previous studies, a high proportion of sampled plantations led to secondary salinization, whereas in our study, no statistical differences in the average EC of the whole soil profile between land uses were observed in either site. However, in 10 out of the 16 sampled sites we found significant differences in EC between land uses in any of the soil depths, most of them showing a higher EC in the forested plot. Notwithstanding this, there were situations in which the EC at some soil depths was higher in the herbaceous land use than in the contiguous forested plot. This last phenomenon has also been reported previously in the upper soil layers of forested and non-forested plots in Hungary grasslands (Tóth et al., 2014TÓTH, T.; BALOG, K.; SZABÓ, A.; PÁSZTOR, L.; JOBBÁGY, E.; NOSETTO, M.; GRIBOVSZKI, Z. Influence of lowland forests on subsurface salt accumulation in shallow groundwater areas. AoB Plants, v. 6, plu054, 2014. ).
Regarding the magnitude of the salinization process, the studies carried out in the Flooding and Inner Pampas reported that forest plantations present, in average, twice the EC of contiguous grasslands. However, in those studies the salinization process was associated to sites with relatively high EC in the original grassland (around 1000 µS cm-1), with no effects on EC due to land use change in places with EC < 1000 µS cm-1 (Nosetto et al., 2008NOSETTO, M.; JOBBÁGY, E.; TÓTH, T.; JACKSON, R. Regional patterns and controls of ecosystem salinization with grassland afforestation along a rainfall gradient. Global Biogechemical Cycles, v. 22, p. GB2015, 2008. ). In our study, all measured sites presented lower average EC in the herbaceous plot than that threshold. We observed EC values higher than 1000 µS cm-1 in only two forested plots (sites A6 and B3, see next section for discussion). Our results of the herbaceous plots in the eastern portion of the studied region (in the range of 115-350 µS cm-1) are in agreement with EC values reported for the soils of the same area by other authors (180-480 µS cm-1, Peralta et al., 2013PERALTA, N.R.; COSTA, J.L.; BALZARINI, M.; ANGELINI, H. Delineation of management zones with measurements of soil apparent electrical conductivity in the southeastern pampas. Canadian Journal of Soil Science, v. 93, p. 205-218, 2013. ). In contrast, values of soil EC in the Flooding pampas are up to 2000 µS cm-1 in non-pastored grasslands but increasing to 3900 or 6850 µS cm-1 in degraded lowland and upland grasslands of the same region (Chaneton and Lavado, 1996CHANETON, E.J.; LAVADO, R.S. Soil nutrients and salinity after long-term grazing exclusion in a Flooding Pampa grassland. Journal of Range Management, v. 49, p. 182-187, 1996. ). This contrasting soil EC values along the Pampas may be the main driver of the different effects of afforestation on soil salinization processes among studies and subregions.
Environmental characteristics related to secondary soil salinization
In contrast to what was expected based on the antecedents of salinization in afforested grasslands, in the present study significant differences in EC of some soil depths between land uses were observed in sites that present positive water balance and fine textured (i.e. with lower hydraulic conductivity) shallower soils.
The expected impact of a negative water balance on the salinization process was mediated by the limited available water to leach the accumulation of salts. However, in our study the lowest average EC values, as well as the lowest differences between land uses, were observed in the sites of Guamini district, characterized by a negative water balance (EVT>P) and sandy soils. The lack of a secondary salinization process observed in these sites may be due to the inherent low content of salts in these sandy deep soils or because there exists an accumulation of salts below the maximum soil depths explored here (> 2 m deep), as has been suggested by Nosetto et al. (2013NOSETTO, M.; ACOSTA, A.M.; JAYAWICKREME, D.H.; BALLESTEROS, S.I.; JACKSON, R.; JOBBÁGY, E.G. Land-use and topography shape soil and groundwater salinity in central Argentina. Agricultural Water Management , v. 129, p. 120-129, 2013. ). Our results are in agreement with a long-term monitoring of EC in shelterbelts in an arid area of China, where it was observed higher salinity in clay than in sandy soils (Zhao et al., 2013ZHAO, X.; XU, H.; ZHANG, P.; FU, J.; BAI, Y. Soil water, salt, and groundwater characteristics in shelterbelts with no irrigation for several years in an extremely arid area. Environmental Monitoring Assessment, v. 185, p. 10091-10100, 2013.).
On the other hand, one of the basis of the hypothesis explaining the secondary salinization of afforested soils is the tree transpiration coupling with the water table (Nosetto et al., 2008NOSETTO, M.; JOBBÁGY, E.; TÓTH, T.; JACKSON, R. Regional patterns and controls of ecosystem salinization with grassland afforestation along a rainfall gradient. Global Biogechemical Cycles, v. 22, p. GB2015, 2008. ; Tóth et al., 2014TÓTH, T.; BALOG, K.; SZABÓ, A.; PÁSZTOR, L.; JOBBÁGY, E.; NOSETTO, M.; GRIBOVSZKI, Z. Influence of lowland forests on subsurface salt accumulation in shallow groundwater areas. AoB Plants, v. 6, plu054, 2014. ). This led us to propose that in sites with a petrocalcic horizon that impedes tree roots access to this additional water source and vertical water fluxes (Dietrich et al., 2014DIETRICH, S.; WEINZETTEL, P.A.; VARNI, M. Infiltration and drainage analysis in a heterogeneous soil by electrical resistivity tomography. Soil Science Society of America Journal, v. 78, p. 1153-1167, 2014. ), the salinization process would not occur. Indeed, a study carried out in parallel to the present one where tree transpiration was measured, no association was observed between the water-table fluctuation and the tree transpiration (Mujica et al., 2019MUJICA, C.; MILIONE, G.; BEA, S.A.; GYENGE, J. A process-based numerical approach to estimate forest groundwater consumption in flatland petrocalcic soils. Journal of Hydroinformatics, v. 11, p. 1130-1146, 2019. ), in contrast to what was described for other sites of the Pampean region (Engel et al., 2005ENGEL, V.; JOBBÁGY, E.; STIEGLITZ, M.; WILLIAMS, M.; JACKSON, R. Hydrological consequences of Eucalyptus afforestation in the Argentine Pampas. Water Resources Research, v. 41, p. W10409, 2005. ; Jobbágy and Jackson, 2007JOBBÁGY, E.; JACKSON, R.B. Groundwater and soil chemical changes under phreatophytic tree plantations. Journal of Geophysical Research, v. 112, g02013, 2007. ). Under the particular conditions of the Austral Pampas, the trees seem to be constrained to use only the water hold by the soil over the petrocalcic layer. However, in spite of this, we did observe some sites with differences in EC between forested and non-forested plots. This suggests that there is no need of connection to the water table for the salinization phenomenon to happen. We suggest that the limited available water in the upper soil profile, which is most of the time near the soil permanent wilting point under the trees (Mujica et al., 2019), constrains salts leaching, which may be accumulated in the portion of soil immediately above the petrocalcic horizon. On the contrary, more salts would be leached in grasslands due to the surplus water in soils left by the relatively low transpiration of the herbaceous plants (Zhang et al., 2001ZHANG, L.; DAWES, W.R.; WALKER, G.R. Response of mean annual evapotranspiration to vegetation changes at catchment scale. Water Resources Research , v. 37, p. 701-708, 2001. ).
Biological characteristics related to secondary soil salinization
Regarding the biological characteristics related to changes in EC, only the plantation age was significant. Neither the tree canopy cover nor the basal area of the stands explained the presence or not of secondary salinization. The higher age of plantations with increased soil EC was, in turn, the consequence of a lack of silvicultural management and harvesting. Unmanaged forest plantations are unfortunately common in the Pampean region. According to this, the previously reported salinization processes were all linked to old unmanaged plantations: 40-56 years old (Nosetto et al., 2008NOSETTO, M.; JOBBÁGY, E.; TÓTH, T.; JACKSON, R. Regional patterns and controls of ecosystem salinization with grassland afforestation along a rainfall gradient. Global Biogechemical Cycles, v. 22, p. GB2015, 2008. ) and 42, 50 and 96 years old (Jobbágy and Jakson, 2004JOBBÁGY, E.; JACKSON, R. B. Groundwater use and salinization with grassland afforestation. Global Change Biology, v. 10, p. 1299-1312, 2004. ). This permanence time is two to five-fold longer than the commercial rotation period of Eucalyptus plantations recommended for the studied region. Depending on the wood destination (pulp vs solid uses), the rotation period is around 12 to 20 years (BA Buenos Aires Forestal, 2010).
It is important to highlight that even when the secondary salinization due to afforestation is a cumulative process linked to the plantation age, it may be reversed when excess water can leach the cumulated salts. According to this, soil EC under a Pinus sp. plantation decreased to similar values than the contiguous herbaceous area two years after harvesting (Milione et al., 2020). In this sense, the measurements of EC in the rizosphere of a E. camaldulensis forest in Australia showed changes of 10,000 µS cm-1 over a period of several months, indicating the existence of mechanisms of rapid salt redistribution and accumulation (Morris and Collopy, 1999MORRIS, J.D.; COLLOPY, J.J. Water use and salt accumulation by Eucalyptus camaldulensis and Casuarina cunninghamiana on a site with shallow saline groundwater. Agricultural Water Management, v. 39, p. 205-227, 1999. ). We propose that forest management alternatives that increase soil water recharge, such as the use of caducifolious species, proper thinning and harvesting and/or low stand density (e.g. silvopastoral systems), may contribute to minimize the accumulation of salts in the soil.
CONCLUSIONS
Secondary salinization process linked to afforestation of grasslands is not a generalized phenomenon in plain landscapes. In our survey, the salinization process associated to forested plots, which was always of low magnitude but statistically significant at some soil depths, was observed only in soils with high clay content and naturally high salt level, in addition to old unmanaged plantations. In similar edaphic conditions, salinization was not significant in relatively young plantations (<rotation period), demonstrating the key role of forest management to decrease the potential negative impacts on soils.
The site water balance was not a significant driver of the studied process, as well as there is no need to a transpiration connection to the water table for the salinization to occur. These results challenge the current ideas about this phenomenon and demand new theoretical frameworks.
ACKNOWLEDGMENTS
We gratefully acknowledge the members of the Instituto de Hidrología de Llanuras (IHLLA) and Forest Engineer Rafael Bilotta for their support in field and laboratory measurements. This project was supported by Research Grant PICT 2013 1223 Prést. BID of FONCYT-MINCyT and INTA (PNFOR 1104073), Argentina.
REFERENCES
- BA BUENOS AIRES FORESTAL. Revista Forestal. Ministerio de Agroindustria de la Provincia de Buenos Aires. Available at Available at http://www.maa.gba.gov.ar/2010/SubPED/Agricultura/ archivos/BAForestal_Revista Accessed in: Apr. 12th 2018.
» http://www.maa.gba.gov.ar/2010/SubPED/Agricultura/ archivos/BAForestal_Revista - BALDI, G.; PARUELO, J.M. Land-use and land cover dynamics in South American temperate grasslands. Ecology and Society, v. 13, p. 6-23, 2008.
- BARROS, V.; VERA, C.; AGOSTA, E.; ARANEO, D.; CAMILLONI, I.; CARRIL, A.; DOYLE, M.; FRUMENTO, O.; NUÑEZ, M.; ORTIZ DE ZÁRATE, M. I.; PENALBA, O.; RUSTICUCCI, M.; SAULO, C.; SOLMAN, S. Tercera comunicación nacional sobre cambio climático “cambio climático en Argentina; tendencias y proyecciones”. Centro de Investigaciones del Mar y la Atmósfera. 2013. 341 p.
- BLANCO, M. DEL C.; STOOPS, G. Genesis of pedons with discontinuous argillic horizons in the Holocene loess mantle of the southern Pampa landscape, Argentina. Journal of South American Earth Sciences, v. 23, p. 30-45, 2007.
- BOSCH MAYOL, M.; COSTA, J.L.; CABRIA, F.N.; APARICIO, V.C. Relación entre la variabilidad espacial de la conductividad eléctrica y el contenido de sodio del suelo. Argentina. Ciencia del Suelo, v. 30, p. 95-105, 2012.
- BOUYOUCOS, G.J. Hydrometer method improved for making particle size analysis of soils. Agronomy Journal, v. 54, p. 464-465, 1962.
- CAO, Q.; YANG, B.; LI, J.; WANG, R.; LIU, T.; XIAO, H. Characteristics of soil water and salt associated with Tamarix ramosissima communities during normal and dry periods in a semi-arid saline environment. Catena, v. 193, p. 104661, 2020.
- CHANETON, E.J.; LAVADO, R.S. Soil nutrients and salinity after long-term grazing exclusion in a Flooding Pampa grassland. Journal of Range Management, v. 49, p. 182-187, 1996.
- DI RIENZO, L.A.; CASANOVES, F.; BALZARINI M.G.; GONZALEZ, L.; TABLADA, M.; ROBLEDO C.W. Grupo InfoStat, FCA. Universidad Nacional de Córdoba, Argentina. (http://www. infostat. com. ar), 2011.
» http://www. infostat. com. ar - DIETRICH, S.; WEINZETTEL, P.A.; VARNI, M. Infiltration and drainage analysis in a heterogeneous soil by electrical resistivity tomography. Soil Science Society of America Journal, v. 78, p. 1153-1167, 2014.
- ELLIOT, E.T.; JEIL, J.W.; KELLY, E.F.; CURTIS MONGER, H. Soil structural and other physical properties. In: ROBERTSON, G.P.; COLEMAN, D.C.; BLEDSOE, C.S.; SOLLINS, P. Standard soil methods for long term ecological research, Oxford University Press, 1999. p. 74-85.
- ENGEL, V.; JOBBÁGY, E.; STIEGLITZ, M.; WILLIAMS, M.; JACKSON, R. Hydrological consequences of Eucalyptus afforestation in the Argentine Pampas. Water Resources Research, v. 41, p. W10409, 2005.
- JOBBÁGY, E.; JACKSON, R. B. Groundwater use and salinization with grassland afforestation. Global Change Biology, v. 10, p. 1299-1312, 2004.
- JOBBÁGY, E.; JACKSON, R.B. Groundwater and soil chemical changes under phreatophytic tree plantations. Journal of Geophysical Research, v. 112, g02013, 2007.
- JOBBÁGY, E.; NOSETTO, M.; SANTONI, C.; BALDI, G. El desafío ecohidrológico de las transiciones entre sistemas leñosos y herbáceos en la llanura Chaco-Pampeana. Ecología Austral, v. 18, p. 305-322, 2008.
- MILIONE, G; MUJICA, C.; BEA, S.A.; DOMINGUEZ DAGUER, D.; GYENGE, J. Forestación en pastizales: el rol de las especies y el manejo forestal sobre el proceso de salinización secundaria de suelos. Revista de Investigaciones Agropecuarias INTA. Available at; Available at; http://ria.inta.gob.ar/ sites/default/files/trabajosenprensa/milione-castellano-4. pdf Accessed in: June 16th 2020.
» http://ria.inta.gob.ar/ sites/default/files/trabajosenprensa/milione-castellano-4. pdf - MORRIS, J.D.; COLLOPY, J.J. Water use and salt accumulation by Eucalyptus camaldulensis and Casuarina cunninghamiana on a site with shallow saline groundwater. Agricultural Water Management, v. 39, p. 205-227, 1999.
- MUJICA, C.; MILIONE, G.; BEA, S.A.; GYENGE, J. A process-based numerical approach to estimate forest groundwater consumption in flatland petrocalcic soils. Journal of Hydroinformatics, v. 11, p. 1130-1146, 2019.
- NOSETTO, M.; JOBBÁGY, E.; TÓTH, T.; JACKSON, R. Regional patterns and controls of ecosystem salinization with grassland afforestation along a rainfall gradient. Global Biogechemical Cycles, v. 22, p. GB2015, 2008.
- NOSETTO, M.; ACOSTA, A.M.; JAYAWICKREME, D.H.; BALLESTEROS, S.I.; JACKSON, R.; JOBBÁGY, E.G. Land-use and topography shape soil and groundwater salinity in central Argentina. Agricultural Water Management , v. 129, p. 120-129, 2013.
- PARUELO, J. M.; JOBBÁGY, E.; OESTERHELD, M.; GOLLUSCIO, R.A.; AGUIAR, M.R. Grasslands and steppes of Patagonia and the Río de la Plata plains. In: VEBLEN, T.T.; YOUNG, K.R.; ORME, A.R. The physical geography of South America, 2007. p. 232-248.
- PERALTA, N.R.; COSTA, J.L.; BALZARINI, M.; ANGELINI, H. Delineation of management zones with measurements of soil apparent electrical conductivity in the southeastern pampas. Canadian Journal of Soil Science, v. 93, p. 205-218, 2013.
- TÓTH, T.; BALOG, K.; SZABÓ, A.; PÁSZTOR, L.; JOBBÁGY, E.; NOSETTO, M.; GRIBOVSZKI, Z. Influence of lowland forests on subsurface salt accumulation in shallow groundwater areas. AoB Plants, v. 6, plu054, 2014.
- VIGLIZZO, E.F.; NOSETTO, M.D.; JOBBÁGY, E.G.; RICARD, M.F.; FRANK, F.C. The ecohydrology of ecosystem transitions: a meta-analysis. Ecohydrology, v. 8, p. 911-921, 2015.
- WEIL, R.R.; BRADY, N.C. The nature and properties of soils. Pearson Education, Inc. 2017. 1071p.
- ZHANG, L.; DAWES, W.R.; WALKER, G.R. Response of mean annual evapotranspiration to vegetation changes at catchment scale. Water Resources Research , v. 37, p. 701-708, 2001.
- ZHAO, X.; XU, H.; ZHANG, P.; FU, J.; BAI, Y. Soil water, salt, and groundwater characteristics in shelterbelts with no irrigation for several years in an extremely arid area. Environmental Monitoring Assessment, v. 185, p. 10091-10100, 2013.
HIGHLIGHTS
-
1
The effect of Eucalyptus afforestation on soil electrical conductivity (EC) was studied in grassland soils.
-
2
EC increased in forested plots compared to grasslands or herbaceous crops only in finetextured soils and when the forest was not managed (old abandoned plantations).
-
3
Secondary salinization was not linked to site water balance.
-
4
Proper silvicultural management, particularly regular thinning, could decrease salt accumulation in soils.
Publication Dates
-
Publication in this collection
30 Sept 2020 -
Date of issue
Apr-Jun 2020
History
-
Received
06 Dec 2019 -
Accepted
19 June 2020


