ABSTRACT
Spatial variability evaluation of qualitative attributes can be used as an excellent strategy to design forms of intervention that result in better crop profitability for some agricultural crops, for example, sugarcane. Based on the assumption that qualitative attributes of sugarcane present spatial variability and their distributions along the stems are uniform in different varieties, this study aimed to evaluate the distributions of the qualitative parameters of different sugarcane varieties and the spatial variability of these attributes in a commercial field. Samples of nine varieties were collected for laboratory quality analysis, and the Brix parameter was analyzed by a digital refractometer. The analysis of variance, the Tukey test, and geoestatistcs were the statistical analyses applied to the dataset. The maps were generated using 91 sample results from the laboratory analysis of the 16.6 ha field. It was found that, in the harvest period, there was no significant difference in Brix content along the sugarcane stems. Therefore, we can conclude that the Brix content along the sugarcane stems does not change in the harvesting period, and the ideal sampling size to better represent the factors affecting sugarcane qualitative attributes is six points per hectare.
KEYWORDS
saccharose; technological quality; geostatistic
INTRODUCTION
Yield maps can be considered one of the most useful tools for characterizing crop variability, which is extremely important in enhancing management initiatives seeking to understand crop spatial variability through precision agriculture (PA) practices (Sanches et al., 2019Sanches GM, Magalhães PSG, Franco HCJ (2019) Site- specific assessment of spatial and temporal variability of sugarcane yield related to soil attributes. Geoderma 334:90-98. DOI: https://doi.org/10.1016/j.geoderma.2018.07.051.
https://doi.org/10.1016/j.geoderma.2018....
).
The sugarcane agroindustry is one of the agricultural sectors that has been developing more PA technique applications to achieve higher yields and improve product quality (Driemeier et al., 2016Driemeier C, Ling LY, Sanches GM, Pontes AO, Magalhães PSG, Ferreira JE (2016) A computational environment to support research in sugarcane agriculture. Computers and Electronics in Agriculture 130:13-19. DOI: http://dx.doi.org/10.1016/j.compag.2016.10.002
http://dx.doi.org/10.1016/j.compag.2016....
; Bramley et al., 2018Bramley RGV, Ouzman J, Gobbett DL (2018) Regional scale application of the precision agriculture thought process to promote improved fertilizer management in the Australian sugar industry. Precision Agriculture 20:362-378. DOI: https://doi.org/10.1007/s11119-018-9571-8
https://doi.org/10.1007/s11119-018-9571-...
). Yield mapping related to qualitative attributes could provide significant information that could improve crop variability management and profitability per area (Nawi et al., 2014Nawi NM, Chen G, Jensen T (2014) In-field measurement and sampling technologies for monitoring quality in the sugarcane industry: a review. Precision Agriculture 15(6):684-703. DOI: https://doi.org/10.1007/s11119-014-9362-9.
https://doi.org/10.1007/s11119-014-9362-...
). However, PA activities have focused on optimizing yield without considering the impacts that decisions may have on product quality.
Marques Júnior et al. (2014)Marques Júnior J, Siqueira DS, Camargo LA, Teixeira DDB, Barrón V, Torrent J (2014) Magnetic susceptibility and diffuse reflectance spectroscopy to characterize the spatial variability of soil properties in a Brazilian Haplustalf. Geoderma 219:63-71. DOI: http://dx.doi.org/10.1016/j.geoderma.2013.12.007
http://dx.doi.org/10.1016/j.geoderma.201...
analyzed the potential use of magnetic susceptibility (MS) and diffuse reflectance spectroscopy to characterize not only the spatial variability of chemical and physical soil attributes, but also sugarcane areas with different yields and quality potentials. Their results justified the use of these tools to identify zones with different crop quality product potentials. However, to advance the use of PA techniques to manage the cause and effect relationships, sugarcane quality yield mapping could become the main tool for characterizing their inherent variability to support specific management practices. Specific management practices in areas where quality parameters are below desired standards can be used to distinguish crop products by quality, thereby improving crop profitability (Marques Júnior et al., 2014Marques Júnior J, Siqueira DS, Camargo LA, Teixeira DDB, Barrón V, Torrent J (2014) Magnetic susceptibility and diffuse reflectance spectroscopy to characterize the spatial variability of soil properties in a Brazilian Haplustalf. Geoderma 219:63-71. DOI: http://dx.doi.org/10.1016/j.geoderma.2013.12.007
http://dx.doi.org/10.1016/j.geoderma.201...
; Mahmood & Murdoch, 2017Mahmood SA, Murdoch AJ (2017) Within-field variations in sugar beet yield and quality and their correlation with environmental variables in the East of England. European Journal of Agronomy 89:75-87. DOI: http://dx.doi.org/10.1016/j.eja.2017.05.007
http://dx.doi.org/10.1016/j.eja.2017.05....
).
It is necessary to understand the spatial variability behavior of the studied attributes to improve sampling effectiveness (Cherubin et al., 2015Cherubin MR, Santi AL, Eitelwein MT, Amado TJC, Simon DH, Damian JM (2015) Dimensão da malha amostral para caracterização da variabilidade espacial de fósforo e potássio em Latossolo Vermelho. Pesquisa Agropecuária Brasileira 50(2):168-17. DOI: https://doi.org/10.1590/S0100-204X2015000200009
https://doi.org/10.1590/S0100-204X201500...
). However, studies that aim to map sugarcane phenological spatial variability while considering qualitative attributes that are used to calculate the payment to suppliers in Brazil and the best samplings methods are incipient.
Qualitative and quantitative sugarcane data obtained during the harvest period can be supplied to PA as an invaluable tool at the management perspective of the existing spatial variability, in addition to potentially improving the industrial process and economic planning. In this sense, the objectives of this study are as follows: i) evaluate the distribution of the concentration of soluble solids (Brix) along sugarcane stems to identify the best sampling method for the spatial characterization of the crop during the harvest period and ii) explore the spatial distribution behavior of the following technological attributes: Brix, sugarcane Pol (PC), purity (Qpur), fibers (F), sugarcane reducing sugars (ARCs), and total recoverable sugar (ATR).
MATERIAL AND METHODS
In the first phase of the study, the distribution pattern of the concentrations of soluble solids along the stems and between sugarcane plants was evaluated. This phase was conducted in the city of Piracicaba, Sao Paulo, Brazil, in areas that belong to a sugar mill (Figure 1a). The samples were collected in the harvest period from nine areas in which different sugarcane varieties had been planted and the harvest stages and ages of the varieties were different. Additionally, data on the last harvest period, production environment, and application of vinasse were collected (Table 1).
(a) Example of the sampling stage of ratoons (P) in each area (V) and (b) sampling stem portions (S) used to Brix analysis and quality laboratory tests (Adapted from Sanseechan et al., 2018Sanseechan NP, Panduangnate L, Saengprachatanarug K, Wongpichet S, Taira E, Posom J (2018) A portable near infrared spectrometer as a non-destructive tool for rapid screening of solid density stalk in a sugarcane breeding program. Sensing and Bio-Sensing Research 20:34-40. DOI: https://doi.org/10.1016/j.sbsr.2018.07.001.
https://doi.org/10.1016/j.sbsr.2018.07.0... ).
The experiment was conducted in a completely randomized design with three ratoons samples (P) per area (V). Each ratoon had four stems. Therefore, 27 ratoons with four stems each were collected in this experimental phase. These stems were cut into three portions identified as lower (S1), middle (S2), and upper (S3) portions (Figure 1b).
The analysis of the first phase of this study was carried out with soluble solids concentration (Brix) as the response variable. The plant maturation index (MI) was calculated from Brix value (Equation 1) by the same equation used by Cunha et al. (2017)Cunha CP, Roberto GG, Vicentini R, Lembke CG, Souza GM, Ribeiro RV, Machado EC, Lagôa AMMA, Menossi M (2017) Ethylene-induced transcriptional and hormonal responses at the onset of sugarcane ripening. Scientific Reports 7:43364. DOI: https://doi.org/10.1038/srep43364
https://doi.org/10.1038/srep43364...
. This index was used to classify plants according to their maturation stages on which can be classified as: a) immature sugarcane (MI lower than 0.60), b) sugarcane in process of maturation (MI between 0.60 and 0.85), c) mature sugarcane (MI between 0.85 and 1.00), and d) sugarcane exhibiting a decline in saccharose (MI higher than 1.00).
The sugarcane broth from each stem was extracted using a manual sampler. Subsequently, it was submitted for Brix analysis with a digital pocket refractometer (Atago Co., Ltd, Tokyo, Japan). The statistical evaluation in this phase was carried out with the analysis of variance (ANOVA) followed by a Tukey test at a 5% level of significance.
The second phase of this study aimed to analyze the spatial distribution behavior of the technological attributes of sugarcane in a commercial field. This experimental phase was conducted on a 16.6 ha located in a production environment classified as “A”, on which RB855453 had been planted, an early cycle sugarcane variety. The harvest was made on 06/27/2014 with the plants in their third harvest stage. A total of 91 samples were obtained from the area, resulting in about 5.4 samples ha-1 (Figure 2). The methodology used to obtain the georeferenced samples was defined based on the results of the previous phase.
The plant samples were disintegrated and homogenized using a mechanical disintegrator. Then, a subsample of 500 g was taken from each disintegrated sample and homogenized. The broth of each sample was extracted using a hydraulic press set with a constant pressure of 24.5 MPa (250 kgf cm-2) for 60 s. After that, a Brix analysis was performed using a refractometer. The sample was then clarified and submitted for a saccharimetric reading. The fibers were weighted. After these evaluations, the technological attributes were obtained according to the CONSECANA Instructions Guide (2006)CONSECANA - National Council of Sugarcane Producers of Sao Paulo State (2006) Instruction Manual. CONSECANA, 200p..
The laboratory results of the evaluated technological attributes (Brix, PC, Qpur, ARC, F and ATR) were individually interpolated using ordinary kriging with Vesper (Minasny et al., 2005Minasny B, McBratney AB, Whelan BM (2005) VESPER version 1.62. Australian Centre for Precision Agriculture, McMillan Building A05, The University of Sydney, NSW 2006. Available: http://sydney.edu.au/agriculture/pal/software/vesper.shtmL Accessed: Nov 20, 2017.
http://sydney.edu.au/agriculture/pal/sof...
) to generate maps of each attribute. Semivariograms for each attribute were used to obtain the values of the range, sill, nugget, and root mean square error (RMSE). In addition, the determination coefficient, Pearson correlation coefficient of the technological attributes, and the minimum number of samples needed to reliably represent each technological attribute through [eq. (2)] were calculated.
RESULTS AND DISCUSSION
The ANOVA results relative to the samples collected in the nine areas selected for the first phase of the experiment presented a significant effect for the Brix results as functions of the factors plant, variety, and their interaction at a 5 % of significance. Furthermore, the results reveal that the stem portions did not present a p-value lower than 0.05, indicating that all the portions (lower, middle, upper) from the harvest period but from different varieties grown under different production environments presented similar Brix values (Table 2).
Analysis of variance in sugarcane Brix, in degrees, as a function of stem portion, plants, and area.
The Brix values along sugarcane stem in the harvest period for the studied conditions were not statistically different between portions (P ≤ 0.05), corroborating with their respective classifications of being mature or exhibiting a decline in saccharose. This finding indicates that the Brix values at the upper and lower portions were similar (Table 3).
Average Brix results for the stem portions of different sugarcane varieties and their maturation classification.
After the ANOVA results were obtained, the normality test of Shapiro-Wilk was conducted. The test results revealed the residues had a normal distribution at a 5% significance. As this study prioritized the analysis between plants in the same area and stem portions of a same plant, a Tukey test at a 5% probability was conducted only for these factors (Table 3).
Under the studied conditions, the differences in the Brix results between plants in most of the areas were statistically significant (P ≤ 0.05). This result indicates that there is a variability in Brix content within a field containing plants of the same variety. Other studies also identified a Brix content variability in different sugarcane plants (Sanseechan et al., 2018Sanseechan NP, Panduangnate L, Saengprachatanarug K, Wongpichet S, Taira E, Posom J (2018) A portable near infrared spectrometer as a non-destructive tool for rapid screening of solid density stalk in a sugarcane breeding program. Sensing and Bio-Sensing Research 20:34-40. DOI: https://doi.org/10.1016/j.sbsr.2018.07.001.
https://doi.org/10.1016/j.sbsr.2018.07.0...
; Phuphaphud et al., 2019Phuphaphud A, Saengprachatanarug K, Posom J, Maraphum K, Taira E (2019) Prediction of the fibre content of sugarcane stalk by direct scanning using visible-shortwave near infrared spectroscopy. Vibrational Spectroscopy 101:71-80. DOI: https://doi.org/10.1016/j.vibspec.2019.02.005.
https://doi.org/10.1016/j.vibspec.2019.0...
).
The spatial variability of crops qualitative attributes, although of the same variety, may be due to several environmental factors such climate (Mahmood & Murdoch, 2017Mahmood SA, Murdoch AJ (2017) Within-field variations in sugar beet yield and quality and their correlation with environmental variables in the East of England. European Journal of Agronomy 89:75-87. DOI: http://dx.doi.org/10.1016/j.eja.2017.05.007
http://dx.doi.org/10.1016/j.eja.2017.05....
), variability in spatial edaphic attributes (Rodrigues Júnior et al., 2013Rodrigues Júnior FA, Magalhães PSG, Franco HCJ (2013) Soil attributes and leaf nitrogen estimating sugar cane quality parameters: Brix, pol and fibre. Precision Agriculture 14(3):270-289. DOI: http://dx.doi.org/10.1007/s11119-012-9294-1.
http://dx.doi.org/10.1007/s11119-012-929...
; Baluja et al., 2013Baluja J, Tardaguila J, Ayestaran B, Diago MP (2013) Spatial variability of grape composition in a Tempranillo (Vitis vinifera L.) vineyard over a 3-year survey. Precision Agriculture 14(1):40-58. DOI: https://doi.org/10.1007/s11119-012-9282-5
https://doi.org/10.1007/s11119-012-9282-...
), and the plants' phenological characteristics. The effect of these associated factors, reflected under the quality and yield crop, justify the importance to the understanding the variability among crop attributes that have higher values.
Based on the results of the first study, which revealed that significant differences did not exist among stem portions on the same plant in the harvest period, a second study was conducted with samples of the entire stem, which were used to generate the spatialization of the ATR based on stem mass. Table 4 shows the descriptive statistics of the 91 sampling points of sugarcane RB855453 variety.
From Table 4, it can be noticed that the coefficients of variation of all the technological attributes are lower or similar to those found by Johnson & Richard Júnior (2005)Johnson RM, Richard Júnior EP (2005) Sugarcane yield, sugarcane quality, and soil variability in Louisiana. Agronomy Journal 97:760-771. DOI: https://doi.org/10.2134/agronj2004.0184
https://doi.org/10.2134/agronj2004.0184...
, who performed a yield spatial variability evaluation study of the qualitative attributes of soil and sugarcane over three years in two different locations.
After geostatiscal analysis of the attributes, it was observed that fiber content was the attribute that presented the lowest range of values (Table 5), possibly because it has small influence on sugar content (Table 6). The range of values found in this study was similar to those found by Johnson & Richard Júnior (2005)Johnson RM, Richard Júnior EP (2005) Sugarcane yield, sugarcane quality, and soil variability in Louisiana. Agronomy Journal 97:760-771. DOI: https://doi.org/10.2134/agronj2004.0184
https://doi.org/10.2134/agronj2004.0184...
in the first year of their study. In their case, they found that fiber content (52.2 m) and Pol (124.3 m) had the lowest and highest range of values, respectively.
Semivariogram components obtained from interpolation of the technological attributes of sugarcane RB855453 variety.
Correlation matrix between the analyzed technological attributes from georeferenced samples of sugarcane RB855453 variety.
Sugarcane soluble solids concentrations (Brix) exhibited higher spatial dependence and the lowest range compared to the other attributes. This attribute and Pol exhibited high correlations with sugar content (Table 6). However, it is noted that Pol has a more direct relation to ATR than to Brix owing to the influence of reducing sugars in this attribute. The ATR exhibited a high variation as shown by the high nugget value. It can also be noticed that the adjusted model quality estimated by the determination coefficient (R2) was satisfactory for Brix, Pol, and the ATR, the major qualitative attributes evaluated in sugarcane crops.
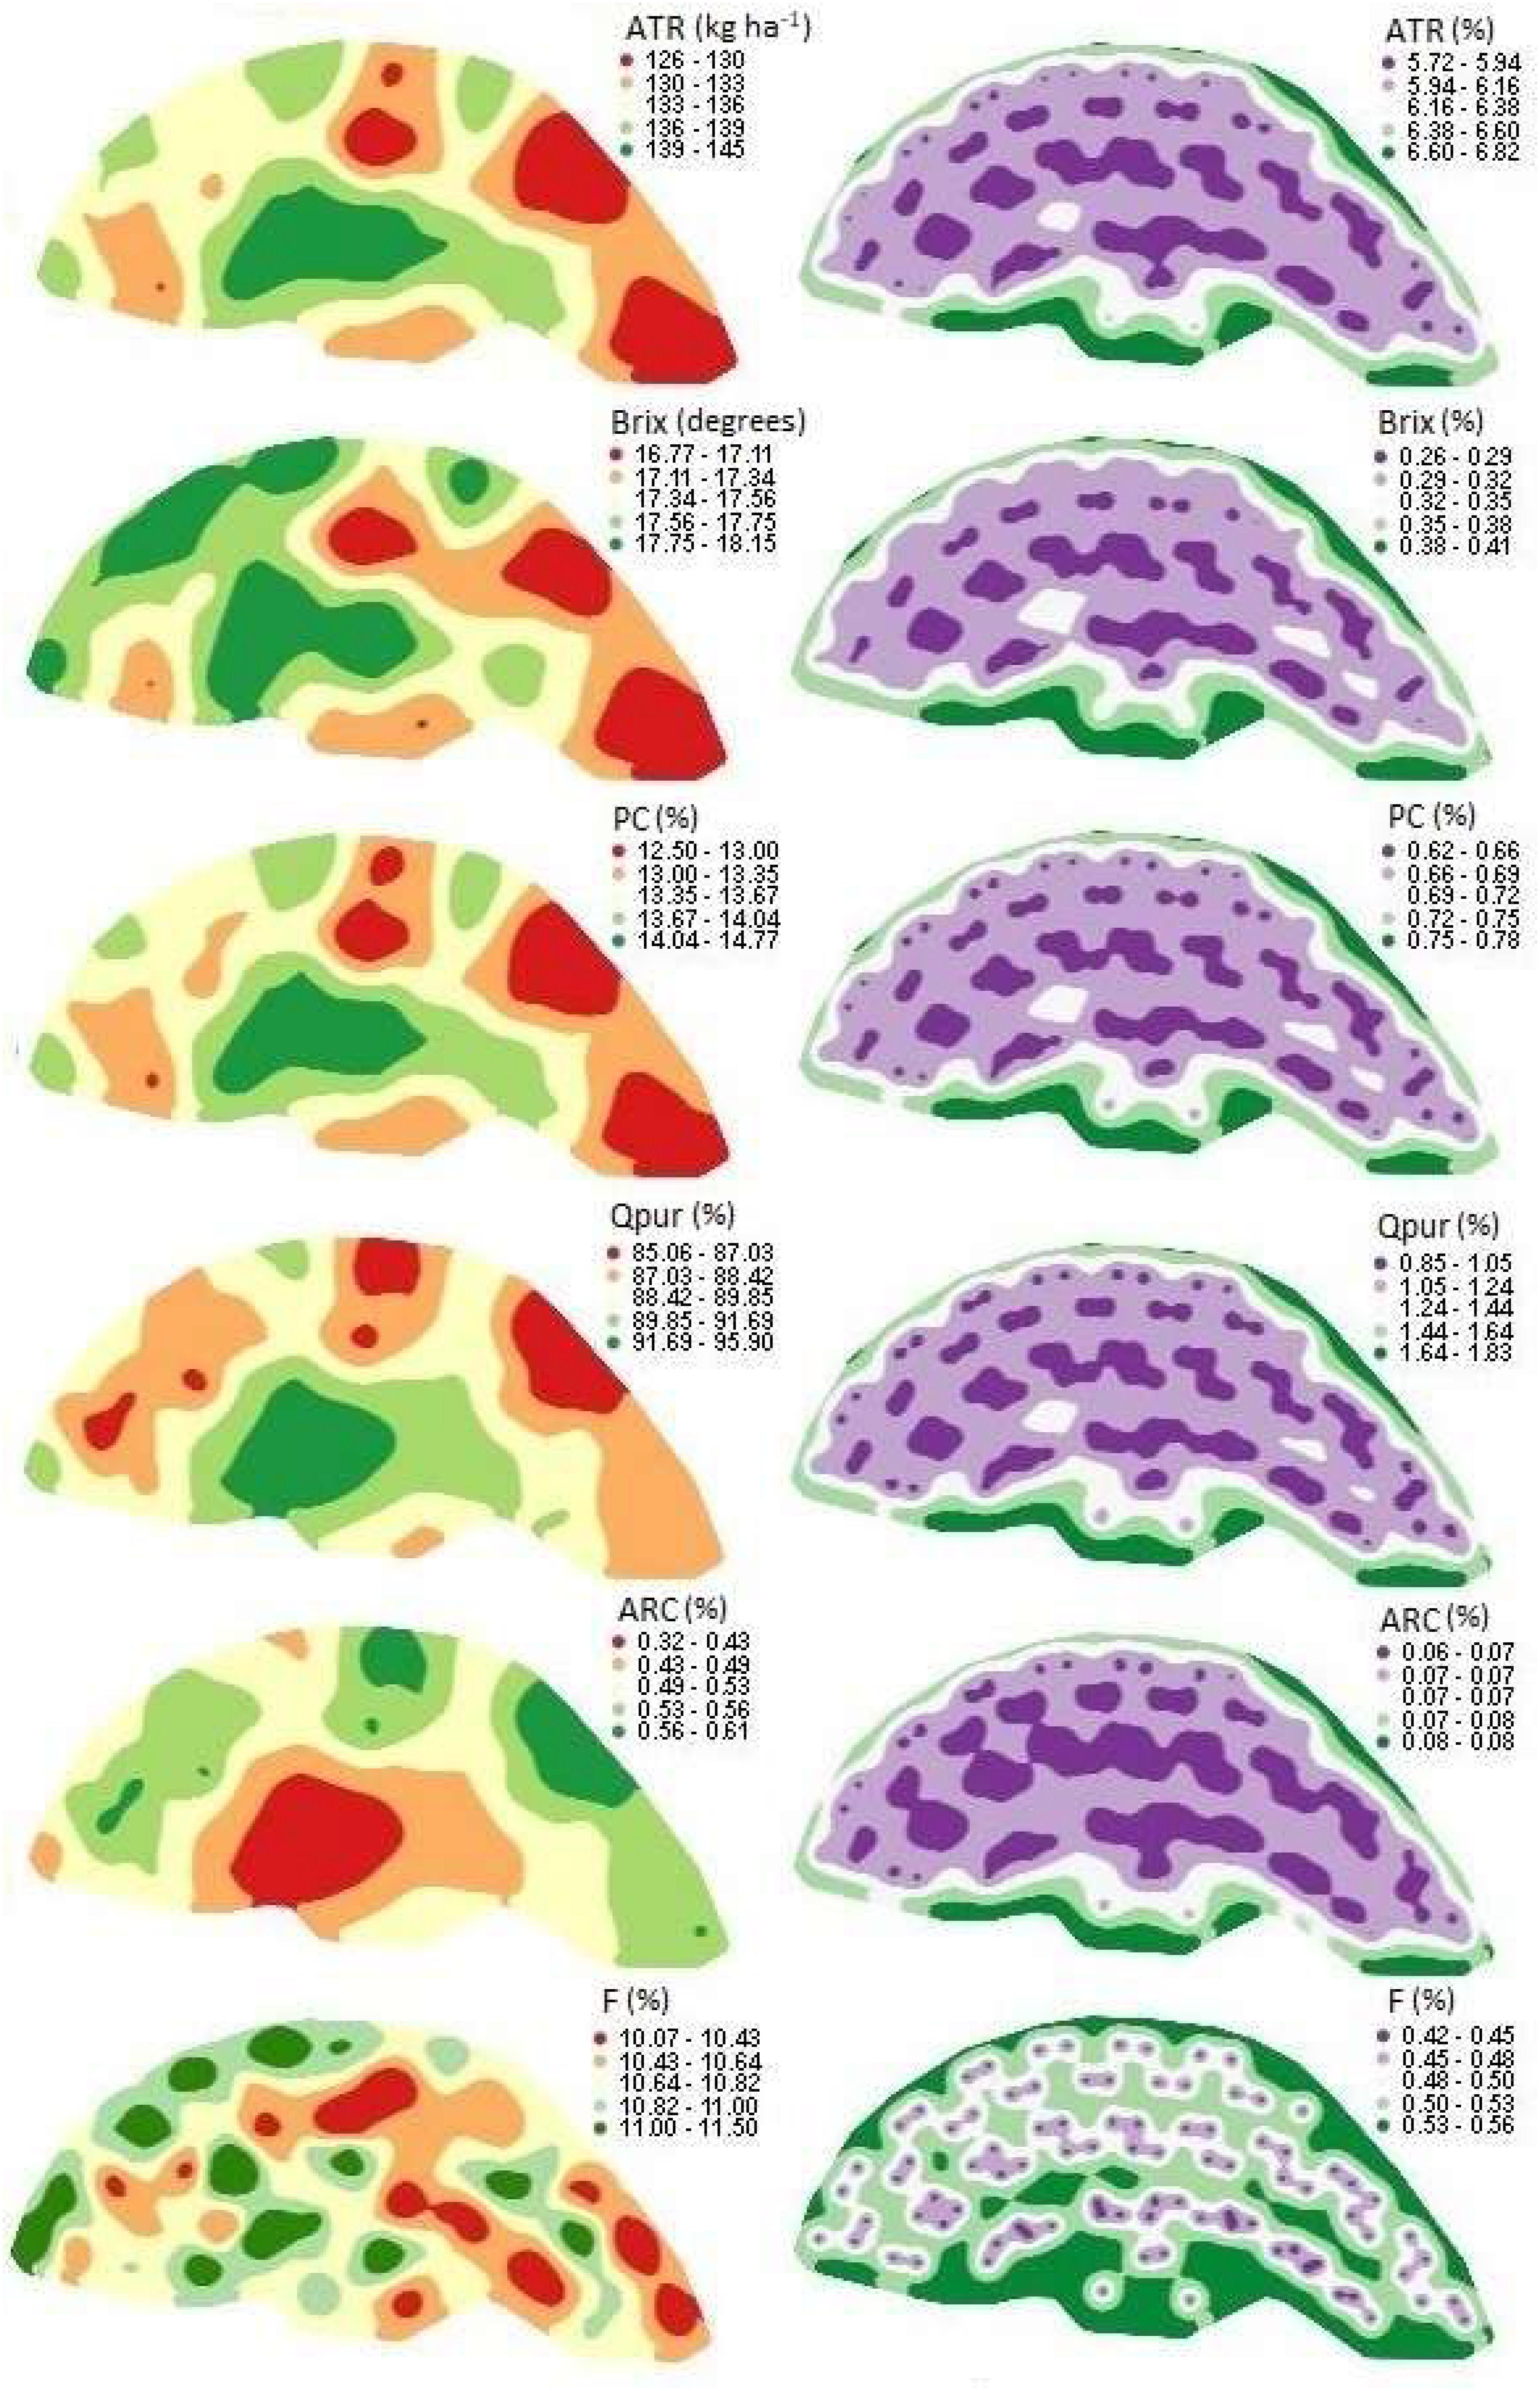
The maps show that Pol was more efficient than Brix in indicating the ATR in the area (Figure 3). Some areas in the map where the Brix is high presented the purity is low, resulting in an average ATR, for example. This indicates that Pol plays an important role in the determination of crop quality.
Map of the analyzed technological attributes (left column) and spatial predicted errors (right column). PC: sugarcane pol; Qpur: purity; ARC: sugarcane reducing sugar; F: fiber content; ATR: total recoverable sugar.
Technological attributes maps give a better understanding of the specific management practices needed in areas with potential that is below the desired level. In this study, regions on the map represented by intense red are areas where the ATR ranges between 126 and 130 kg ha-1. In these areas, it is possible to perform guided sampling to understand the possible factors that may have led to these results, which information could consequently support decision making related to agricultural management practices. These decisions could be in regard to interventions that improve these values or management actions that consider the observed differences. Furthermore, guided sampling in regions with higher potential, which are presented by green and have an ATR that varies from 139 to 149 kg ha-1, can enhance management practices, benefiting plants by improving their capacity to store sugar.
The fiber content map did not present visual relation with other maps. Therefore, fiber content, in this study, can be considered as a limiting attribute to the spatial dependence analysis of the qualitative parameters of the culture due to its lower range (59.1 m) as shown by the semivariogram (Figure 4). In this study, the minimum number of samples needed to represent sugarcane technological attributes varies from 1 to 12 points per ha (Figure 5). In the case of the Brix values, the value of six samples per ha was higher than that found by Varella et al. (2012)Varella CAA, Barros VR, Baesso MM (2012) Mapeamento da variabilidade Espacial do Brix em cana-de-Açúcar. Engenharia na agricultura 20(2):112-117..
Semivariograms of the evaluated technological attributes. PC: sugarcane pol; Qpur: purity; ARC: sugarcane reducing sugar; F: fiber content; ATR: total recoverable sugar.
Minimum sampling number per hectare to represent sugarcane technological attributes. PC: sugarcane pol; Qpur: purity; ARC: sugarcane reducing sugar; F: fiber content; ATR: total recoverable sugar.
Therefore, to evaluate the spatial qualitative attributes of sugarcane, it is worth considering the distributions of all the qualitative attributes, except the fiber content.
Based on the spatial variability of the qualitative attributes of sugarcane, the most efficient method for sampling, and the heterogeneity in plants of the same variety within the field, it is important to develop models capable of describing these attributes' behaviors in the field to better understand the cause and effect relation between soil and plant (Rodrigues Júnior et al., 2013Rodrigues Júnior FA, Magalhães PSG, Franco HCJ (2013) Soil attributes and leaf nitrogen estimating sugar cane quality parameters: Brix, pol and fibre. Precision Agriculture 14(3):270-289. DOI: http://dx.doi.org/10.1007/s11119-012-9294-1.
http://dx.doi.org/10.1007/s11119-012-929...
), which would support decision making in site specific management.
Thus, it is evident that there is a need for detailed studies on the variability of sugarcane qualitative attributes along the stem of different varieties to define strategies to reduce sampling points, but at the same time being significantly representative regarding the predictions of these attributes.
The maps of the spatial standard errors are visually similar, with most maps being characterized by lower values, except for the fiber content maps. A study of the spatial structure variation could have better guided the sampling conducted to evaluate quality mainly to improve fiber content characterization similar to Rodrigues Júnior et al. (2013)Rodrigues Júnior FA, Magalhães PSG, Franco HCJ (2013) Soil attributes and leaf nitrogen estimating sugar cane quality parameters: Brix, pol and fibre. Precision Agriculture 14(3):270-289. DOI: http://dx.doi.org/10.1007/s11119-012-9294-1.
http://dx.doi.org/10.1007/s11119-012-929...
observations. Therefore, it is recommended future works with more study years including a temporal variability evaluation and a refined grid sampling for the technological attributes.
CONCLUSIONS
No significant differences were observed in Brix values between the lower, middle, and upper sugarcane stem portions in the harvest period in which the samples were classified as mature or exhibiting a decline in saccharose. To represent the crop qualitative potential, an analysis of samples from the entire stem must be conducted. This is because, in the harvest period, the sections of the stem did not present significant differences in Brix content.
The technological attributes presented high spatial dependences, with the Brix and fiber content exhibiting the highest and lowest values, respectively. Furthermore, the semivariograms suggest that six samples per hectare should be sufficient for efficient sugarcane qualitative mapping, if fiber content is disregarded.
ACKNOWLEDGMENTS
The authors received support from the State of São Paulo Research Foundation (FAPESP), the National Research Council (CNPq), Coordination of Improvement of Higher Level Personnel (CAPES).
REFERENCES
- Baluja J, Tardaguila J, Ayestaran B, Diago MP (2013) Spatial variability of grape composition in a Tempranillo (Vitis vinifera L.) vineyard over a 3-year survey. Precision Agriculture 14(1):40-58. DOI: https://doi.org/10.1007/s11119-012-9282-5
» https://doi.org/10.1007/s11119-012-9282-5 - Bramley RGV, Ouzman J, Gobbett DL (2018) Regional scale application of the precision agriculture thought process to promote improved fertilizer management in the Australian sugar industry. Precision Agriculture 20:362-378. DOI: https://doi.org/10.1007/s11119-018-9571-8
» https://doi.org/10.1007/s11119-018-9571-8 - Cherubin MR, Santi AL, Eitelwein MT, Amado TJC, Simon DH, Damian JM (2015) Dimensão da malha amostral para caracterização da variabilidade espacial de fósforo e potássio em Latossolo Vermelho. Pesquisa Agropecuária Brasileira 50(2):168-17. DOI: https://doi.org/10.1590/S0100-204X2015000200009
» https://doi.org/10.1590/S0100-204X2015000200009 - Cunha CP, Roberto GG, Vicentini R, Lembke CG, Souza GM, Ribeiro RV, Machado EC, Lagôa AMMA, Menossi M (2017) Ethylene-induced transcriptional and hormonal responses at the onset of sugarcane ripening. Scientific Reports 7:43364. DOI: https://doi.org/10.1038/srep43364
» https://doi.org/10.1038/srep43364 - Driemeier C, Ling LY, Sanches GM, Pontes AO, Magalhães PSG, Ferreira JE (2016) A computational environment to support research in sugarcane agriculture. Computers and Electronics in Agriculture 130:13-19. DOI: http://dx.doi.org/10.1016/j.compag.2016.10.002
» http://dx.doi.org/10.1016/j.compag.2016.10.002 - CONSECANA - National Council of Sugarcane Producers of Sao Paulo State (2006) Instruction Manual. CONSECANA, 200p.
- Johnson RM, Richard Júnior EP (2005) Sugarcane yield, sugarcane quality, and soil variability in Louisiana. Agronomy Journal 97:760-771. DOI: https://doi.org/10.2134/agronj2004.0184
» https://doi.org/10.2134/agronj2004.0184 - Mahmood SA, Murdoch AJ (2017) Within-field variations in sugar beet yield and quality and their correlation with environmental variables in the East of England. European Journal of Agronomy 89:75-87. DOI: http://dx.doi.org/10.1016/j.eja.2017.05.007
» http://dx.doi.org/10.1016/j.eja.2017.05.007 - Marques Júnior J, Siqueira DS, Camargo LA, Teixeira DDB, Barrón V, Torrent J (2014) Magnetic susceptibility and diffuse reflectance spectroscopy to characterize the spatial variability of soil properties in a Brazilian Haplustalf. Geoderma 219:63-71. DOI: http://dx.doi.org/10.1016/j.geoderma.2013.12.007
» http://dx.doi.org/10.1016/j.geoderma.2013.12.007 - Minasny B, McBratney AB, Whelan BM (2005) VESPER version 1.62. Australian Centre for Precision Agriculture, McMillan Building A05, The University of Sydney, NSW 2006. Available: http://sydney.edu.au/agriculture/pal/software/vesper.shtmL Accessed: Nov 20, 2017.
» http://sydney.edu.au/agriculture/pal/software/vesper.shtmL - Nawi NM, Chen G, Jensen T (2014) In-field measurement and sampling technologies for monitoring quality in the sugarcane industry: a review. Precision Agriculture 15(6):684-703. DOI: https://doi.org/10.1007/s11119-014-9362-9
» https://doi.org/10.1007/s11119-014-9362-9 - Phuphaphud A, Saengprachatanarug K, Posom J, Maraphum K, Taira E (2019) Prediction of the fibre content of sugarcane stalk by direct scanning using visible-shortwave near infrared spectroscopy. Vibrational Spectroscopy 101:71-80. DOI: https://doi.org/10.1016/j.vibspec.2019.02.005
» https://doi.org/10.1016/j.vibspec.2019.02.005 - Rodrigues Júnior FA, Magalhães PSG, Franco HCJ (2013) Soil attributes and leaf nitrogen estimating sugar cane quality parameters: Brix, pol and fibre. Precision Agriculture 14(3):270-289. DOI: http://dx.doi.org/10.1007/s11119-012-9294-1
» http://dx.doi.org/10.1007/s11119-012-9294-1 - Sanches GM, Magalhães PSG, Franco HCJ (2019) Site- specific assessment of spatial and temporal variability of sugarcane yield related to soil attributes. Geoderma 334:90-98. DOI: https://doi.org/10.1016/j.geoderma.2018.07.051
» https://doi.org/10.1016/j.geoderma.2018.07.051 - Sanseechan NP, Panduangnate L, Saengprachatanarug K, Wongpichet S, Taira E, Posom J (2018) A portable near infrared spectrometer as a non-destructive tool for rapid screening of solid density stalk in a sugarcane breeding program. Sensing and Bio-Sensing Research 20:34-40. DOI: https://doi.org/10.1016/j.sbsr.2018.07.001
» https://doi.org/10.1016/j.sbsr.2018.07.001 - Varella CAA, Barros VR, Baesso MM (2012) Mapeamento da variabilidade Espacial do Brix em cana-de-Açúcar. Engenharia na agricultura 20(2):112-117.
Edited by
Publication Dates
-
Publication in this collection
09 Sept 2019 -
Date of issue
Sept 2019
History
-
Received
07 Jan 2019 -
Accepted
19 June 2019