
Abstracts
In this work the theoretical study of the gas-phase bimolecular nucleophilic substitution reaction, CH3Cl + OH-→ CH3OH + Cl-, is introduced aiming the description of the reaction path and the calculation of rate coefficients with the canonical variational transition state (CVTST) method. The calculations were performed at the MP2/6-31+G(d) level. The calculated enthalpy difference for the reaction at 298.15 K (-49.93 kcal mol-1) is in good agreement with the literature value: -50.4 kcal mol-1. The calculated rate coefficient, 1.94 × 10⁻⁹ cm³ molecule-1 s-1 at 298.15 K, also shows good agreement with the experimental data: 1.3-1.6 × 10⁻⁹ cm³ molecule-1 s-1. Moreover, the rate coefficients show non-Arrhenius behavior, decreasing as the temperature increases, which is consistent with the experimental expectation. In this way, the performance of the variational transition state theory for this reaction can be considered satisfactory.
S N2; CH3Cl + OH-; CVTST; non-Arrhenius behavior
Neste trabalho, o estudo teórico da reação de substituição nucleofílica de segunda ordem em fase gasosa, CH3Cl + OH-→ CH3OH + Cl-, é apresentado visando a descrição do caminho de reação e o cálculo de coeficientes de velocidade pelo método do estado de transição variacional canônico (CVTST). Cálculos teóricos foram conduzidos em nível MP2/6-31+G(d). A diferença de entalpia calculada para esta reação a 298,15 K (-49,93 kcal mol-1) está em bom acordo com o dado da literatura: -50,4 kcal mol-1. O coeficiente de velocidade calculado a 298,15 K, 1,94 × 10⁻⁹ cm³ molécula-1 s-1, também apresenta bom acordo com o dado experimental: 1,3-1,6 × 10⁻⁹ cm³ molécula-1 s-1. Além disso, os coeficientes de velocidade mostram comportamento não-Arrhenius, diminuindo com o aumento da temperatura, o que é consistente com a tendência experimental. Neste aspecto, a atuação da teoria de estado de transição variacional para essa reação deve ser considerada satisfatória.
ARTICLE
Ab initio and CVTST investigation of the gas phase nucleophilic substitution CH3Cl + OH→ CH3OH + Cl
Ana C. B. de Souza; Glauco F. Bauerfeldt* * e-mail: bauerfeldt@ufrrj.br
Departamento de Química, Universidade Federal Rural do Rio de Janeiro, Rodovia Br 465, Km 7, 23890-000 Seropédica-RJ, Brazil
ABSTRACT
In this work the theoretical study of the gas-phase bimolecular nucleophilic substitution reaction, CH3Cl + OH→ CH3OH + Cl, is introduced aiming the description of the reaction path and the calculation of rate coefficients with the canonical variational transition state (CVTST) method. The calculations were performed at the MP2/6-31+G(d) level. The calculated enthalpy difference for the reaction at 298.15 K (49.93 kcal mol-1) is in good agreement with the literature value: 50.4 kcal mol-1. The calculated rate coefficient, 1.94 × 109 cm3 molecule-1 s-1 at 298.15 K, also shows good agreement with the experimental data: 1.3-1.6 × 109 cm3 molecule-1 s-1. Moreover, the rate coefficients show non-Arrhenius behavior, decreasing as the temperature increases, which is consistent with the experimental expectation. In this way, the performance of the variational transition state theory for this reaction can be considered satisfactory.
Keywords: SN2, CH3Cl + OH, CVTST, non-Arrhenius behavior
RESUMO
Neste trabalho, o estudo teórico da reação de substituição nucleofílica de segunda ordem em fase gasosa, CH3Cl + OH→ CH3OH + Cl, é apresentado visando a descrição do caminho de reação e o cálculo de coeficientes de velocidade pelo método do estado de transição variacional canônico (CVTST). Cálculos teóricos foram conduzidos em nível MP2/6-31+G(d). A diferença de entalpia calculada para esta reação a 298,15 K (49,93 kcal mol-1) está em bom acordo com o dado da literatura: 50,4 kcal mol-1. O coeficiente de velocidade calculado a 298,15 K, 1,94 × 109 cm3 molécula-1 s-1, também apresenta bom acordo com o dado experimental: 1,3-1,6 × 109 cm3 molécula-1 s-1. Além disso, os coeficientes de velocidade mostram comportamento não-Arrhenius, diminuindo com o aumento da temperatura, o que é consistente com a tendência experimental. Neste aspecto, a atuação da teoria de estado de transição variacional para essa reação deve ser considerada satisfatória.
Introduction
Nucleophilic substitution reactions have been investigated by experimental methods for more than a hundred years.1 Nevertheless, huge progress concerning the mechanism and potential energy profiles has only been achieved in the last decades as a result of theoretical calculations. For the widely known SN2 mechanism, a double well potential surface for the gas-phase reaction has been proposed, each well corresponding to an intermediate (pre- or post-barrier).2Figure 1 shows the double well potential for a general gas-phase SN2 reaction, represented by Y + RX → RY + X. In Figure 1a, the identity reaction is shown, where X = Y and in Figure 1b, an exothermic SN2 reaction is represented. The two wells correspond to the ion-molecule complexes: [Y---RX] (the pre-barrier intermediate) and [YR---X] (the post-barrier intermediate). This potential energy profile has been further supported by several investigations.3
The pre-barrier ion-molecule complex is formed upon collision of the Y nucleophile and the RX molecule. After collision and stabilization, the [Y---RX] intermediate can dissociate back to Y + RX or pass through the central barrier, where the [Y-R-X],± saddle point is located, forming the [YR---X] intermediate, which dissociates to the final products.3 If it is assumed that the pre-barrier ion-molecule complex is trapped in the potential well for enough time so that energy redistribution is achieved in a time scale that is faster than the passage through the central barrier (therefore characterizing an equilibrium situation), a theoretical model based on the transition state theory can be applied for the prediction of the rate coefficients of the global SN2 reaction.
In this work, theoretical calculations are performed for the reaction:
CH3Cl + OH→ CH3OH + Cl
in order to describe the stationary points and the most relevant energetic aspects of the potential energy surface. Assuming the equilibrium hypothesis, the canonical variational transition state theory (CVTST) is adopted for the evaluation of the rate coefficients. This reaction profile has been first investigated by Ohta and Morokuma4 and later by Evanseck et al.,5 Gonzalez-Lafont et al.,6 Re and Morokuma7 and Borisov et al.,8 who have also calculated rate coefficients with the phase-space-integral-based formulation of the variational transition state theory (PSI-VTST).8 Despite the considerable amount of electronic structure and kinetics information already available in the literature, we reinvestigate this reaction to assess of the performance of the CVTST, as implemented in our laboratory, on predicting the rate coefficients for this gas-phase SN2 reaction.
Experimental
Theoretical calculations
The calculations have been performed at the second order Møller-Plesset perturbation theory,9 adopting the 6-31+G(d) basis set (hereafter referred as MP2/6-31+G(d)). These include geometry optimizations of the stationary points along the CH3Cl + OH → CH3OH + Cl reaction path (reactants, intermediates, saddle point and product) and calculations of vibrational frequencies. Additional calculations with larger basis sets and at the DFT/BHandHLYP and CCSD(T) levels were also performed and will be detailed later. The geometry of the saddle point has been validated by inspection of the vibrational modes and frequencies: the saddle point showed one imaginary frequency related to the normal mode that corresponds to the expected motion of the reaction coordinate. The thermochemical properties (enthalpy, entropy and Gibbs free energy differences) have been evaluated at different temperature values using the rigid rotor, harmonic oscillator and ideal gas assumptions.10 Also, equilibrium constants at each temperature have been calculated. Starting from the saddle point geometry, the minimum energy path has been evaluated using the intrinsic reaction coordinate (IRC) method.11 In order to connect the intermediates and reactants (and products), relaxed scans calculations along a particular internal coordinate have been adopted to describe the dissociation paths: [ClCH3---OH]→ CH3Cl + OH and [Cl---CH3OH]→ CH3OH + Cl. This particular internal coordinate has been chosen as that one leading to the isolated fragments.
All quantum chemical calculations have been performed using the G03W12 and GAMESS13 programs.
Rate coefficients have been determined for the global reaction considering the chemical model:
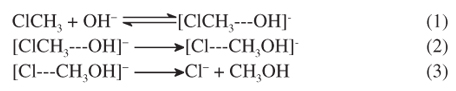
Taking k1 and k2 for the rate coefficients of the direct reactions 1 and 2, respectively and k-1 as the rate coefficient for the reverse reaction 1, the steady state assumption leads to a global rate coefficient kg, expressed as:
The individual k-1 and k2 rate coefficients have been calculated on the basis of the canonical variational transition state theory,14 as implemented in the kcvt program, developed in our laboratory.15 Briefly, the potential curve expressed as the total energy as a function of the reaction coordinate is transformed into a Gibbs free energy curve, G(s,T), which is maximized for the location of the variational transition state, s*, and at each temperature. The maximization procedure involves first a fitting of the potential curve to a third or fifth order polynomial and then analytic differentiation of the polynomial to locate the maximum value. The maximum Gmax(s*,T) is then adopted for predicting the rate coefficients using the thermodynamic interpretation of transition state theory. Otherwise the molecular properties of the generalized transition state, located at s*, are interpolated and new partition functions are calculated for this set of molecular data and applied in the transition state theory equation for the determination of the rate coefficients. The k1 rate coefficients, as a function of temperature, have been obtained from the relation of the direct and reverse rate coefficients and the equilibrium constant. As in the calculation of the equilibrium constants and the other thermochemical quantities, the harmonic oscillator model has been adopted for all vibrational frequencies for all species except for the pre-barrier complex where low frequencies are best treated by a hindered or free rotor model.16 No corrections for anharmonicity have been done. The tunneling effects were investigated by the Wigner expression proving to be negligible, so that the reported rate coefficients are non-corrected values.
Results and Discussion
The stationary points located along the CH3Cl + OH→ CH3OH + Cl reaction path are introduced in Figure 2. A brief inspection of our calculated geometrical parameters suggests a good agreement with the literature values,17-19 with the relative deviations values being very small and, in some cases, of the same order of magnitude as the experimental uncertainty, as that found for the CO interatomic distance in methanol (0.005 Å, while the reported experimental uncertainty is 0.007 Å). The highest deviation, found for the HCO angle in methanol (3.6%), is considered small enough to support that a good agreement among theoretical and literature values17-19 have been achieved for the isolated molecules. The complete geometric data is given as Supplementary Material.
As mentioned above, vibrational frequencies have been calculated for these isolated species, and a reasonable agreement can also be found among the theoretical and experimental data,19,20 with relative deviations and root mean square (rms) values of 10% and 128 cm-1 for methanol, 6% and 130 cm-1 for methyl chloride and less than 1% and 1 cm-1 for the hydroxide anion. These rms values are smaller than the smallest vibrational frequency value for each molecule, so that the determination of molecular parameters may be considered satisfactory at this level of theory (mainly for the hydroxide anion and methyl chloride, for which the rms values represent the maximum errors of 0.03% and 17%, respectively; the same analysis for methanol, however, suggest the maximum error of 38%). It is important to emphasize that for the calculations of the vibrational frequencies, the harmonic oscillator model was assumed and typical errors related to the values of the vibrational frequencies due to the harmonic assumption can be expected in the range from 10-20%. The parameter that most contributed to the high error value in methanol was the frequency related to the torsion mode (calculated: 333 cm-1 and experimental:19 200 cm-1), for which the error is of the same order of magnitude of the experimental value. This agreement is, in particular, not improved by increasing the quality of the basis set.15
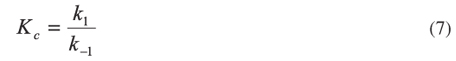
The pre-barrier complex shows a minimum energy geometry in which the OC distance is 2.907 Å, at the MP2/6-31+G(d) level. The CCl distance (1.809 Å) is slightly increased with respect to the same interatomic distance in the isolated methyl chloride (1.7802 Å). The saddle point shows OC and CCl distances of 2.194 and 2.081 Å (at the MP2/6-31+G(d) level), and for the post-barrier complex, these interatomic distances are, respectively, 1.418 and 3.612 Å. Interesting to observe is that the OC distance at the post-barrier complex is smaller than that at the isolated methanol, optimized at the same level of theory (1.432 Å).
Concerning the OCCl angle in the pre- and post-barrier intermediates, it can be noted from the structures shown in Figure 2 that the value 180º is avoided in both pre- and post-barrier complexes. The calculations at the Hartree-Fock (HF) level with the same 6-31+G(d) basis set for the pre-barrier complex results in the value 174.6º for the OCCl angle (therefore suggesting an almost linear structure), in contrast to the 125.2º value obtained at the MP2/6-31+G(d) level. The OCCl angle in the saddle point is almost 180º in all levels of theory, suggesting a quasi-linear structure. The geometry optimization calculations performed for the post-barrier complex, at both HF and MP2 levels of theory suggest a bent structure as the minimum energy geometry, in which the chloride anion interacts with the hydrogen atom of the hydroxyl group in methanol. The OCCl angle at the MP2/6-31+G(d) level for the post-barrier complex is 59.05º. Partial optimizations were also performed for the post-barrier complex, keeping the OCCl angle frozen at the same value found for the saddle point, converging to a geometry that can only be located under this frozen coordinate restriction. The CCl interatomic distance in the quasi-linear post-barrier complex decreases about 4.8% in respect to the CCl distance in the global minimum. In fact, the bending potential curves, shown in Figure 3, confirm that the quasi-linear geometries of the pre- and post-barrier complexes, at the MP2 level, may not be related to any local minima.
The changes in the interatomic distances are accompanied by changes in the atomic charges, first as a result of the perturbation caused by the OH fragment on the electronic structure of the isolated methyl chloride along the formation of the pre-barrier complex and then along the course of the reaction. Here, Mulliken atomic charges, in atomic units, are reported. The proximity of the OH moiety modifies the charge on the chlorine atom from -0.057 (in the isolated methyl chloride) to -0.207 (in the pre-barrier complex). The charge values on the hydrogen atoms decrease from 0.229 to 0.184 and the charge on the carbon atom slightly modifies from -0.631 to -0.642. As the absolute values of the (negative) charges on chlorine and carbon atoms increase along the formation of the pre-barrier complex, the CCl distance increases, as a local electrostatic effect.
A different situation is observed for the post-barrier complex: the CO distance decreases 1% in relation to that in isolated methanol. The HO distance increases from 0.972 to 0.996 Å and the HCl interatomic distance in the post-barrier complex is 2.148 Å (the hydrogen atom, in this case, is that in the hydroxyl group in methanol). The charge value of the oxygen atom decreases from 0.740 to 0.771, whereas the charge on the hydrogen atom (connected to the oxygen atom) increases from 0.476 to 0.523 and the charge on the carbon atom remains at the constant value of 0.260. Therefore, the intensity of the electrostatic repulsion between the CH3 and OH moieties in the isolated methanol is smaller than that in the post-barrier complex, even though a decrease in the CO distance is observed for the post-barrier complex in relation to the isolated methanol. These trends in geometry and charges are contradictory. It must be emphasized that the same contradictory trends are observed if other theoretical models for the atomic charges, like the Atomic Polar Tensor (APT charges), are adopted.
Since a simple electrostatic model is not enough to justify the differences in geometry (or even the stabilization) of the post-barrier complex with respect to the isolated methanol, a different analysis must be performed in order to identify the main effects that govern the observed trends in the geometrical parameters and, possibly, the reaction dynamics. The analysis adopted here consists of a decomposition scheme of the total energy, based on the most fundamental energy terms that compose the Hartree-Fock molecular total energy: the kinetic energy term (T), the attraction among all nuclei and electrons (VNe), the repulsion among all nuclei (VNN), and the coulomb (J) and exchange (K) terms that compose the two-electron potential energy term (Vee). These energy terms are reported in Table 1, with respect to the isolated reactants (even though it would be useful to have them reported with respect to the products, so that a comparison among the energy terms in the post-barrier complex and the products can be directly noted). In this table, DV refer to the sum of the potential energy terms: ∆(VNe), ∆(VNN) and ∆(J). In our calculations, the MP2 correction terms (∆MP2) must also be considered and are also shown in Table 1, as well as the total MP2 relative energy (with and without vibrational zero point energy contributions). It is important to emphasize that the ∆(T+V) sum is separated from the ∆K term, since the former keeps a classical correspondence, whereas the latter is a purely quantum quantity. The electrostatic terms govern the total stabilization energy of the pre-barrier complex, in regard to the isolated CH3Cl and OH species, which is in agreement with the previous discussion. A comparison of the energy terms of the saddle point and the pre-barrier complex, however, shows that ∆(T+V) decrease 8.36 kcal mol-1 at the saddle point, while the ∆K term increases 11.30 kcal mol-1, being the exchange effect responsible for the barrier height. In fact, attempts to locate this saddle point at the DFT level, adopting the B3LYP functional failed, but the geometry of the saddle point is rapidly achieved with the BHandHLYP functional, which is very similar to the former functional, but with an increased HF exchange content in its expression. The optimized geometry and vibrational frequencies of the saddle point, as well as the electronic energy calculated at the BHandHLYP/6-31+G(d) level are reported in the Supplementary Material. Interesting to note is that at the post-barrier complex, compared to the isolated products, the ∆(T+V) and the ∆K terms decrease 2.33 and 9.43 kcal mol-1, respectively. Also in this case, the exchange effect prevails, justifying the shortening of the CO distance at the post-barrier complex, in relation to that at the isolated methanol. Evidences for the relation of the exchange energy and the shortening of bond distances can be found in literature.21
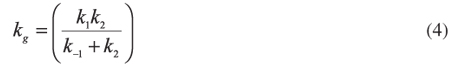
Starting from the minimum energy geometries located for each complex, relaxed scan calculations were performed in order to describe the dissociation of the pre- and post-barrier intermediates back into the reactants or forwards, into final products. Also, an intrinsic reaction path calculation (IRC) was performed, starting from the saddle point geometry, in order to connect the two intermediates and the saddle point. Figure 4 shows each potential energy curve (Figures 4a, 4b and 4c) and also a global potential energy curve (Figure 4d), where a new coordinate was adopted to allow the representation of the potential energy profile for the global reaction. This coordinate system is a combination of the internal coordinates that are most relevant for the description of the global reaction: the CO and CCl interatomic distances, referred as dCO and dCCl, respectively, and the combined internal coordinates being expressed by the relation (dCCl-dCO). The general double-well potential curve (Figure 1b) is obtained, as expected for this exothermic substitution reaction. It is worth noting that the IRC calculation leads to the quasi-linear geometry for the post-barrier complex as the product and not to the optimized bent geometry. A relaxed scan performed by elongating the CCl distance from this final point of the IRC and is represented by the full line in Figure 4, while the dashed line represents the dissociation of the minimum energy geometry found for the post-barrier complex.
The Mulliken atomic charges were also evaluated for the points along the global reaction path and main changes of the carbon, chlorine and oxygen charges are introduced in Figure 5 (the vertical lines mark the locations of the pre-barrier intermediate, the saddle point and the post-barrier intermediate). The charges (reported in atomic units) at the carbon and the oxygen atoms remain nearly unchanged until such a separation of the CH3Cl molecule and OH anion that correspond to the (dCCl-dCO) difference of almost 3.0 Å. At this region, the charge at the chlorine atom changes from 0.07 to 0.12. After this point, the charges at the oxygen and carbon atoms decrease to minimum values, 1.34 and 0.64, respectively, at the location of the pre-barrier intermediate, rapidly increasing to 0.77 and 0.27 at the post-barrier intermediate. Then, these values slowly increase to reach the charge values at the oxygen and carbon atoms at the isolated methanol molecule. The charge value at the chlorine atom rapidly decrease from the location of the pre-barrier intermediate to the location of the post-barrier complex, reaching the value of 1 and remaining unchanged from this point on. Since these are the expected changes for the atomic charges along the SN2 reaction, the description of the whole process in terms of the atomic charges also validates this reaction profile.
The molecular properties, including the total energy, calculated at the MP2/6-31+G(d) level were used to calculate the thermodynamic properties for the reactions 1-3. Enthalpy, entropy and Gibbs free energies were evaluated at the range from 298.15 to 598.15K, using the standard models for all stationary points, except the pre-barrier intermediate, whose smallest vibrational frequency (70 cm-1) is best treated as an internal rotor (this vibrational mode corresponds to a movement which is governed by the dihedral HOCCl angle torsion, showing a barrier to internal rotation of 0.82 kcal mol-1). For methanol, the internal rotor model was applied as well, considering the barrier to internal rotation of 1.35 kcal mol-1, calculated at the B3LYP/cc-pVDZ level, as previously reported.15
The values for the enthalpy, entropy and Gibbs free energy differences are shown in Table 2 for selected temperature values. Note that the differences are reported with respect to the reactants, which are taken as the reference independently of the temperature. The calculated enthalpy difference at 298.15K for the global reaction is 49.93 kcal mol-1, which is in agreement with the experimental value of (50.4±0.5) kcal mol-1.2,22,23 For the CH3Cl + OH → [ClCH3---OH] reaction, both terms of the Gibbs free energy difference, ∆H and (-TDS), increase as the temperature increases resulting in an increasing ∆G as a function of the temperature. At the central barrier, it can be noted that the enthalpy differences decrease as the temperature increases, whereas the (-TDS) term increases, also resulting in an increasing ∆G function. Considering the [ClCH3---OH] → [Cl---CH3OH] reaction, the entropic term increases, while the enthalpic term decreases as the temperature increases. The resulting ∆G is an increasing function of the temperature, although the values of this property are found at the same order of magnitude of the ∆H values. The same is verified for the global, CH3Cl + OH→ CH3OH + Cl, reaction. The Gibbs free energy profiles at different temperatures are shown in Figure 6.
As the MP2/6-31+G(d) level could be considered not robust enough to include all the important correlation and dispersion effects needed for a proper theoretical description of thermochemical and kinetic properties of a chemical reaction, additional calculations were performed in order to test the quality of the results obtained so far. These additional calculations include geometry optimizations and vibrational frequencies calculations for all stationary points at the MP2/aug-cc-pVDZ, and single point calculations (based on MP2/aug-cc-pVDZ geometries) at the MP2/aug-cc-pVTZ, MP2/aug-cc-pVQZ and CCSD(T)/aug-cc-pVDZ levels. In fact, some geometry optimizations were also performed at the MP2/aug-cc-pVTZ level, but a comparison of the relative energies with those obtained at the MP2/aug-cc-pVTZ//MP2/aug-cc-pVDZ showed that single point calculations are indeed satisfactory since the improvement of the relative energies due to geometry optimizations were less than 0.05 kcal mol-1. This new set of calculations allowed the estimative of the relative energies at the limit for basis set completeness at the CCSD(T) level, CCSD(T)/CBS, as follows. First, the complete basis set limit at the MP2 level is predicted using:24

where x stands for 2, 3 or 4 corresponding to the aug-cc-pvDZ, aug-cc-pVTZ and aug-cc-pVQZ energies, respectively, and EMP2/CBS, A and B are parameters to be determined. Then, the additivity method was assumed:25-29

Here EMP2/CBS is the MP2 energy obtained as explained above, and ECCSD(T)/CBS is the energy at the CCSD(T) level at an infinite basis set limit. Results are shown in Table 3. Total energies, reported in hartrees, are available as Supplementary Material.
It is important to observe from the data in Table 3 that the MP2/CBS results agree very well to the MP2/6-31+G(d) results reported in Table 1, with deviations of less than 0.1 kcal mol-1 for the pre-barrier complex relative energy and less than 0.5 kcal mol-1 for the barrier height. Larger deviations are found for the relative energies of the post-barrier complex and products (approximately 2 and 3 kcal mol-1, respectively) due to a better description of the chloride anion. The larger deviation found for the isolated products with respect to the reactants affects the reaction thermochemistry, underestimating the reaction enthalpy difference with respect to the literature values, although satisfactory results are still obtained. A comparison of the most reliable CCSD(T)/CBS results with the MP2/6-31+G(d) relative energies show that once more a good agreement is obtained, with deviations of 1 kcal mol-1 or less, except for the barrier height, which shows a deviation of approximately 2 kcal mol-1. This larger deviation for the barrier height was somewhat expected, since larger values for this property are expected as a result of MP2 calculations. Borisov et al.8 have also calculated the energetic profile for the CH3Cl + OH SN2 reaction at different levels of theory (MP2, MP3, MP4, CCSD and CCSD(T)) using the augmented correlation-consistent basis sets up to the quadruple zeta and estimated the complete basis set limits. Our CCSD(T)/CBS results agree very well with those previously reported even though a slightly different CBS procedure was adopted here (being the maximum deviation found for the products, 1.8 kcal mol-1). In general, it seems that although the MP2/6-31+G(d) level is not the most complete level of theory, it brings the minimum necessary energetic aspects for a proper description of this system and should be considered good enough, not only for the good agreement with the thermochemical experimental data, but also for the agreement with the most robust theoretical results.
Experimental rate coefficients for CH3Cl + OH→ CH3OH + Cl are found in the literature, being (1.3-1.6) × 109 m3 molecule-1 s-1 the accepted range at 300 K.2 DePuy et al.30 and Mayhew et al.31 reported the values 2.0 × 10⁹ and 1.7 × 109 cm3 molecule-1 s-1 for the rate coefficients at 300K and standard temperature, respectively. The non-Arrhenius behavior is suggested for this kind of reaction, i.e., the rate coefficients decrease as the temperature increases.32-36 As mentioned above, our global rate coefficients were obtained considering the expression resulting from the steady state assumption, whereas each individual rate coefficient was calculated using the canonical variational transition state model.
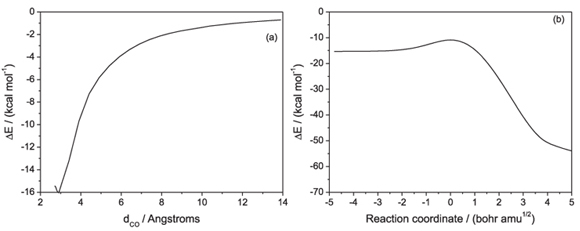
The rate coefficients k-1 are related to the unimolecular decomposition of the pre-barrier complex: [ClCH3---OH] → CH3Cl + OH. This decomposition occurs through a barrierless potential curve. Therefore, the adoption of the variational transition state theory is, in this case, imperative. The molecular properties of 21 points along the minimum energy curve were given as input values for the calculation of the variational k-1(T) rate coefficients in the temperature range from 198 to 798 K. The values of k1(T) and k-1(T) are related to the equilibrium constants through the microscopic reversibility:
The calculated values for Kc(T) and k-1(T) were used to obtain the values for the rate coefficients k1(T), using the equation presented above. The location of the variational transition state, here referred as s*, varied from 7.6 to 6.5 Å, as the temperature increases from 198 to 798 K. This is somewhat expected, since the entropy contributions in barrierless potential energy curves may bring the variational transition state close to the reactants (in this case, the pre-barrier complex), as previously discussed.14 The k2 rate coefficients were also obtained using canonical variation transition state theory. But, different from the k-1 calculation, very small variational displacements are observed (the maximum s* value was found for the higher temperature value, being 0.30 bohr amu1/2) and the variational effect is also very small, decreasing the conventional TST rate coefficients in a maximum of 10%. Figure 7 shows the logarithm values of k1, k2 and k-1 at different temperatures. With these values, the global rate coefficients, kg(T) were calculated on the basis of the relation introduced above. The values for kg are shown in Table 4. A typical Arrhenius profile is observed for k-1 and k2, but not for k1 and kg.
The decrease of the k1 and kg rate coefficients, observed as the temperature increases, can be justified by observing the Gibbs free energy profile along the reaction coordinate and the variational displacements. The Gibbs free energy for the dissociation of the pre-barrier complex, [ClCH3---OH] → CH3Cl + OH , rapidly decreases 13.3 kcal mol-1, due to entropy contributions, as the temperature increases from 198 to 798 K. As a consequence, the equilibrium constants also increase very fast. The variational procedure locates the generalized transition state at values of the reaction coordinate corresponding to maximum ∆G values, so that the Gibbs free energy differences between the transition state and the pre-barrier complex also decreases, but not as fast as the Gibbs free energy between the reactant and the products. Therefore, in the ratio k1/Kc, from which the k1 rate coefficients are obtained, both quantities increase as the temperature increases. As the denominator increases faster, decreasing k1 rate coefficients as a function of temperature are obtained.
It is worth noting that the value of the kg rate coefficients are dominated by the k1 rate coefficients (since the differences between the k-1 and k2 rate coefficients, at all temperature values, are very high, the values for the sum (k-1 + k2) tend to k2 and the global rate coefficient tend to k1). Once more it is interesting to discuss the applicability of the MP2/6-31+G(d) for the calculation of rate coefficients. Since kg values are dominated by the k1 rate coefficients, the most important feature of the global potential energy curve is the pre-barrier dissociation. Similarly to what has been done to test the relative energies of the stationary points, a CCSD(T)/CBS dissociation curve was calculated. Results are shown in Supplementary Material and, briefly, any significant contributions have been observed because at the range of the potential curve where the variational transition states are located, the MP2/6-31+G(d) and CCSD(T)/CBS curves almost coincide, differing from less than 0.2 kcal mol-1.
Our calculated value at 298 K, 1.94 × 109 cm3 molecule-1 s-1, shows good comparison with the literature data, (1.3-1.6) × 109 cm3 molecule-1 s-1,2 and also with the most reliable experimental values, 2.0 × 10⁹ and 1.7 × 109 cm3 molecule-1 s-1,30,31 and with the theoretical value calculated by the phase-space-integral-based formulation of the variational transition state theory (PSI-VTST) at 300 K, 3.9 × 109 cm3 molecule-1 s-1.8
A final point that needs attention is that SN2 reactions are widely known not to obey the statistical approach37 and our result at 298 K shows a good agreement with the experimental data available in the literature. Trajectory calculations generally suggest that the reactive system avoids the post-barrier well and dissociates directly to products and inefficient intramolecular vibrational energy redistribution must be expected.38 Moreover, extensive recrossings of the central barrier have also been observed.39 But this is not a general rule for all the SN2 reactions and the Cl + ClCH2CN → ClCH2CN + Cl reaction was shown to obey the statistical approach.40 For the CH3Cl + OH reaction, ab initio dynamics simulations at the HF/3-21G level were reported.41,42 The initial velocities were fitted in order to reach a temperature of 10 K, on the basis of the Boltzmann distribution. Although these simulations and our calculations are not directly comparable, these articles have relevant information that encourages the adoption of the CVTST for the prediction of rate coefficients and the most important is that the pre-barrier complex is reached and shows a very small lifetime. This time may be enough for the intramolecular energy redistribution, or not. Fact is that, considering the assumptions detailed in this work, the canonical variational transition state theory performed satisfactorily (at least at 298 K) in predicting the global rate coefficient and was able to explain the non-Arrhenius temperature dependence of the rate coefficients. Further theoretical investigations are encouraged in order to better understand the statistical and nonstatistical behavior of the SN2 reactions (especially concerning the intramolecular vibrational energy redistribution, applicability of a microcanonical variational model for the evaluation of rate coefficients, statistical product translational energy distribution and Born-Oppenheimer molecular dynamics investigations) and this is part of the work in progress in our laboratory. Some further experimental investigations are also needed for a better understanding of the temperature dependence of the rate coefficients and accurate determination of the Arrhenius-like parameters.
Conclusions
In this work a gas-phase nucleophilic substitution reaction has been studied at the ab initio MP2 level and rate coefficients have been determined by performing canonical variational transition state theory calculations. The MP2 level has been satisfactorily applied for the description of the CH3Cl + OH→ CH3OH + Cl, yielding results in reasonable agreement with the available experimental data and expected temperature behavior concerning both thermochemical and kinetic aspects. The calculated standard enthalpy difference is ∆H298K = 49.93 kcal mol-1, in agreement with the literature data: (50.4 ± 0.5) kcal mol-1. The thermochemical properties (enthalpy, entropy and Gibbs free energy differences) for the non-stationary points along the reaction coordinate have also been calculated, allowing the determination of canonical variational rate coefficients. Our calculated value at 298 K (1.94 × 109 cm3 molecule-1 s-1) is found in agreement with the literature recommended values. Moreover, the non-Arrhenius behavior is found for the rate coefficients. The theoretical global analysis of this reaction and the application of the canonical variational transition state theory for the determination of rate coefficients are the greatest contributions of this work.
Supplementary Information
Supplementary data are available free of charge at http://jbcs.sbq.org.br as PDF file.
Acknowledgment
The authors thank the financial support from FAPERJ (process number: E26/110.236/2010) and CNPq for this project.
Submitted: June 18, 2013
Published online: December 19, 2013
Supplementary Information
The supplementary material is available in pdf: [Supplementary material]
- 1. Walden, P.; Chem. Ber. 1893, 26, 210.
- 2. Olmstead, W. N.; Brauman, J. I.; J. Am. Chem. Soc. 1977, 99, 4219.
- 3. Laerdahl, J. K.; Uggerud, E.; Int. J. of Mass Spec. 2002, 214, 277.
- 4. Ohta, K.; Morokuma, K.; J. Phys. Chem. 1985, 89, 5845.
- 5. Evanseck, J. D.; Blake, J. F.; Jorgensen, W. L.; J. Am. Chem. Soc. 1987, 109, 2349.
- 6. Gonzalez-Lafont, A.; Truong, T. N.; Truhlar, D. G.; J. Phys. Chem. 1991, 95, 4618.
- 7. Re, S.; Morokuma, K.; J. Phys Chem. A 2001, 105, 7185.
- 8. Borisov, Y. A.; Arcia, E. E.; Mielke, S. L.; Garrett, B. C.; Dunning, Jr., T. H.; J. Phys. Chem. A 2001, 105, 7724.
- 9. Moller, C.; Plesset, M. S.; Phys. Rev 1934, 46, 618.
- 10. Cramer, C. J.; Essential of Computational Chemistry: Theory and Models, 2nd ed.; John Wiley & Sons Ltd: Chichester, West Sussex, 2004.
- 11. Fukui, K.; J. Phys. Chem. 1970, 74, 4161.
- 12. Gaussian 03, Revision A.1. Frisch, M. J.; Trucks, G. W.; Schlegel, H. B.; Scuseria, G. E.; Robb, M. A.; Cheeseman, J. R.; Montgomery, Jr., J. A.; Vreven, T.; Kudin, K. N.; Burant, J. C.; Millam, J. M.; Iyengar, S. S.; Tomasi, J.; Barone, V.; Mennucci, B.; Cossi, M.; Scalmani, G.; Rega, N.; Petersson, G. A.; Nakatsuji, H.; Hada, M.; Ehara, M.; Toyota, K.; Fukuda, R.; Hasegawa, J.; Ishida, M.; Nakajima, T.; Honda, Y.; Kitao, O.; Nakai, H.; Klene, M.; Li, X.; Knox, J. E.; Hratchian, H. P.; Cross, J. B.; Adamo, C.; Jaramillo, J.; Gomperts, R.; Stratmann, R. E.; Yazyev, O.; Austin, A. J.; Cammi, R.; Pomelli, C.; Ochterski, J. W.; Ayala, P. Y.; Morokuma, K.; Voth, G. A.; Salvador, P.; Dannenberg, J. J.; Zakrzewski, V. G.; Dapprich, S.; Daniels, A. D.; Strain, M. C.; Farkas, O.; Malick, D. K.; Rabuck, A. D.; Raghavachari, K.; Foresman, J. B.; Ortiz, J. V.; Cui, Q.; Baboul, A. G.; Clifford, S.; Cioslowski, J.; Stefanov, B. B.; Liu, G.; Liashenko, A.; Piskorz, P.; Komaromi, I.; Martin, R. L.; Fox, D. J.; Keith, T.; Al-Laham, M. A.; Peng, C. Y.; Nanayakkara, A.; Challacombe, M.; Gill, P. M. W.; Johnson, B.; Chen, W.; Wong, M. W.; Gonzalez, C.; and Pople, J. A. Gaussian, Inc., Pittsburgh PA, 2003.
- 13. Schmidt, M. W.; Baldridge, K. K.; Boatz, J. A.; Elbert, S. T.; Gordon, M. S.; Jensen, J. J.; Koseki, S.; Matsunaga, N.; Nguyen, K. A.; Su, S.; Windus, T. L.; Dupuis, M.; Montgomery, J. A.; J. Comp. Chem. 1993, 14, 1347.
- 14. Truhlar, D. G.; Garrett, B. C.; Annu. Rev. Phys. Chem. 1984, 35, 159.
- 15. Oliveira, R. C. de M.; Bauerfeldt, G. F.; Int. J. Quantum Chem. 2012, 112, 3132.
- 16. Ayala, P. Y.; Schlegel, H. B.; J. Chem. Phys. 1998, 108, 2314.
- 17. Venkateswarlu, P.; Gordy, W.; J. Chem. Phys. 1955, 23, 1200.
- 18. Duncan, J. L.; McKean, D. C.; Mallinson, P. D.; McCulloch, R. D.; J. Mol. Spect. 1973, 46, 232.
-
19National Institute of Standards and Technology (NIST); Computational Chemistry Comparison and Benchmark Database; NIST Standard Reference Database Number 101. Release 15b, ed. Russell D. Johnson III, 2011 in http://cccbdb.nist.gov/ accessed in November, 2013.
- 20. Dickson, A. D.; Mills, I. M.; Crawford Jr., B.; J. Chem. Phys. 1957, 27, 445.
- 21. Bauerfeldt, G. F.; Cardozo, T. M.; Pereira, M. S.; da Silva, C. O.; Org. Biomol. Chem. 2013, 11, 299.
- 22. Henchman, M.; Paulson, J. F.; Hierl, P. M.; J. Am. Chem. Soc. 1983, 105, 5509.
- 23. Bohme, D. K.; Raksit, A. B.; J. Am. Chem. Soc 1984, 106, 3447.
- 24. Woon, D. E.; Dunning, T. H.; J. Chem. Phys. 1993, 99, 1914.
- 25. Nobes, R. H.; Bouma, W. J.; Radom, L.; Chem. Phys. Lett. 1982, 89,497.
- 26. Curtiss, L. A.; Carpenter, J. E.; Raghavachari, K.; Pople, J. A.; J. Chem. Phys. 1992, 96, 9030.
- 27. Resende, S. M.; Ornellas, F. R.; Chem. Phys. Lett. 2000, 318, 340.
- 28. Resende, S. M.; Ornellas, F. R.; J. Phys. Chem. A 2000, 104, 11934.
- 29. Vandresen, S.; Resende, S. M.; J. Phys. Chem. A 2004, 108, 2284.
- 30. DePuy, C. H.; Gronert, S.; Mullin, A.; Bierbaum, V. M.; J. Am. Chem. Soc. 1990, 112, 8650.
- 31. Mayhew, C. A.; Peverall, R.; Timperley, C. M.; Watts, P.; Int. J. Mass Spec. 2004, 233, 155.
- 32. Hierl, P. M.; Ahrens, A. F.; Henchman, M.; Viggiano, A. A.; Paulson, J. F.; Clary, D. C.; J. Am. Chem. Soc. 1986, 108, 3142.
- 33. Sen Sharma, D. K.; Kebarle, P.; J. Am. Chem. Soc. 1982, 104, 19.
- 34. Caldwell, G.; Magnera, T. F.; Kebarle, P.; J. Am. Chem. Soc. 1984, 106, 959.
- 35. Grimsrud, E. P.; Chowdhury, S.; Kebarle, P.; J. Chem. Phys. 1985, 83, 1059
- 36. Sharma, R. B.; Sen Sharma, D. K.; Hiraoka, K.; Kebarle, P.; J. Am. Chem. Soc. 1985, 107, 3747.
- 37. Hase, W. L; Science 1994, 266, 998.
- 38. Sun, L.; Song, K.; Hase, W. L.; Science 2002, 296, 875.
- 39. Sun, L.; Hase, W. L.; Song, K.; J. Am. Chem. Soc. 2001, 123, 5753.
- 40. Viggiano, A. A.; Morris, R. A.; Su, T.; Wladkowski, B. D.; Craig, S. L.; Zhong, M.; Brauman, J. I.; J. Am. Chem. Soc. 1994, 116, 2213.
- 41. Tachikawa, H.; Igarashi, M.; Ishibashi, T.; J. Phys. Chem. A 2002, 106, 10977.
- 42. Tachikawa, H.; Igarashi, M.; Chem. Phys. 2006, 324, 639.
Publication Dates
-
Publication in this collection
14 Feb 2014 -
Date of issue
Feb 2014
History
-
Received
18 June 2013 -
Accepted
19 Dec 2013


