Abstract
Ulcerative colitis is one of the IBDs. Its etiology and pathogenesis remain undefined with an interaction between environmental, genetic and immunological factors is the most accepted explanation. Several recent studies have examined microRNA expression in the peripheral blood and tissues from IBD patients. The study aims at assessing the expression of serum miR-16 in ulcerative colitis patients and its correlation with disease extent, activity and severity. It included 30 treatment naïve ulcerative colitis patients of different presentations. Serum miR-16 expression was assessed using reverse transcriptase quantitative real time PCR (RT-qPCR), and then correlated with that of a group of 20 healthy subjects to assess its role in diagnosis of ulcerative colitis. Also, it was correlated with disease extent (proctitis, left sided colitis, extensive colitis) and disease activity and severity indices (Truelove and Witts criteria, fecal calprotectin and UCEIS). Thirty ulcerative colitis patients were enrolled, 53% had mild, 37% had moderate, while 10% had severe disease. Concerning endoscopic extent, 8 had proctitis, 14 had left sided colitis and 8 had extensive colitis. Serum expression of miR-16 in the 30 patients were compared to that of the healthy control subjects. The patients’ group showed median serum miR-16 expression of 1.91, 1.13 for the control group with a significant difference between both groups. Correlation between serum miR-16 expression with disease extent, activity and severity showed no significant relation. From the current study we can conclude that increased serum expression of miR-16 is associated with ulcerative colitis despite no significant relation to disease activity extent or severity.
Keywords:
MicroRNA-16; Reverse transcriptase quantitative real time PCR; Ulcerative colitis
Resumo
A colite ulcerativa é uma das DII. Sua etiologia e patogênese permanecem indefinidas; a interação entre fatores ambientais, genéticos e imunológicos é a explicação mais aceita. Vários estudos recentes avaliaram a expressão de microRNA no sangue e tecidos periféricos em pacientes com DII. O presente estudo teve como objetivo avaliar a expressão do miR-16 sérico em pacientes com colite ulcerativa e sua correlação com a extensão, atividade e gravidade da doença. Foram incluídos 30 pacientes de colite ulcerativa, com diferentes apresentações, que ainda não haviam sido submetidos a nenhum tipo de tratamento. A expressão sérica de miR-16 foi avaliada usando transcrição reversa seguida de reação em cadeia da polimerase quantitativa (RT-qPCR) e, em seguida, correlacionada com a de um grupo de 20 indivíduos saudáveis para avaliar seu papel no diagnóstico de colite ulcerativa. Além disso, foi feita uma correlação com a extensão da doença (proctite, colite do lado esquerdo, colite extensa) e com os índices de atividade e gravidade da doença (critérios de Truelove e Witts, calprotectina fecal e UCEIS). Trinta pacientes com colite ulcerativa foram incluídos no estudo, classificada como leve em 53%, moderada em 37% e grave em 10%. Quanto à extensão endoscópica, oito apresentavam proctite, 14 apresentavam colite do lado esquerdo e oito apresentavam colite extensa. A expressão sérica de miR-16 nos 30 pacientes foi comparada à dos indivíduos controle saudáveis. No, grupo de pacientes, a expressão sérica de miR-16 foi de 1,91 (grupo controle: 1,13), uma diferença estatisticamente significativa entre os dois grupos. Não foi observada relação significativa entre a expressão sérica de miR-16 e a extensão, atividade e gravidade da doença. A partir do presente estudo, pode-se concluir que o aumento da expressão sérica do miR-16 está associado à colite ulcerativa, apesar de não haver relação significativa com a extensão ou gravidade da atividade da doença.
Palavras-chave:
MicroRNA-16; Transcrição reversa seguida de PCR quantitativa em tempo real; Colite ulcerativa
Introduction
Ulcerative colitis (UC) is one of the two major types of Inflammatory Bowel Disease (IBDs). Unlike Crohn’s Disease (CD), which affects any segment of the gastrointestinal tract from the mouth to anus, UC involves characteristically the colon, extending from the anal verge uninterruptedly to involve part or the whole colon.11 Matsuoka K, Kobayashi T, Ueno F, Matsui T, Hirai F, Inoue N, et al. Evidence-based clinical practice guidelines for inflammatory bowel disease. J Gastroenterol. 2018;53:305-53. Exact etiology of UC is unknown, but certain factors have been reported to be associated with the disease, and some theories have been postulated. UC is believed to be a T-cell-driven process with a variety of immunologic changes have been documented. Some of these changes include: Accumulation of cytotoxic T-cells in the lamina propria of the affected colonic segment with an increase in the number of B-cells and plasma cells, leading to increased formation of Immunoglobulin-G (IgG) and immunoglobulin-E (IgE).22 Himmel ME, Hardenberg G, Piccirillo CA, Steiner TS, Levings MK. The role of T-regulatory cells and Toll-like receptors in the pathogenesis of human inflammatory bowel disease. Immunology. 2008;125:145-53. Anti-colonic antibodies, smooth muscle and anti-cytoskeletal antibodies have been detected in small portions of patients with UC.33 Hibi T, Aiso S, Yoshida T, Watanabe M, Asakura H, Tsuru S, et al. Anti-colon antibody and lymphocytophilic antibody in ulcerative colitis. Clin Exp Immunol. 1982;49:75-80. Other factors that may be associated with UC include the following:
Vitamins A and E are present in low levels in 16% of UC exacerbations in children.44 Bousvaros A, Zurakowski D, Duggan C, Law T, Rifai N, Goldberg NE, et al. Vitamins A and E serum levels in children and young adults with inflammatory bowel disease: effect of disease activity. J Pediatr Gastroenterol Nutr. 1998;26:129-35.
Psychological stress can have a role in the disease presentation and precipitate its exacerbations.55 Levenstein S, Prantera C, Varvo V, Scribano ML, Andreoli A, Luzi C, et al. Stress and exacerbation in ulcerative colitis: a prospective study of patients enrolled in remission. Am J Gastroenterol. 2000;95:1213-20.
Smoking is negatively related to UC unlike Crohn’s disease.66 Zhai H, Huang W, Liu A, Li Q, Hao Q, Ma L, et al. Current smoking improves ulcerative colitis patients’ disease behaviour in the northwest of China. Prz Gastroenterol. 2017;12:286-90.
Milk consumption may exacerbate and increase the severity of the disease.77 Judaki A, Hafeziahmadi M, Yousefi A, Havasian MR, Panahi J, Sayehmiri K, et al. Evaluation of dairy allergy among ulcerative colitis patients. Bioinformation. 2014;10:693-6.
The main clinical presentations of patients with UC are rectal bleeding, frequent stools and mucoid rectal discharge. Some patients also may complain of tenesmus. Onset is usually insidious. In severe cases, dehydration and lower abdominal pain may be present, especially in the elderly patients.88 Sofia MA, Rubin DT, Hou N, Pekow J. Clinical presentation and disease course of inflammatory bowel disease differs by race in a large tertiary care hospital. Dig Dis Sci. 2014;59:2228-35. Fulminant UC may occur, characterized by severe diarrhea, abdominal distention fever and leukocytosis. Fulminant UC occurs more commonly in children than in adults.99 Falcone RA, Lewis LG, Warner BW. Predicting the need for colectomy in pediatric patients with ulcerative colitis. J Gastrointest Surg. 2000;4:201-6. UC could be associated with extracolonic manifestations including pyoderma gangrenosum, uveitis, erythema nodosum, pleuritis, spondyloarthropathies and ankylosing spondylitis.1010 Levine JS, Burakoff R. Extraintestinal manifestations of inflammatory bowel disease. Gastroenterol Hepatol (NY). 2011;7:235-41. A potentially serious condition in patients with UC is Primary Sclerosing Cholangitis (PSC), which can result in cholestatic jaundice and liver failure. About 2/3 of patients with PSC have, or will have UC, while PSC is present in about 3%-7% of UC patients.1111 Broomé U, Chapman RW. Ulcerative colitis: sclerosing cholangitis today, cancer tomorrow?. Gut. 1997;41:571-2.
In 1955, Truelove and Witts classified UC into 3 classes i.e. mild, moderate, and severe according to six clinical and laboratory parameters (Bowel movements per day, blood in stools, pyrexia (temperature more than 37.8 °C), pulse greater than 90 bpm, anemia, erythrocyte sedimentation rate [mm/h]).1212 Turelove SC, Witts LJ. Cortisone in ulcerative colitis; final report on therapeutic trial. Br Med J. 1955;2:1041-8. Diagnosis of UC is based on laboratory findings as complete blood count, acute phase proteins (CRP and ESR), albumin and other serological markers (ANCA), together with stool markers as calprotectin.1313 Collins P, Rhodes J. Ulcerative colitis: diagnosis and management. BMJ. 2006;333:340-3.,1414 Mak WY, Buisson A, Andersen MJ, Lei D, Pekow J, Cohen RD, et al. Fecal calprotectin in assessing endoscopic and histological remission in patients with ulcerative colitis. Dig Dis Sci. 2018;63:1294-301. Colonoscopy is the gold standard for making the diagnosis of UC by allowing direct visualization of the colon and taking multiple tissue biopsies for histopathologic analysis to confirm the diagnosis.1515 Passos MAT, Chaves FC, Chaves-Junior N. The importance of colonoscopy in inflammatory bowel diseases. Arq Bras Cir Dig. 2018;31:e1374. Radiological modalities used for diagnosis and assessment of UC include Computerized Tomography Enterography (CTE) and Magnetic Resonance Enterography (MRE).1616 Deepak P, Bruining DH. Radiographical evaluation of ulcerative colitis. Gastroenterol Rep (Oxf). 2014;2:169-77.
MicroRNAs (miRNA or miR) are small (about 18-22 nucleotides in length), highly conserved, single stranded, non-coding RNA molecules that bind target miR to prevent protein production. Its primary function is regulation of gene expression at the post-transcriptional level.1717 Macfarlane LA, Murphy PR. MicroRNA: biogenesis, function and role in cancer. Curr Genomics. 2010;11:537-61.
In several recent analyses, miR expressions in the peripheral blood from IBD patients have been examined. The expression of miRs in serum and plasma were thought to express the extrusion of miRs from remote tissues and organs.1818 Chapman CG, Pekow J. The emerging role of miRNAs in inflammatory bowel disease: a review. Therap Adv Gastroenterol. 2015;8:4-22. The current study aims at assessing the expression of miR-16 in the serum of patients with UC and its correlation with disease extent (proctitis, left sided colitis and extensive colitis). Also, correlating serum miR-16 expression with some clinical (Truelove and Witts criteria), laboratory (fecal calprotectin) and endoscopic (UCEIS) indices of disease activity and severity.
Methods
The study included patients’ group of 30 treatment naïve patients with established UC of different presentations and a comparative control group of twenty healthy subjects. Patients were accrued from Gastroenterology unit, Alexandria main university hospital during the period from April 2018 to May 2019. The study was approved by the Alexandria university committee of medical ethics (date of approval: 14/3/2018, approval ID: 0201082), written informed consent from all subjects was obtained. The patients were subjected to thorough history taking including social history, symptoms of UC mainly rectal bleeding, diarrhea, abdominal pain, urgency to have bowel movements, fever, and weight loss, the presence of extracolonic symptoms. Complete physical examination was done for all patients, assessment of the colon using ileocolonoscopy with histopathological assessment of the obtained biopsies were done. Relative quantification of miR-16 expression in serum samples was determined through the following 4 steps.
Extraction of total RNA
Purification of cell-free total RNA from serum, which includes small RNAs as miRs, was performed using miRNeasy Serum/Plasma Kit (Qiagen, Germany). The miRNeasy Serum/Plasma Kit includes both phenol/guanidine-based lysis and silica-membrane-based purification.
Procedure
-
Frozen samples were incubated in a water bath at 37 °C until samples are completely thawed.
-
Addition of 1 mL QIAzol Lysis Reagent to 200 µL of plasma was done. Then, mixing by vortex was done.
-
Tube containing the lysate was placed on the bench top at room temperature (15°-25 °C) for 5 min.
-
200 µL chloroform were added to the tube containing the lysate and caped. Vortex was done for 15 s.
-
The tube containing the lysate was placed on the bench top at room temperature (15°-25 °C) for 2-3 min.
-
Centrifugation for 15 min at 14,000 rpm at 4 °C was done. After centrifugation, the sample became separated into 3 phases: an upper, aqueous, colorless phase containing RNA; a white interphase; and a lower, organic, red phase.
-
600 µL of the upper aqueous phase were transferred to a new collection tube.
-
900 µL of 100% ethanol were added and mixing was done by pipetting up and down multiple times.
-
700 µL of the sample, including precipitates were pipetted into 2 mL collection tube containing RNeasy MinElute spin column. Centrifugation was done at 10,000 rpm for 15 s at room temperature (15°-25 °C). The flow-through was discarded.
-
Addition of 700 µL Buffer RWT to the RNeasy MinElute spin column was done. Centrifugation was done for 15 s at 10,000 rpm to wash the column. The flow-through was discarded.
-
500 µL Buffer RPE were pipetted onto the RNeasy MinElute spin column. Centrifugation was done for 15 s at 10,000 rpm to wash the column. The flow-through was discarded.
-
500 µL of 80% ethanol were pipetted onto the RNeasy MinElute spin column. Centrifugation was done for 2 min at 10,000 rpm to wash the membrane of the spin column. The flow-through was discarded.
-
The RNeasy MinElute spin column was then put into a new 2 mL collection tube. The lid of the spin column was opened, and centrifugation at full speed for 5 min was done to dry the membrane. The collection tube with the flow-through was discarded.
-
The RNeasy MinElute spin column was put in a new 1.5 mL collection tube.
-
14 µL of RNase-free water were directly added to the center of the membrane of the spin column. Then, the lid was closed gently, and centrifugation was done at full speed for 1 min to elute the RNA.
-
The concentration and purity of RNA were measured at 260 & 280 & 230 nm using NanoDrop 2000/2000c Spectrophotometer (Thermo Scientific, USA). Ratio of A260/A280 = 1.8-2.1 and A260/A230 = 1.8-2.1 indicates highly pure RNA.
-
Purified RNA was stored at −80 °C till further use.
Reverse transcription (RT)
Single-stranded cDNA was synthesized from purified RNA samples using TaqMan® MicroRNA Reverse Transcription Kit with miRNA primers specific for miR-16 (ID: 000391) and U6 snRNA (ID: 001973) (Applied Biosystems, USA) strictly following the manufacturer’s protocol.
Procedure of RT
-
The kit components were allowed to thaw on ice.
-
In sterile eppendorf, the RT master mix was prepared, RT master mix components were shown in (Table 1).
-
The components were gently mixed and centrifuged to bring solution to the bottom of the tube.
-
5 µL total RNA (containing 10 ng of total RNA) was added to 7 µL RT master mix, gently mixed and centrifuged to bring the solution to the bottom of the tube.
-
The RT primer tubes, were thawed on ice and mixed by vortexing, then centrifuged.
-
3 µL of RT primer (miR-16 or U6 snRNA) was transferred into the corresponding RT reaction tube with 12.0 µL of RT master mix containing total RNA.
-
The tube was sealed, gently mixed and centrifuged to bring solution to the bottom of the tube.
-
Incubation of the tubes on ice for 10 min was done, and then they were kept on ice until loading the thermal cycler.
-
Thermocycling was carried out using Biometra thermocycler, cycling conditions were shown in (Table 2).
-
cDNA was stored at −20 °C.
Quantitative real time PCR (qPCR)
Procedure of qPCR
-
Preparation of PCR reaction mix: PCR reaction mix was prepared (Table 3).
-
The reaction mix was prepared on ice.
-
PCR reaction mix was mixed gently, and centrifuged to bring solution to the bottom of the tube and eliminate any air bubbles.
-
No Template Control (NTC) containing nuclease-free water instead of cDNA was included in each run (negative control).
-
Thermocycling was done using Stratagene Mx300P QPCR System (Stratagene, USA) cycling conditions were shown in (Table 4).
Data analysis
Calculation of the relative quantification of miR-16 expression was done using the comparative CT method. The Comparative CT method provides an efficient method for comparing levels of RNA or DNA across samples when information about the absolute amounts of target in any sample is not required and evidence of a relative increase or decrease in expression, compared to a sample of reference (calibrator), is sufficient. Comparative CT method utilize the arithmetic formula (2−ΔΔCT) to calculate relative quantification.1919 Sterling CH, Veksler-Lublinsky I, Ambros V. An efficient and sensitive method for preparing cDNA libraries from scarce biological samples. Nucleic Acids Res. 2015;43:e1.
Relative quantification (RQ) of miR-16 expression = 2−ΔΔCt
ΔCt: Is the difference of CT value between the target gene and endogenous control gene (ΔCt = Ct miR-16 − Ct U6 snRNA).
ΔΔCt: Is the difference between ΔCt value of the patient or control and mean ΔCt of the controls (ΔΔCt = ΔCt miR-16 − mean controls ΔCt U6 snRNA).
The relative quantification of serum miR-16 expression was presented as the fold change normalized to an endogenous reference (U6 snRNA) and relative to the healthy control. Serum miR-16 expression in UC patients and controls were compared and the relation between serum miR-16 expression in UC patients and extent and severity of the disease were analyzed.
Data were fed to the computer and analyzed using IBM SPSS software package version 20.0 (Armonk, NY: IBM Corp). Qualitative data were described using number and percent. The Kolmogorov-Smirnov test was used to verify the normality of distribution. Quantitative data were described using range (minimum and maximum), mean, standard deviation, median and Interquartile Range (IQR). Comparison between the two studied groups according to serum miR-16 expression was done using Mann Whitney test. Relation between disease extent and serum miR-16 expression was done using Kruskal Wallis test. Receiver Operating Characteristic Curve (ROC) was made to detect diagnostic performance of the test, sensitivity, specificity, positive and negative predictive values. Significance of the obtained results was judged at the 5% level.
Results
Forty three percent of the UC patients were males and 57% were females. The median age for the patients was 28.5 years. We have found that 30% of the patients in the study were cigarette smokers and 70% were non-smokers. No history of a surgical procedure in the GI tract was given for any patient in the current study. Eighty three percent of the patients complained of rectal bleeding 63% of abdominal pain, 76% of chronic diarrhea while 56% complained of weight loss. Forty six percent of the UC patients had arthralgia.
According to Truelove and Witts’s criteria for classification of severity of ulcerative colitis,1212 Turelove SC, Witts LJ. Cortisone in ulcerative colitis; final report on therapeutic trial. Br Med J. 1955;2:1041-8. 53% of cases had mild disease activity, 37% had moderate severity, while 10% had severe disease. Laboratory results of the UC patients are shown in (Table 5).
According to the Ulcerative Colitis Endoscopic Index of Severity (UCEIS)2020 Travis SP, Schnell D, Krzeski P, Abreu MT, Altman DG, Colombel JF, et al. Reliability and initial validation of the ulcerative colitis endoscopic index of severity. Gastroenterology. 2013;145:987-95. 66.7% of the patients showed patchy obliteration of the vascular pattern, 20% showed normal vascular pattern and 13% showed complete obliteration of the vascular pattern. As regards bleeding, 46.7% of the patients showed no visible blood, 40% showed only mucosal blood (Some spots or streaks of coagulated blood on the surface of the mucosa ahead of the scope, which can be washed away), 13% showed luminal mild bleeding (Some free liquid blood in the lumen). As regards erosions and ulcers, 53.3% of patients showed only erosions (Tiny [≤5 mm] defects in the mucosa, of a white or yellow color with a flat edge), 33% showed superficial ulcers (Larger [>5 mm] defects in the mucosa, which are discrete fibrin-covered ulcers in comparison with erosions, but remain superficial) while 13% showed normal mucosa with no visible erosions or ulcers.
The UC patients’ group showed median of 1.91 for miR-16 expression while the control group showed a median of 1.13 with a significant difference between both groups with p-value ≤0.05 (Table 6).
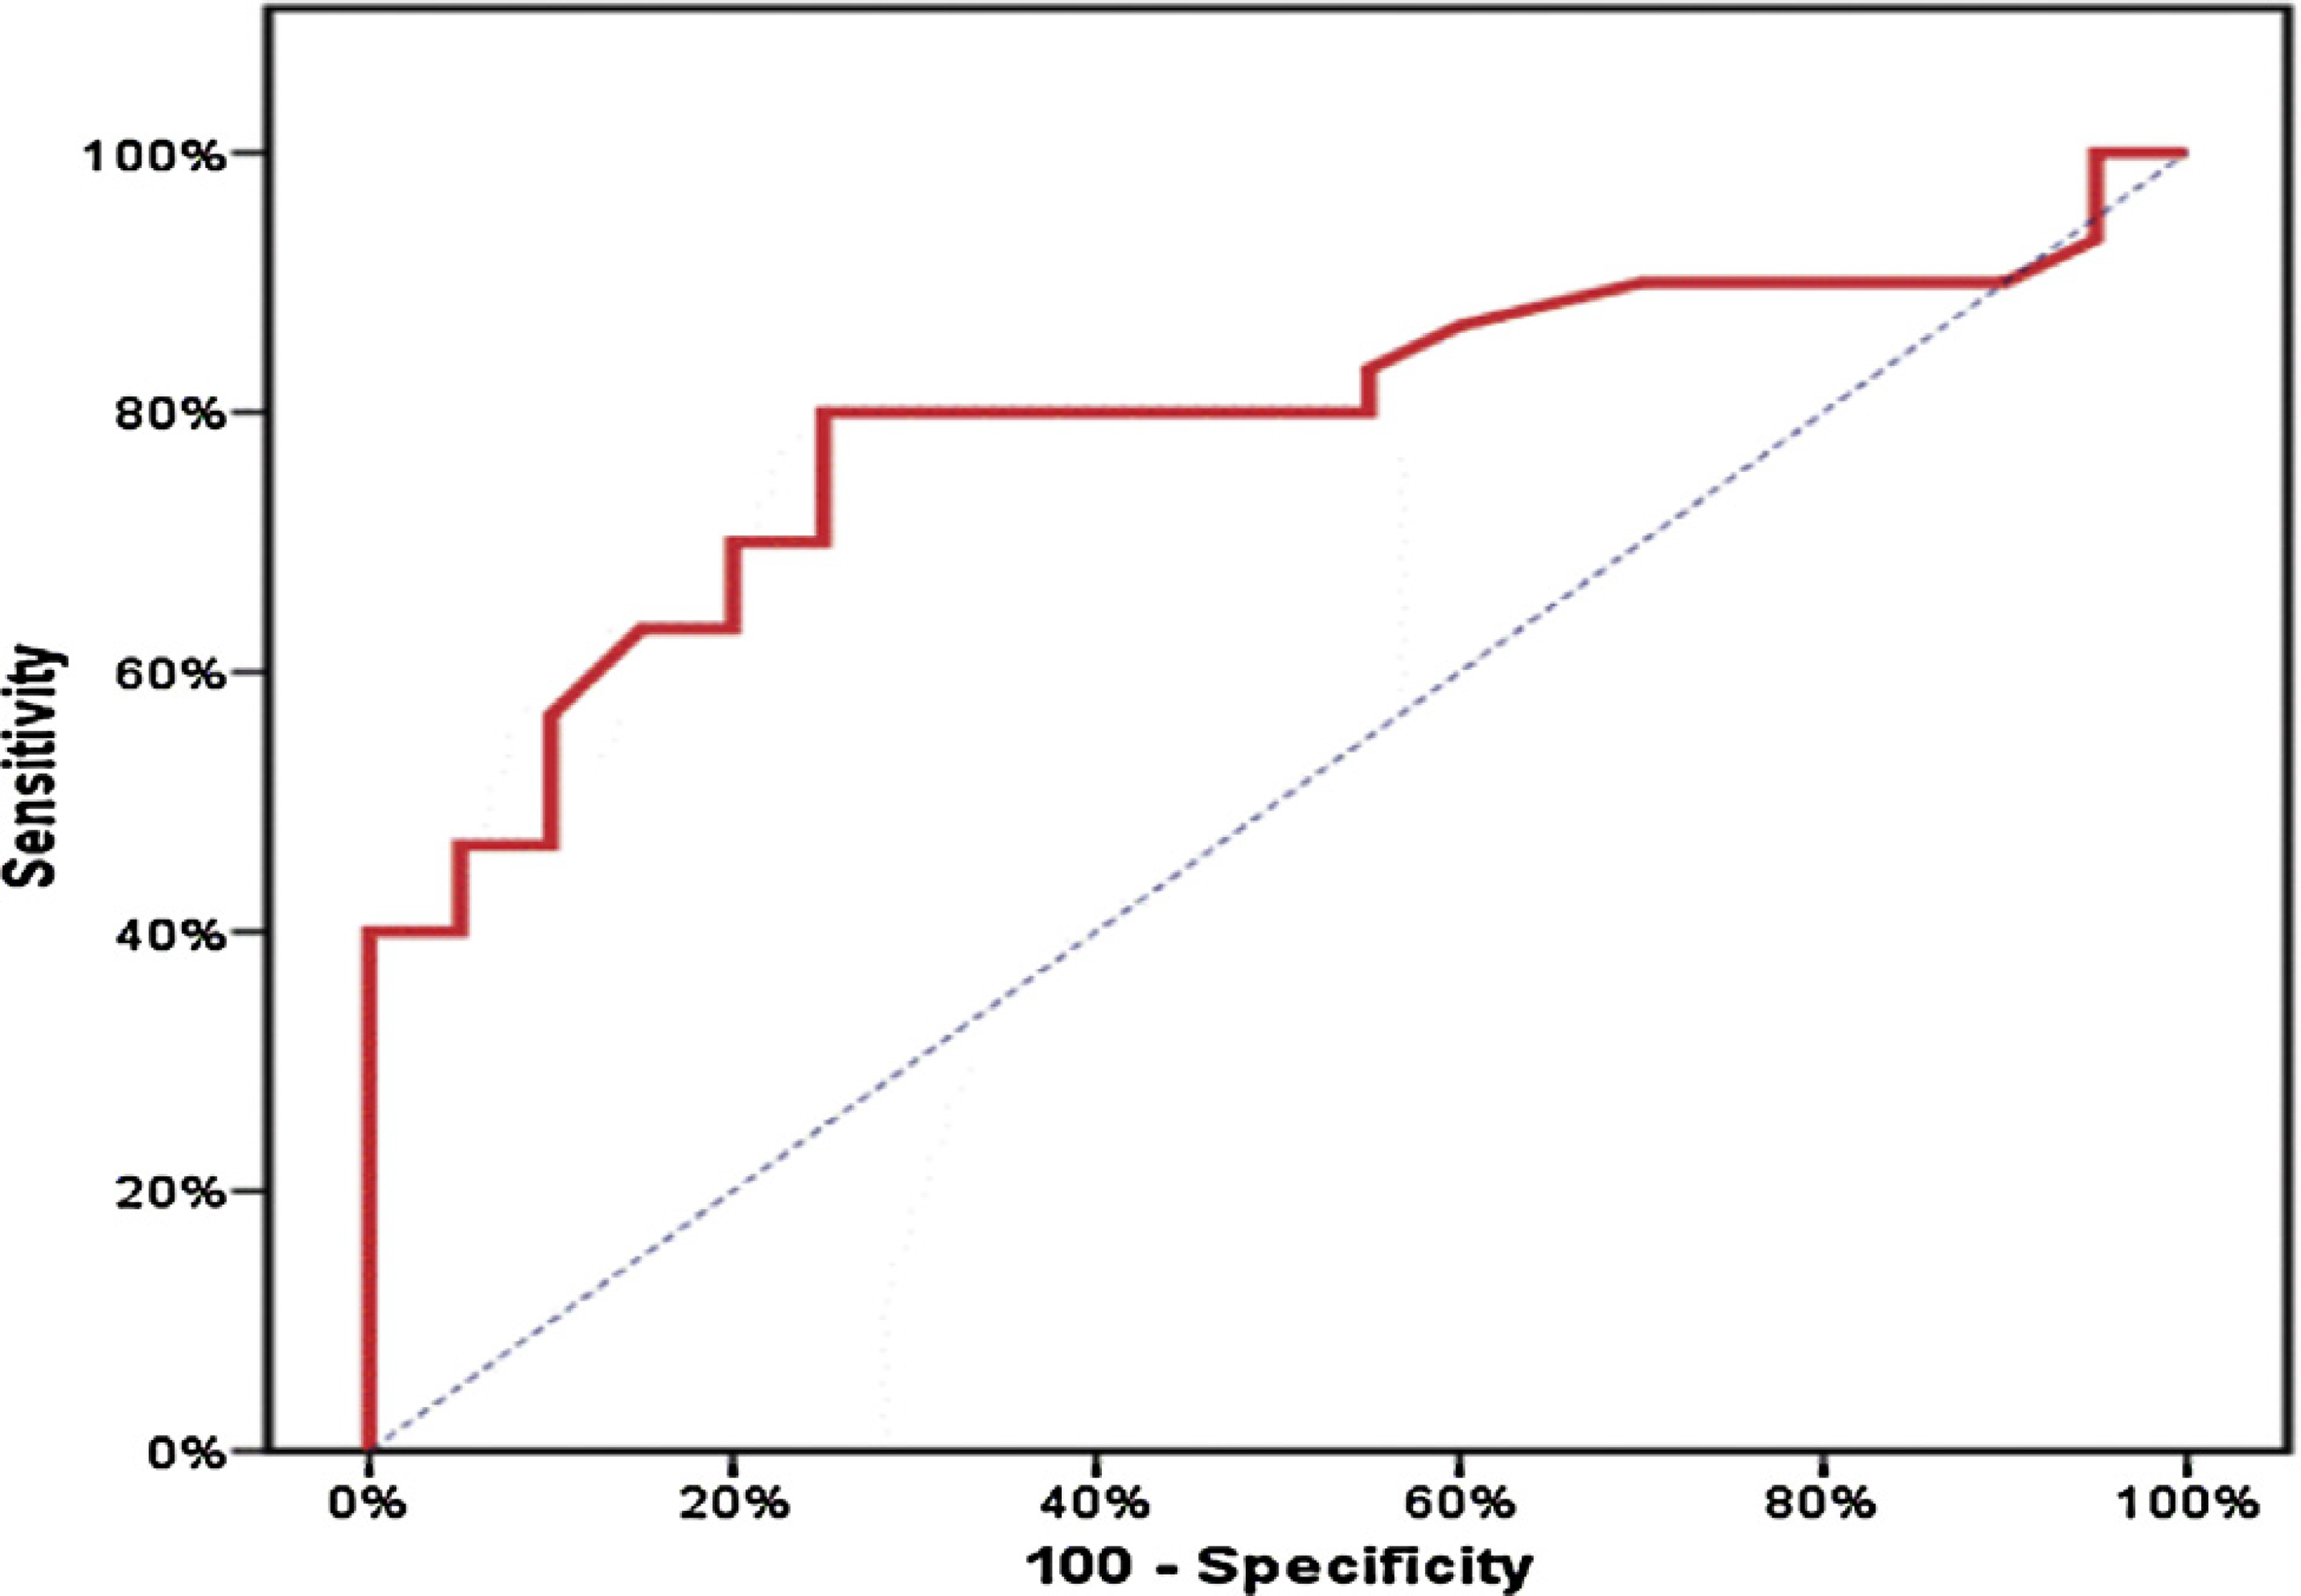
Fig. 1 shows a boxplot demonstrating the relation between the two studied groups according to serum miR-16 expression. Fig. 2 shows a Receiver Operating Characteristic (ROC) curve for serum expression of miR-16 in the UC patients’ group, it showed a significant relation between serum expression of miR-16 and the diagnosis of UC with an area under the curve of 0.78, and p-value of 0.001. It showed sensitivity of 80% with specificity of 75%, PPV of 82.8 and NPV of 71.4. These data were shown in (Table 7).
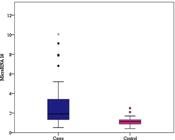
Comparison between the patients’ group and the control group according to serum miRNA-16 expression using quantitative real time PCR.
A receiver operating characteristic curve (ROC curve) for serum miR-16 expression to predict cases (from control).
Correlation of serum miR-16 expression with disease endoscopic extent showed non-significant relation, the median of serum miR-16 expression was 1.61 for proctitis, 1.76 for left sided colitis and 2.50 for extensive colitis with p-value = 0.656 (Table 8).
Relation between serum miR-16 expression in UC patients in the study and disease endoscopic extent.
Serum miR-16 expression was correlated with different clinical (Truelove and Witts criteria), laboratory (fecal calprotectin) and endoscopic (UCEIS) indices of disease activity and severity. The study showed no relation between serum miR-16 expression and disease severity according to Truelove and Witts criteria. The median of serum miR-16 expression was 1.73 for mild disease, 1.51 for moderate disease and 2.97 for severe disease with p-value = 0.571 (Table 9).
Relation between serum miR-16 expression in UC patients in the study and disease severity according to truelove and witts criteria.
Correlation of serum miR-16 expression with fecal calprotectin showed non-significant relation with p value of 0.134 (Table 10).
Relation between serum miR-16 expression in UC patients in the study and fecal calprotectin.
Correlation of the total score of Ulcerative Colitis Endoscopic Index of Severity (UCEIS) for the patients in the current study with serum miR-16 expression showed also a non-significant relation with p-value of 0.900 (Table 11).
Relation between serum miR-16 expression in UC patients in the study and the total UCEIS score.
Discussion
Our current study showed increased expression of miR-16 in serum of UC patients’ group compared to healthy control group. Median miR-16 expression was 1.91 in UC patients’ group and 1.13 for the control group with a significant difference between both groups with p-value ≤0.05. Comparison of peripheral blood miR expression in UC patients relative to healthy controls were conducted in several studies. Wu et al., found increased expression of miRs-28-5p, -151-5p, -199a-5p, -340 and miRplus-E1271 in the peripheral blood of patients with active UC. They also found that miRs-103-2, -362-3p and -532-3p were increased in the peripheral blood of inactive and active UC patients. One miRNA, miR-505, showed decreased expression in the peripheral blood of active and inactive UC patients.2121 Wu F, Guo NJ, Tian H, Marohn M, Gearhart S, Bayless TM, et al. Peripheral blood microRNAs distinguish active ulcerative colitis and Crohn’s disease. Inflamm Bowel Dis. 2011;17:241-50. Duttagupta et al., fractionated peripheral blood of their patients into microvesicle, peripheral blood mononuclear cell and platelet fractions and analyzed miR expression in these fractions. High expression in UC of miR-188-5p, miR-422a, miR-378, miR-500, miR-501-55, miR-769-5p, and miR-874 were seen among the 31 candidates within the platelet fraction of their cases, in UC.2222 Duttagupta R, DiRienzo S, Jiang R, Bowers J, Gollub J, Kao J, et al. Genome-wide maps of circulating miRNA biomarkers for ulcerative colitis. PLoS One. 2012;7:e31241. Iborra et al., found twelve miRNAs (miR-127-3p, miR-491-5p, miR-18a, miR-145, let-7b, miR-185, miR-29c, miR-19b, miR-20b, miR-106a, miR-17, and miR-222) with high expression and one (miR-135a) showed low expression in serum of UC patients in their study.2323 Iborra M, Bernuzzi F, Correale C, Vetrano S, Fiorino G, Beltrán B, et al. Identification of serum and tissue micro-RNA expression profiles in different stages of inflammatory bowel disease. Clin Exp Immunol. 2013;173:250-8. Netz et al. have identified 2 plasma miRNAs (miR-598, miR-642) that differentiated Crohn’s colitis from UC, that were consistently different between their patients’ groups.2424 Netz U, Carter J, Eichenberger MR, Feagins K, Galbraith NJ, Dryden GW, et al. Plasma microRNA profile differentiates Crohn’s colitis from ulcerative colitis. Inflamm Bowel Dis. 2017;24:159-65. As regards miR-16, Paraskevi et al. identified that 6 miRs (miR-16, miR-21, miR-28-5p, miR-151-5p, miR-155 and miR-199a-5p) were elevated in UC blood samples compared to healthy controls. Of the miRs tested, miR-16 and miR-199a-5p were elevated in both UC and CD as compared to healthy controls.2525 Paraskevi A, Theodoropoulos G, Papaconstantinou I, Mantzaris G, Nikiteas N, Gazouli M. Circulating MicroRNA in inflammatory bowel disease. J Crohns Colitis. 2012;6:900-4. Recently, Konstantinidis et al.2626 Konstantinidis AO, Pardali D, Adamama-Moraitou KK, Gazouli M, Dovas CI, Legaki E, et al. Colonic mucosal and serum expression of microRNAs in canine large intestinal inflammatory bowel disease. BMC Vet Res. 2020;16:69. found significantly increased relative expression of miR-16, miR-21, miR-122 and miR-147 in the colonic mucosa and serum of dogs with large intestinal IBD.2626 Konstantinidis AO, Pardali D, Adamama-Moraitou KK, Gazouli M, Dovas CI, Legaki E, et al. Colonic mucosal and serum expression of microRNAs in canine large intestinal inflammatory bowel disease. BMC Vet Res. 2020;16:69. miR-16 was also reported to be elevated in peripheral blood of patients with rheumatoid arthritis, pointing to a possible relation of miR-16 in the pathophysiologic mechanism common to autoimmune disorders and IBDs.2525 Paraskevi A, Theodoropoulos G, Papaconstantinou I, Mantzaris G, Nikiteas N, Gazouli M. Circulating MicroRNA in inflammatory bowel disease. J Crohns Colitis. 2012;6:900-4.
Not only serum expression of miRNAs that was used to indicate the disease but also tissue miRNA is also used. Valmiki et al., have found that inflamed colonic mucosa differs from the non-inflamed one in miRNA profile by real time PCR analysis (miR-125b, miR-223, miR-138, and miR-155).2727 Valmiki S, Ahuja V, Paul J. MicroRNA exhibit altered expression in the inflamed colonic mucosa of ulcerative colitis patients. World J Gastroenterol. 2017;23:5324-32. Polytarchou et al. provided evidence for colonic miR-214, in UC and Colitis Associated Caner (CAC) as it is a powerful suppressor of nuclear factor (NF)-kB phosphorylation.2828 Polytarchou C, Hommes DW, Palumbo T, Hatziapostolou M, Koutsioumpa M, Koukos G, et al. MicroRNA214 is associated with progression of ulcerative colitis, and inhibition reduces development of colitis and colitis-associated cancer in mice. Gastroenterology. 2015;149:981-92.e11.
We correlated serum miR-16 in the UC patients’ group with disease extent, non-significant relation (p-value = 0.656) was present. Median serum miR-16 expression was 1.61 for proctitis, 1.76 for left sided colitis and 2.50 for extensive colitis. Correlation between serum miR-16 in the UC patients’ group with the disease severity according to Truelove and Witts criteria showed also a non-significant relation (p-value = 0.571). Median serum miR-16 expression was 1.73 for mild disease, 1.51 for moderate disease and 2.97 for severe disease. Non-significant relation was also noted with both fecal calprotectin and total UCEIS score. Serum miR-223-3p, miR-4454, miR23a-3p, and miR320e levels correlated with UC disease activity better than serum C-reactive protein levels as reported Polytarchou et al.2929 Polytarchou C, Oikonomopoulos A, Mahurkar S, Touroutoglou A, Koukos G, Hommes DW, et al. Assessment of circulating micrornas for the diagnosis and disease activity evaluation in patients with ulcerative colitis by using the nanostring technology. Inflamm Bowel Dis. 2015;21:2533-9. Wang et al. found a positive correlation between the level of serum miR-223 and ESR, CRP, and UCEIS which are indicators of disease activity in UC.3030 Wang H, Zhang S, Yu Q, Yang G, Guo J, Li M, et al. Circulating MicroRNA223 is a new biomarker for inflammatory bowel disease. Medicine (Baltimore). 2016;95:e2703.
Conclusion
From the current study, it can be concluded that miR-16 is increasingly expressed in serum obtained from patients with UC but with no significant relation to disease extent, activity and severity.
-
Ethics approval and consent to participateThe study was approved by the Alexandria university committee of medical ethics (date of approval: 14/3/2018, approval ID: 0201082), written informed consent from all subjects was obtained.
Acknowledgments
The authors would like to acknowledge the efforts of the medical staff members of Gastroenterology unit at Alexandria main university hospital including the nurses and house officers whose efforts were an essential part of this study. We also acknowledge the technicians at the molecular biology laboratory at Alexandria main university hospital for their kind effort.
References
-
1Matsuoka K, Kobayashi T, Ueno F, Matsui T, Hirai F, Inoue N, et al. Evidence-based clinical practice guidelines for inflammatory bowel disease. J Gastroenterol. 2018;53:305-53.
-
2Himmel ME, Hardenberg G, Piccirillo CA, Steiner TS, Levings MK. The role of T-regulatory cells and Toll-like receptors in the pathogenesis of human inflammatory bowel disease. Immunology. 2008;125:145-53.
-
3Hibi T, Aiso S, Yoshida T, Watanabe M, Asakura H, Tsuru S, et al. Anti-colon antibody and lymphocytophilic antibody in ulcerative colitis. Clin Exp Immunol. 1982;49:75-80.
-
4Bousvaros A, Zurakowski D, Duggan C, Law T, Rifai N, Goldberg NE, et al. Vitamins A and E serum levels in children and young adults with inflammatory bowel disease: effect of disease activity. J Pediatr Gastroenterol Nutr. 1998;26:129-35.
-
5Levenstein S, Prantera C, Varvo V, Scribano ML, Andreoli A, Luzi C, et al. Stress and exacerbation in ulcerative colitis: a prospective study of patients enrolled in remission. Am J Gastroenterol. 2000;95:1213-20.
-
6Zhai H, Huang W, Liu A, Li Q, Hao Q, Ma L, et al. Current smoking improves ulcerative colitis patients’ disease behaviour in the northwest of China. Prz Gastroenterol. 2017;12:286-90.
-
7Judaki A, Hafeziahmadi M, Yousefi A, Havasian MR, Panahi J, Sayehmiri K, et al. Evaluation of dairy allergy among ulcerative colitis patients. Bioinformation. 2014;10:693-6.
-
8Sofia MA, Rubin DT, Hou N, Pekow J. Clinical presentation and disease course of inflammatory bowel disease differs by race in a large tertiary care hospital. Dig Dis Sci. 2014;59:2228-35.
-
9Falcone RA, Lewis LG, Warner BW. Predicting the need for colectomy in pediatric patients with ulcerative colitis. J Gastrointest Surg. 2000;4:201-6.
-
10Levine JS, Burakoff R. Extraintestinal manifestations of inflammatory bowel disease. Gastroenterol Hepatol (NY). 2011;7:235-41.
-
11Broomé U, Chapman RW. Ulcerative colitis: sclerosing cholangitis today, cancer tomorrow?. Gut. 1997;41:571-2.
-
12Turelove SC, Witts LJ. Cortisone in ulcerative colitis; final report on therapeutic trial. Br Med J. 1955;2:1041-8.
-
13Collins P, Rhodes J. Ulcerative colitis: diagnosis and management. BMJ. 2006;333:340-3.
-
14Mak WY, Buisson A, Andersen MJ, Lei D, Pekow J, Cohen RD, et al. Fecal calprotectin in assessing endoscopic and histological remission in patients with ulcerative colitis. Dig Dis Sci. 2018;63:1294-301.
-
15Passos MAT, Chaves FC, Chaves-Junior N. The importance of colonoscopy in inflammatory bowel diseases. Arq Bras Cir Dig. 2018;31:e1374.
-
16Deepak P, Bruining DH. Radiographical evaluation of ulcerative colitis. Gastroenterol Rep (Oxf). 2014;2:169-77.
-
17Macfarlane LA, Murphy PR. MicroRNA: biogenesis, function and role in cancer. Curr Genomics. 2010;11:537-61.
-
18Chapman CG, Pekow J. The emerging role of miRNAs in inflammatory bowel disease: a review. Therap Adv Gastroenterol. 2015;8:4-22.
-
19Sterling CH, Veksler-Lublinsky I, Ambros V. An efficient and sensitive method for preparing cDNA libraries from scarce biological samples. Nucleic Acids Res. 2015;43:e1.
-
20Travis SP, Schnell D, Krzeski P, Abreu MT, Altman DG, Colombel JF, et al. Reliability and initial validation of the ulcerative colitis endoscopic index of severity. Gastroenterology. 2013;145:987-95.
-
21Wu F, Guo NJ, Tian H, Marohn M, Gearhart S, Bayless TM, et al. Peripheral blood microRNAs distinguish active ulcerative colitis and Crohn’s disease. Inflamm Bowel Dis. 2011;17:241-50.
-
22Duttagupta R, DiRienzo S, Jiang R, Bowers J, Gollub J, Kao J, et al. Genome-wide maps of circulating miRNA biomarkers for ulcerative colitis. PLoS One. 2012;7:e31241.
-
23Iborra M, Bernuzzi F, Correale C, Vetrano S, Fiorino G, Beltrán B, et al. Identification of serum and tissue micro-RNA expression profiles in different stages of inflammatory bowel disease. Clin Exp Immunol. 2013;173:250-8.
-
24Netz U, Carter J, Eichenberger MR, Feagins K, Galbraith NJ, Dryden GW, et al. Plasma microRNA profile differentiates Crohn’s colitis from ulcerative colitis. Inflamm Bowel Dis. 2017;24:159-65.
-
25Paraskevi A, Theodoropoulos G, Papaconstantinou I, Mantzaris G, Nikiteas N, Gazouli M. Circulating MicroRNA in inflammatory bowel disease. J Crohns Colitis. 2012;6:900-4.
-
26Konstantinidis AO, Pardali D, Adamama-Moraitou KK, Gazouli M, Dovas CI, Legaki E, et al. Colonic mucosal and serum expression of microRNAs in canine large intestinal inflammatory bowel disease. BMC Vet Res. 2020;16:69.
-
27Valmiki S, Ahuja V, Paul J. MicroRNA exhibit altered expression in the inflamed colonic mucosa of ulcerative colitis patients. World J Gastroenterol. 2017;23:5324-32.
-
28Polytarchou C, Hommes DW, Palumbo T, Hatziapostolou M, Koutsioumpa M, Koukos G, et al. MicroRNA214 is associated with progression of ulcerative colitis, and inhibition reduces development of colitis and colitis-associated cancer in mice. Gastroenterology. 2015;149:981-92.e11.
-
29Polytarchou C, Oikonomopoulos A, Mahurkar S, Touroutoglou A, Koukos G, Hommes DW, et al. Assessment of circulating micrornas for the diagnosis and disease activity evaluation in patients with ulcerative colitis by using the nanostring technology. Inflamm Bowel Dis. 2015;21:2533-9.
-
30Wang H, Zhang S, Yu Q, Yang G, Guo J, Li M, et al. Circulating MicroRNA223 is a new biomarker for inflammatory bowel disease. Medicine (Baltimore). 2016;95:e2703.
Publication Dates
-
Publication in this collection
14 Aug 2020 -
Date of issue
Jul-Sep 2020
History
-
Received
12 Apr 2020 -
Accepted
13 May 2020