Abstract
Digital image analysis was used to fully characterize the microstructure of human dentin. With the automatic routine implemented, field and region parameters related to human dentin characterization were obtained in significant statistical quantities. The results obtained for the density, area fraction, distance between neighbors, tilt angle, area and average diameter of the dentinary tubules are presented for unerupted third molars. The results, grouped per class of dentin or per tooth, are discussed in the light of the previous data found on the literature.
dentin; microstructural characterization; image analysis
REGULAR ARTICLES
Evaluation of microstructural parameters of human dentin by digital image analysis
Eduardo Tavares Coutinho; José Roberto Moraes dAlmeida* * e-mail: dalmeida@dcmm.puc-rio.br ; Sidnei Paciornik
Materials Science and Metallurgy Department, Pontifícia Universidade Católica do Rio de Janeiro PUC-Rio, Rua Marquês de São Vicente, 225, Gávea, 22453-900 Rio de Janeiro - RJ, Brazil
ABSTRACT
Digital image analysis was used to fully characterize the microstructure of human dentin. With the automatic routine implemented, field and region parameters related to human dentin characterization were obtained in significant statistical quantities. The results obtained for the density, area fraction, distance between neighbors, tilt angle, area and average diameter of the dentinary tubules are presented for unerupted third molars. The results, grouped per class of dentin or per tooth, are discussed in the light of the previous data found on the literature.
Keywords: dentin, microstructural characterization, image analysis
1. Introduction
Human dentin constitutes, in a large majority of cases, the main part of tooth-restoration interfaces1,2. Dentin has, however, a very heterogeneous structure that varies both in composition and microstructure along the teeth3,4 and presents extremely hostile conditions for adhesion, contributing to the low reliability of many restorations. The main structural features of dentin are the dentin tubules that extend through the entire dentin thickness, but vary both in number and diameter along the thickness of the dentin. Therefore, the complete characterization of the morphological features of the dentin and its role on the in-service life of restorations is an important step towards understanding why some restorations fail much earlier than others even if the clinical procedures are maintained as constant as possible.
A systematic procedure to quantify field and region parameters of the dentin, based on digital image analysis was developed and presented in previous works5,6. It was shown how to avoid artifacts generated during preparation of the dentin surfaces to be analyzed, such as residues from the smear layer left inside the tubules or cracks due to dehydration, as well as artifacts coming from merging of adjacent tubules. A typical image obtained after digital processing is shown in Figure 1. The method proved to be robust enough to treat the varying characteristics of the dentin from individual to individual and from one position to the other at the same tooth. Moreover, the procedure is fast and enables the full characterization of one tooth, analyzing between 4000 and 7000 tubules per tooth, in less than 8 minutes in a typical computer. With the use of this automated procedure a systematic classification of the dentin as a function of the shape and distribution of the dentin tubules was done7, opening the possibility to quantitatively describe relevant microstructural parameters of human dentin. In this work, the microstructural parameters from unerupted third molars of young adults were determined, and the results obtained, grouped per class of dentin or per tooth, are presented and discussed.
2. Experimental methods
The analysis was performed on 7 unerupted third molars from young adults with ages ranging from 18 to 25 years old, after the explicit consent of the donors. Just after extraction, the teeth were stored in an aqueous solution of 0.15 M NaCl saturated in thymol at 4 °C for less than 1 month. They were then embedded in an epoxy block to facilitate the cutting, grinding and polishing operations. Polishing went down to 0.05 µm alumina powder suspension, and a high gloss flat surface of the occlusal dentinary surface of each tooth was obtained. The samples were subsequently fixed in glutaraldehyde, dehydrated in ascending grades of ethanol and fixed with colloidal graphite with isopropanol on an aluminum base just before being gold sputtered for scanning electron microscopy analysis. The detailed description of the methods of preparation of the specimens is done elsewhere5.
The following microstructural parameters were measured through the image processing and analysis method developed, once the images were correctly segmented and post-processed6 to discriminate the tubules with their true numbers, size and shape:
-
Field Parameters
- Number of tubules per unit area (density); and
- Volume fraction of tubules.
-
Region Parameters
- Area of each tubule and its associated diameter;
- Tilt angle of the tubules in respect to the plane of cut; and
- Average distance of each tubule to its nearest neighbors.
The description of each of the parameters measured was done in detail previously5, and their choice was based on their possible correlation with the phenomenon of adhesion on human dentin. The reader is referred to previous works for more detailed description of the characteristics and differences between field and region parameters8,9.
3. Experimental Results and Discussion
Tables 1 and 2 show, respectively, the values of the complete set of field and region parameters measured. It is interesting to note that statistically significant differences, p < 0.05, occurred between every surface analyzed for at least two or more of the measured parameters. Moreover, very high standard deviations were obtained, pointing to large variations between teeth, and inside a single tooth.
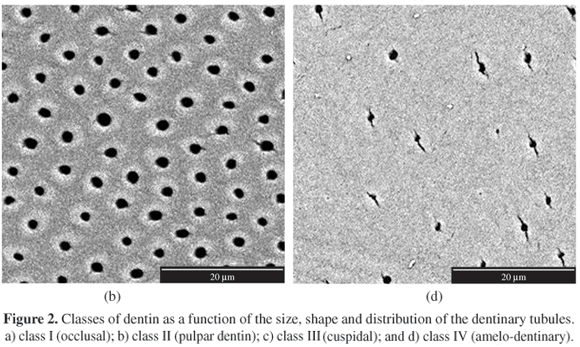
The comparison of these values with previously published data without further refinement can be misleading, because dentin tubules vary both in form and composition along the dentin thickness, and from point to point on a given tooth. Therefore, one has to be extremely careful from exactly where data are being collected. From the digital image analysis it was possible to classify the occlusal dentinary surface analyzed in this work in four classes, depending on the number and shape of the dentinary tubulus7, namely: class I) At the central region of the teeth, under the main groove, medium to large regularly spaced tubules of circular shape are observed, Figure 2a. The number of tubules per unit area of this region is small, thus increasing the inter-tubular dentin fraction; class II) The regions under the cusps and near the pulp horns are characterized by large circular tubules, Figure 2b. In these regions the number of tubules is very high; class III) The main fraction of dentin, between the grooves and the cusps, is characterized by a large number of small to medium, regularly spaced, tubules, Figure 2c. In this region the projected shapes of the tubules vary from circular to elliptical; and class IV) Peripheral regions near the dentin-enamel junction show a small number of small tubules, irregularly distributed and elliptically shaped, Figure 2d. This region is by far the less homogeneous, and wide differences are found in respect to the shape, size and distribution of the tubules.
With this classification each dentinary surface was divided in regions of similar dentin tubule distribution and shape7. A major and well-known fact reported on the literature becomes very clear from the classification showed in Figure 2, i.e., depending on where a restoration is being anchored in dentin, very different substrates for adhesion are present. This sole observation is responsible for a significant portion of the very high differences observed for the "in-service" life of restorations.
Tables 3 and 4 show the values of the measured parameters grouped by class of dentin. It can be seen that all parameters but the tilt angle vary depending on the class analyzed. The standard deviations are still large, denoting the characteristic variability of the dentin microstructure. The data in Tables 3 and 4 show, however, clear tendencies of behavior. Class II (pulpar dentin) has higher values of the field parameters than any other class. Therefore, the average distance between tubules, that is inversely dependent on field parameters10, is the shortest. The dentin tubules of this class have also the larger diameters. All these aspects indicate that the formation of tags11,12 must play a definite role to promote a good adhesion by mechanical interlock on class II dentin.
The amelo-dentinary dentin (class IV), on the other hand, shows the opposite trend. A low density of tubules, that are more widely spaced and have smaller diameter may difficult the formation of tags. Formation of a hybrid layer due to the penetration of the adhesive on the surface of the collagen-rich intertubular dentin may be, therefore, the leading adhesion mechanism for this region of dentin.
On the following the major parameters obtained are discussed in more detail.
3.1. Density
Figure 3 shows the results of the density of dentinary tubules for each tooth, and for each of the classes of dentinary surface. The average density of tubules obtained falls within the range of values reported on the literature3,13. However, as pointed out by Schilke and coworkers14 the large range of values usually reported - from 5,000 to 90,000 tubules/mm2 - can be due to the small number of areas analyzed per tooth or due to the analysis of different kinds of teeth. The figures reported in this work certainly eliminate both of these sources of uncertainty, since approximately 6000 tubules were counted per tooth, and only unerupted third molars were analyzed.
Figure 3a shows that two groups of teeth with statistically different results were found. At the box plot shown in this and following figures, the boxes are limited by the first and third quartile and crossed by a solid line indicating the value of the median. The bars extend between 5 and 95% of the values. The symbol "o" denotes the average value, and "'" and "" represent the outliers between 1 and 99%, and their minimum and maximum values, respectively. Figure 3b shows the data from each tooth grouped into the four classes of dentinary tubules.
What can be extracted from Figure 3 is that the density of dentinary tubules varies inside a single tooth, Figure 3b, and to a lesser extend from tooth to tooth, Figure 3a, as already observed on the literature3.
The results in Figure 3b agree with previous data that show a decrease on the number of tubules from the pulpar dentin to the amelo-dentinary line3,14,15. The value obtained for the overall average number of tubules found, Table 1, also agrees with previous published data from occlusal dentinary surfaces15.
The digital image analysis performed allows further enhancement of the analysis of the density of dentin tubules by calculating the average number of tubules in each class for all teeth, Figure 4a, and comparing the average number of tubules per class in each tooth, Figure 4b. This analysis gives an insight on the uniformity of a class of dentin, and on the homogeneity of teeth.
Figure 4a shows that classes I to III have statistically different results between teeth, but the overall tendency observed in Figure 3a was maintained (teeth #1 and #6 showed higher dentinary tubules density). Class IV, however, did not show statistically significant differences between teeth.
The greater number of tubules found for teeth #1 and #6 may indicate that a different depth of dentin is being analyzed. This is an important point, due to its intrinsic consequences both on clinical practice and on the analysis of experimental mechanical data on adhesion of dentin. As mentioned before, restorations often show very different in-service life even when the clinical procedures are as controlled as possible. From the morphology of the dentin classes showed in Figure 2 it is readily apparent that a different adhesion mechanism will prevail depending on which class predominates. The results in Figure 4a show how different a substrate can be depending on the depth of the restoration. In addition, these results can, in fact, explain the large variation of data with low statistical significance, usually obtained from adhesive tests of dentin11,13,16. From the data in Figure 4a one can ask if an important fraction of the scatter in the published data is not directly related to different substrates being tested. In other words, to validate the results from the mechanical tests, dentin has to be characterized before the tests, in order to verify which adhesion mechanism should be expected.
The results shown in Figure 4b corroborate the previous data. They show the variability of the number of tubules per tooth, as a function of the position on the tooth surface.
3.2. Volume fraction
The correlation between area and volume fraction was one of the first established in stereology17. Therefore, the volume fraction of the dentinary tubules was obtained from the area fraction determined by digital analysis, after the proper transformations.
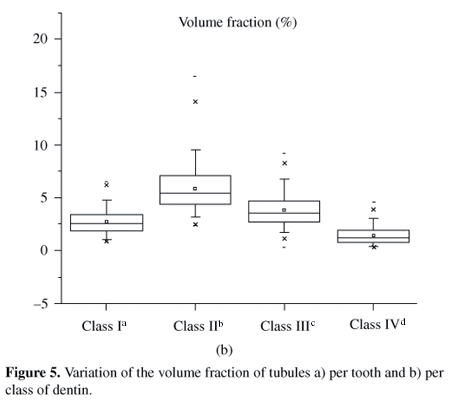
The volume fraction of dentinary tubules, Vt, is an important microstructural parameter for dentin, and it is known to influence dentin adhesive joints15,18. In fact, even a term, "solid dentin", was coined to classify dentin with low volume fraction of tubules18, because Vt is considered as a main parameter to obtain good adhesion. Figure 5a shows the variation of Vt per tooth. Since Vt has a direct relationship with the density of tubules, the same overall trend observed in Figure 4a follows, although the values vary within a narrower range.
The values of Vt measured in this work were smaller than values reported in the literature3,12-14,19. Nevertheless, in those works acid solutions with varying concentrations were usually used to remove the smear layer. As pointed out by the authors, this treatment might have influenced their results, increasing the area and volume fraction occupied by the dentinary tubules, as well as increasing their average diameter.
The variation of the volume fraction of tubules as a function of the dentinary classes, Figure 5b, presents the same tendencies shown by the density. Analysis of Vt per class inside every tooth, and comparison of the classes for every tooth showed the same overall behavior discussed earlier for density. Therefore, they will not be presented here for the sake of shortness.
3.3. Area and diameter
The average area of dentinary tubules is a microstructural parameter seldom referred to in the literature. Probably one of the causes of this lack of data is the difficulty and uncertainty of the measurements by a human operator directly from micrographs. Using digital analysis procedure, however, this parameter can be easily, and precisely, determined.
An indirect mode used by several authors to obtain the average size of dentinary tubules is based on the measure of their diameters3,14,15. This method has, however, some disadvantages as for example the consideration that all tubules have perfectly circular sections. From Figure 2 it can be readily seen that depending on the region under analysis, this can be a crude approximation. Using the Feret diameters5,8, one can also avoid the common edge and tilt artifacts that can generate wrong values for the dentinary tubules area.
The values obtained are shown in Figure 6. Although the mean values do not vary very much, statistically significant differences were found between teeth. The data shown in Figure 6a for tooth #2 agrees very well with the hypothesis that the depth of cut for this tooth was different from the others.
It is common word in the literature to correlate the size of the tubules with the proximity of dentin to the pulp. The larger the area, the closest is the dentin to the dentinary pulp14. The results for tooth #6, nevertheless, do not follow this behavior. Therefore, from the present set of experimental data, it appears that the correlation of depth of dentin with area of dentinary tubules is not straightforward.
With a confident determination of the area of the tubules, an average diameter can be easily calculated. In fact, this is one of the most used microstructural parameters when one describes the morphology of human dentin3,14,15. As expected the results here obtained follow the same general trend described above for the average area of dentinary tubules, and the box plots relative to the variation of the diameter per tooth and per class of dentin will be not show here, and the reader is referred to another work to see more details of the evaluation made5. In short, the average diameter was about 0.8 mm for classes I to III and about 0.6 mm for class IV. This result is consistent with the microstructural aspects observed in Figure 2.
3.4. Distance between tubules
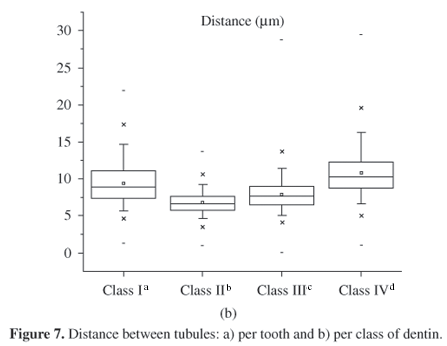
The average distance between tubules, dbt, is not a commonly analyzed microstructural parameter on human dentin. However, regarding dentin as a composite material, it is clear that this microstructural feature plays an important role on the mechanical response of dentin. Figure 7 shows that the distance between tubules follows an opposite trend in relationship to both density and volume fraction. Therefore, teeth #1 and #6 have smaller values of dbt. Figure 7a also shows the heterogeneity of dentin, since dbt has statistically different values for 5 among 7 of the teeth analyzed. The density and volume fraction, that are field parameters, have only two statistically different groups, see Figures 3a and 5a. The same opposite trend in respect to the behavior of field parameters was observed when the dentin classes were compared, Figure 7b.
The same heterogeneity is shown in the analysis of dbt per class, Figure 8a, with five out of seven statistically different results per class when the teeth are compared. The differences between the classes inside a single tooth is also remarkable, Figure 8b.
3.5. Tilt angle
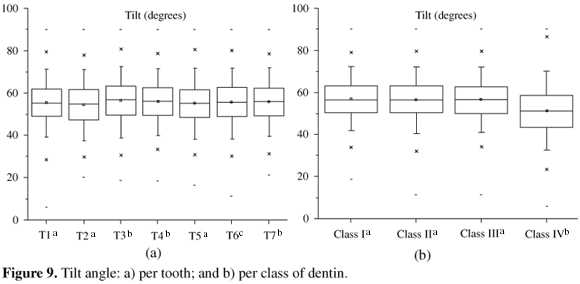
The relevance of the tilt angle of dentinary tubules on the adhesion of human dentin was recently highlighted20. Quantitative data of tilt angle values are, however, yet scarce due to the many difficulties to measure this parameter without an automated tool. The results obtained are shown in Figure 9. Although statistically significant differences were found between teeth, Figure 9a, when one compares the dentin classes, Figure 9b, the tilt angle is constant but for class IV, the amelo-dentinary dentin, that shows the smaller values. It must be noted, however, that the magnification used in this work was chosen to encompass a representative number of tubules per field, and not to reveal the size and shape of each tubule with high accuracy. Thus, the measurements of the minimum equivalent ellipse diameter, used for the tilt measurements, might contain errors as high as 25%, for the smallest tubules.
4. Conclusions
The systematic analysis performed using digital image analysis, generates a large number of data and, therefore, raises the confidence on the several microstructural parameters that characterize human dentin. The use of an automated procedure also enables a fast manipulation of data that helps the analysis and interpretation of the measured parameters.
Quantitative values for the density, volume fraction, mean distance between neighbors, tilt angle, and area and average diameter of dentinary tubules were determined with statistic significance within a single tooth, and between teeth.
The results obtained showed that the average density of dentinary tubules has a marked variation inside a single tooth but, for the unerupted third molars analyzed in this work, the variation between teeth was smaller, indicating homogeneity of teeth microstructure. Near the amelo-dentinary line, the density of dentinary tubules is almost constant for all teeth.
The volume fraction of dentinary tubules shows the same overall behavior of the density, but is less influenced by the depth of the dentin under analysis.
The tilt angle was almost constant irrespective of the class of dentin, and showed homogeneity between teeth.
The results obtained also show that field parameters are less influenced by the non-homogeneous microstructure of dentin than region parameters. Therefore, they would be preferable when one seeks for the average behavior of a microstructural parameter to characterize the human dentin.
Acknowledgments
The financial support of Brazilian agencies CNPq and FAPERJ is gratefully acknowledged, as well as the invaluable technical support of Maria de Fátima S. Lopes at the SEM (in memoriam).
Received: December 20, 2006; Revised: May 15, 2007
- 1. Swift EJ, Perdigão J, Heymann HO. Bonding to enamel and dentin: a brief history and state of the art. Quintessence International 1995; 26(2):95-110.
- 2. Brantley CF, Bader JD, Shugars DA, Nesbit SP. Does the cycle of rerestoration lead to larger restorations? Journal of the American Dental Association 1995; 126(10):1407-1413.
- 3. Garberoglio R, Brannstrom M. Scanning electron microscopic investigation of human dentinal tubules. Archives of Oral Biology 1976; 21(6):355-362.
- 4. Pashley EL, Comer RW, Parry EE, Pashley DH. Amalgam buildups: shear strength and dentin sealing properties. Operative Dentistry 1991; 16(3):82-89.
- 5. Coutinho ET. Microstructural characterization of human dentin and adhesion aspects [MSc Thesis]. Rio de Janeiro: Pontifícia Universidade Católica do Rio de Janeiro; 2001. (in Portuguese)
- 6. Coutinho ET, dAlmeida JRM, Paciornik S, de-Deus G. Digital Image Analysis Applied to the Microstructural Characterization of Human Dentin. Brazilian Oral Research Submitted for publication
- 7. Coutinho ET, dAlmeida JRM, Paciornik S. The use of scanning electron microscopy and microanalysis to classify dentin. In: Piston D, editor. Proceedings of the VII Interamerican Congress on Electron Microscopy; 2003 August 3-7; San Antonio, USA San Antonio: Convention Center; 2003. p. 212-213.
- 8. Paciornik S, Martinho FM, Mauricio MHP, dAlmeida JRM. Analysis of the mechanical behavior and characterization of pultruded glass fiber-resin composites. Composite Science and Technology 2003; 63(2):295-304.
- 9. DAlmeida JRM, Paciornik S. Evolution in the Characterization of Composite Materials through Digital Microscopy. In: Caruta BM, editor. New developments in Materials Science Research New York: Nova Science Publishers, in press
- 10. Lange FF, Radford KC. Fracture Energy of an Epoxy System. Journal of Materials Science. 1971; 6(9):1197-1203.
- 11. Pashley DH, Ciucchi B, Sano H, Carvalho RM, Russell CM. Bond strength versus dentine structure: a modeling approach. Archives of Oral Biology 1995; 40(12):1109-1118.
- 12. Mjor IA. Testing of dentin adhesives. Journal of Dental Research 2000; 79(4):892.
- 13. Mjor IA, Nordahl I. The density and branching of dentinal tubules in human teeth. Archives of Oral Biology 1996; 41(5):401-412.
- 14. Schilke R, Lisson JA, Bauss O, Geurtsen W. Comparison of the number and diameter of dentinal tubules in human and bovine dentine by scanning electron microscopy investigation. Archives of Oral Biology 2000; 45(5):355-361.
- 15. Olsson S, Oilo G, Adamczak E. The structure of dentin surfaces exposed for bond strength measurements. Scandinavian Journal of Dental Research 1993; 101(3):180-184.
- 16. Shono Y, Ogawa T, Terashita M, Carvalho RM, Pashley EL, Pashley DH. Regional measurement of resin-dentin bonding as an array. Journal of Dental Research 1999; 78(2):699-705.
- 17. Vander Voort GF. In: Kubel Jr EJ, editor. Practical Guide to Image Analysis Materials Park: ASM International; 2000. p. 15-33.
- 18. Suzuki T, Finger WJ. Dentin adhesives: site of dentin vs. bonding of composite resins. Dental Materials 1988; 4(6):379-383.
- 19. Fosse G, Saele PK, Eide R. Numerical density and distributional pattern of dentin tubules. Acta Odontologica Scandinavia 1992; 50(4):201-210.
- 20. Ogata M, Okuda M, Nakajima M, Pereira PN, Sano H, Tagami J. Influence of the direction of tubules on bond strength to dentin. Operative Dentistry 2001; 26(1):27-35.
Publication Dates
-
Publication in this collection
04 Sept 2007 -
Date of issue
June 2007
History
-
Received
20 Dec 2006 -
Reviewed
15 May 2007


