Abstract
Crystallization kinetics parameters of a stoichiometric glass with the composition Li1.5Al0.5Ge1.5(PO4)3 were investigated by subjecting parallelepipedonal samples (3 × 3 × 1.5 mm) to heat treatment in a differential scanning calorimeter at different heating rates (3, 5, 8 and 10 °C/min). The data were analyzed using Ligero's and Kissinger's methods to determine the activation energy (E) of crystallization, which yielded, respectively, E = 415 ± 37 kJ/mol and 378 ± 19 kJ/mol. Ligero's method was also employed to calculate the Avrami coefficient (n), which was found to be n = 3.0. A second set of samples were heat-treated in a tubular furnace at temperatures above the glass transition temperature, Tg, to induce crystallization. The X-ray diffraction analysis of these samples indicated the presence of LiGe2(PO4)3 which displays a NASICON-type structure. An analysis by optical microscopy revealed the presence of spheric crystals located primarily in the volume, in agreement with the crystallization mechanism predicted by the Avrami coefficient.
crystallization; nucleation; DSC; Ligero's method; Kissinger's method; activation energy; Avrami coefficient
Determination of crystallization kinetics parameters of a Li1.5Al0.5Ge1.5(PO4)3 (LAGP) glass by differential scanning calorimetry
A. M. RodriguesI; J. L. Narváez-SemanateI; A. A. CabralII, A. C. M. RodriguesIII, * * e-mail: acmr@ufscar.br
IPrograma de Pós-graduação em Ciência e Engenharia de Materiais - PPG-CEM, Universidade Federal de São Carlos - UFSCar, São Carlos, SP, Brazil
IIPrograma de Pós-graduação em Engenharia de Materiais - PPGEM, Instituto Federal do Maranhão, São Luís, MA, Brazil
IIILaboratório de Materiais Vítreos - LaMaV, Departamento de Engenharia de Materiais, Universidade Federal de São Carlos - UFSCar, São Carlos, SP, Brazil
ABSTRACT
Crystallization kinetics parameters of a stoichiometric glass with the composition Li1.5Al0.5Ge1.5(PO4)3 were investigated by subjecting parallelepipedonal samples (3 × 3 × 1.5 mm) to heat treatment in a differential scanning calorimeter at different heating rates (3, 5, 8 and 10 °C/min). The data were analyzed using Ligero's and Kissinger's methods to determine the activation energy (E) of crystallization, which yielded, respectively, E = 415 ± 37 kJ/mol and 378 ± 19 kJ/mol. Ligero's method was also employed to calculate the Avrami coefficient (n), which was found to be n = 3.0. A second set of samples were heat-treated in a tubular furnace at temperatures above the glass transition temperature, Tg, to induce crystallization. The X-ray diffraction analysis of these samples indicated the presence of LiGe2(PO4)3 which displays a NASICON-type structure. An analysis by optical microscopy revealed the presence of spheric crystals located primarily in the volume, in agreement with the crystallization mechanism predicted by the Avrami coefficient.
Keywords: crystallization, nucleation, DSC, Ligero's method, Kissinger's method, activation energy, Avrami coefficient
1. INTRODUCTION
Knowledge about crystallization kinetics is essential for the production of glass-ceramics. The glass-ceramic obtained from the stoichiometric Li1.5Al0.5Ge1.5(PO4)3 glass composition presents a NASICON (acronym of Na Super Ionic Conductor)-type structure, which is well-known for its high ionic conductivity. Furthermore, LAGP compounds are also chemically stable when in contact with metallic lithium. Because of these characteristics, LAGP compounds are of technological interest, since they are good candidates to be used as solid-electrolytes in lithium ion batteries1-3, or as membranes in electrochemical sensors4. Since electrical and mechanical properties are dependent on the microstructure5, which may be tailored by controlled crystallization, knowledge about the crystallization kinetics of this family of glasses is of fundamental interest.
Recently, Kun et al.6 investigated the crystallization mechanism and conductivity of Li(1+x)AlxGe(2-x)(PO4)3 glass-ceramics, with x varying from 0 to 0.7. The activation energy for crystallization, E, and the Avrami coefficient, n, of each composition were calculated using the Kissinger and Augis-Bennet models, respectively. These authors found that the values of E increase while n decreases as the Al2O3 content increases. In fact, they obtained values of E varying from 270 to 330 kJ/mol, while n varied from 3.7 to 2.8. For the same glass composition investigated here, i.e., with x = 0.5, Kun et al. obtained E = 300 kJ/mol and n = 3.0.
Despite the absence of any information about particle size, which could alter the influence of surface crystallization, the results obtained by Kun et al.6 point to a tendency for volume crystallization in these glass compositions. In fact, Cruz et al.8 provided strong evidence that Li1.5Al0.5Ge1.5(PO4)3 glass presents volume, supposedly homogeneous, crystallization.
Accordingly, in this study, we determined the activation energy for crystallization and the Avrami coefficient in a stoichiometric glass of composition Li1.5Al0.5Ge1.5(PO4)3, based on the non-isothermal models proposed by Ligero9 and Kissinger10, respectively. While Kissinger's method is widely employed, Ligero's method has been little applied to study the crystallization kinetics of glass systems that present internal nucleation, such as the LAGP composition. In fact, as far as we know, this model has only been applied to metallic9 and silicate systems11,12 that nucleate heterogeneously.
Parallelepipedonal samples (3 × 3 × 1.5 mm) were used in order to minimize the effect of surface crystallization, ensuring that differential scanning calorimetry (DSC) curves reflect predominantly the volume crystallization.
2. THEORETICAL BACKGROUND
The crystallization process in a glass occurs via a combination of nucleation and crystal growth. Under isothermal conditions, the kinetics of these phenomena can be described by Equation 1, which was developed independently by Johnson, Mehl, Avrami and Kolmogorov (JMAK) and which expresses the crystallized volume fraction as follows7:

where x is the transformed volume fraction at a given temperature and at a certain time (t); n is the Avrami coefficient, which is associated with the dimensionality of the crystal and the nucleation mechanism7, and K is a reaction constant that can be expressed by Equation 2.

In Equation 2, R is the gas constant, T is the absolute temperature, E is the activation energy for the overall crystallization process, i.e., nucleation and crystal growth, and Ko is a parameter independent of temperature, known as the frequency factor, which is related to the probability of a molecule participating in the process of crystallization7,9. If crystallization (or crystal growth) occurs from a fixed number of nuclei, E will be representative of the activation energy for crystal growth. However, if nucleation and growth occur simultaneously, E will be representative of the activation energy for the overall crystallization process, i.e, nucleation and crystal growth.
Regarding the Avrami coefficient, n, it is worth noting that it may vary between 1 and 4 depending on the crystallization mechanism and the crystal morphology7. According to Gutzow and Schmelzer7, n equal to 3 indicates either i) volume crystallization of spherical crystals starting from athermal nuclei (from a limited number of nuclei) or ii) crystallization of disc-like (two-dimensional) crystals starting from sporadic (homogeneous) nucleation, or iii) homogeneous (sporadic) nucleation and growth on a surface.
Because they provide rapid results, thermal analysis techniques such as differential scanning calorimetry (DSC) have become an attractive option for the determination of the kinetic parameters n and E. However, the use of such techniques depends on mathematical models for the interpretation of experimental data. In this regard, several models based on Equation 1 have been proposed and successfully applied to characterize the kinetics of glass crystallization9,10,13-15.
If one differentiates Equation 1 with respect to t and applies the logarithm, it is possible to obtain the following expressions:

where f (x) is a function of the crystallized volume fraction (x) and the Avrami coefficient (n)7,9, and (dx/dt) is the variation of the crystallized volume fraction as a function of time, or the rate of crystallization. It is worth noting that in Equation 3a (dx/dt) varies with temperature, which assumes a non-isothermal regime. Taking into account the range of crystallized volume fractions in which f(x) is constant, one can observe that there is a linear relationship between ln(dx/dt) and the reciprocal of the absolute temperature. Therefore, E and ln[Kof (x)] can be determined from the slope and the intercept to the ordinate of the plot of ln(dx/dt) vs. 1/T, respectively.
Based on Equations 3a, b, Ligero9 proposed to analyze (dx/dt) for different heating rates. Thus, a given crystallization rate (dx/dt) occurs at a different temperature for each heating rate. In this way, taking two given values of the crystallized volume fraction, x1 and x2, chosen such as ln[Kof (x1)] = ln[Kof (x2)], it is possible to calculate the Avrami coefficient (n) through the following expression, as proposed by Ligero9:

The activation energy of overall crystallization can also be estimated from the Kissinger method10, through Equation 5:

where Tp is the crystallization peak temperature, φ is the DSC heating rate and C is a constant.
3. EXPERIMENTAL PROCEDURE
3.1. Glass preparation
A 18.8Li2O⋅6.2Al2O3⋅37.5GeO2⋅37.5P2O5 glass was synthesized, starting from the analytical reagents Li2CO3 (Synth-C1006.01.AE), Al2O3 (Pc Alcoa A16), GeO2 (Aldrich-CAS 1310-53-8) and NH4H2PO4 (Aldrich-7722-76-1). The powders were mixed for 24 hours to render them homogeneous. Subsequently, the powder mixture was heated to 700 °C for 1 hour to allow for the decomposition of Li2CO3 and NH4H2PO4. The mixture was then placed in an alumina crucible and melted in an electrical furnace at 1350 °C for 30 minutes. The viscous liquid was poured and cooled by "splat cooling" (pressing the hot liquid between two metal plates, at room temperature, to increase the cooling rate and prevent crystallization). Annealing was performed at 450 °C for 2 hours to relieve the residual thermal stresses, and to enable cutting of the sample. The annealing temperature was chosen based on previous knowledge of the glass transition temperature, Tg= 505 °C, which was obtained by DSC at a heating rate of 10 °C/min.
3.2. X-Ray diffraction
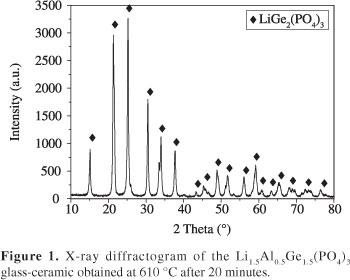
Vitreous samples were heat-treated at 610 °C for 20 minutes and ground in an agate mortar. X-ray diffraction analysis was carried out in a Siemens Ultimate IV X-ray diffractometer with CuKα radiation in a 2 theta range from 10° to 80°, an angular step of 0.02° and a counting time of 1/2 s. Data were collected at room temperature. The diffraction peaks obtained were indexed using the Search Match® program.
3.3. Optical microscopy
Optical microscopy was employed to ascertain the occurrence of volume nucleation and to observe the crystal morphology. To render the crystals visible by optical microscopy, single heat treatment at 590 and 610 °C were conducted for 50 and 20 minutes, respectively. These chosen temperatures are lower than that corresponding to the crystallization peak, in order to prevent rapid crystallization and allow for the detection of the crystals by optical microscopy. The samples were then cut, grinded and polished with cerium oxide. Subsequent etching was applied with a solution of 50/50 HCl/HF for 15 seconds to reveal the crystals. The crystals were then observed under 100X magnification using a Neophot Carl Zeiss Jena microscope.
3.4. Differential scanning calorimetry
To determine the kinetics parameters for crystallization, E and n, annealed parallelepipedon-shaped samples (3 × 3 × 1.5 mm) with a mass of approximately 50 mg were heat-treated in platinum crucibles at different heating rates (3, 5, 8 and 10 °C/min) in a NETZSCH 404 differential scanning calorimeter. The data were processed by the Proteus-Thermal Analysis program16. The dependence of the glass transition temperature, Tg, and the crystallization temperature, Tc, on the heating rate was then evaluated.
4. RESULTS AND DISCUSSION
4.1. Structural characterization by X-Ray diffraction
Figure 1 shows the X-ray diffractogram of the glass-ceramic Li1.5Al0.5Ge1.5(PO4)3, which was obtained by heat-treating the glass at 610 °C for 20 minutes. As can be observed, the peaks match the NASICON-type structure (space group R-3C) LiGe2(PO4)3 corresponding to the JCPDS 80-1924 card index file. Note that because there is no aluminum in the LiGe2(PO4)3 structure described by the JCPDS card, it can be stated that aluminum is in solid solution within the structure. In fact, the similar ionic radii of Ge4+ (0.53 Å) and Al3+ (0.54 Å) allows for the formation of a solid solution while maintaining the same NASICON structure. The substitution of Ge4+ by Al3+ was investigated by Aono et al.17, who found that this substitution leads to a decrease in the cell volume.
4.2. Characterization by optical microscopy
The micrographs of samples heat-treated at 590 and 610 °C for 50 and 20 minutes, respectively, showed circular (spherical) crystals homogeneously distributed in the vitreous matrix, see Figure 2a, b. As observed in section 4.1, these crystals correspond to a NASICON-type phase. The crystals in Figure 2a have a mean size of 3 µm while those in Figure 2b show an average size of 10 µm. This fact suggests that the crystal growth rate at 610 °C is higher than that at 590 °C. This assumption is corroborated by the fact that the maximum crystal growth rates usually occurs at temperatures close to the melting temperature, as was demonstrated by Fokin et al.18 for several silicate glasses. In the case of LAGP, the melting point of the crystals is 1130 °C8.
The images in Figure 2 show cross-sectional area of spherical crystals and confirm that the crystallization of the LiGe2(PO4)3 phase occurs mainly in the volume, as already predicted by Cruz et al.8.
4.3. Activation energy for crystallization, E
Figure 3a shows the thermograms obtained by subjecting 50 mg samples to different heating rates (3, 5, 8 and 10 °C/min). As expected, the temperature of the crystallization peak increases with the heating rate. In fact, this dependence is a direct result of a higher concentration of nuclei, due to a longer time for nucleation at lower heating rates, which results in the shift of the onset of crystallization toward lower temperatures. This behavior is consistent with theoretical19,20 and experimental15,21 investigations. If one considers the volume of nuclei negligible, the area of the peak obtained at different heating rates should be constant since it is representative of the heat of crystallization. Hence, because crystallization occurs in a shorter period of time at higher heating rates, the peak is narrower and should be more intense than peaks obtained at lower heating rates, as observed in Figure 3a.
The dependence of Tg on the heating rate is shown in Figure 3b. As the heating rates applied here are relatively low and close to each other (3, 5, 8 and 10 °C/min), Tg does not increase markedly from 5 °C/min.
To evaluate (dx/dt), the partial area under the crystallization peak corresponding to each analyzed volume fraction (0.08, 0.10, etc.) and the resulting temperature which delimit this partial area were estimated using the Proteus program16. Figure 4 indicates that the variation of ln(dx/dt) with the reciprocal of temperature is linear for crystallized volume fractions of 0.08 to 0.14. This relation was nonlinear for crystallized volume fractions above 0.14. In Figure 4, note that for each crystallized volume fraction, different points were obtained at different heating rates. In fact, for each heating rate, a given crystallized volume fraction occurs at a different temperature. It should be noted that Ligero's method to calculate the activation energy of crystallization implies the use of different heating rates.
Using Ligero's method, an average activation energy for overall crystallization of 378 ± 19 kJ/mol was obtained from the slope of the straight lines shown in Figure 4.
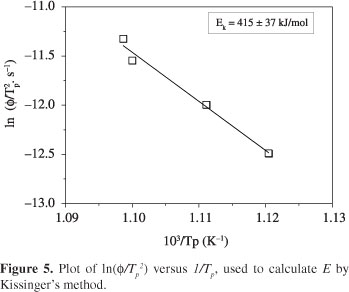
For the sake of discussion, the activation energy, E, was also calculated using Kissinger's method (Equation 5). Figure 5 shows the plot of ln(φ/Tp2) versus 1/Tp.
As indicated in Figure 5, the calculated activation energy is equal to 415 ± 37 kJ/mol. Taking into account the mathematical errors, and comparing the activation energy calculated by the models of Ligero and Kissinger, one can observe that these values are very close. This fact indicates that Ligero's model can provide reliable values of activation energy for overall crystallization, as was also suggested by Silva et al.11 and Teixeira et al.12.
On the other hand, both values are higher than the activation energy (E = 300 kJ/mol) obtained by Kun et al.6, using Kissinger's method. Nevertheless, it should be kept in mind that these authors did not provide information about the particle sizes of the glassy powders used in their experiment. In fact, it is known that the temperature of the crystallization peak (Tp) increases logarithmically with particle size22. Therefore, as the values of E calculated from Ligero's and Kissinger's equations depend on Tp, a dependence of these parameters on particle size is also expected.
The difference between the activation energy obtained by Kissinger's method in this study and by Kun et al.6 may also be due to a possible difference in the real chemical composition of each investigated glass. Such a difference can be inferred from the discrepancy in the glass transition temperatures, since at 5 °C/min the Tg of the glass studied in this work is 496 °C, while the one prepared by Kun et al.6 is 537 °C.
4.4.
Avrami coefficient, n
The crystallization rate and the activation energy estimated in section 4.3 were employed to calculate ln [k0f(x)] using Equation 3a. Thus, ln [k0f(x)] values were plotted as a function of the crystallized volume fraction at each heating rate. As an example, Figure 6 shows the plot of ln [k0f(x)] versus the crystallized volume fraction obtained at a heating rate of 3 °C/min. From this plot, it is possible to determine a pair of crystallized volume fractions (x1 and x2), for which f(x1) = f(x2), and therefore, ln [k0f(x1)] = ln [k0f(x2)], as indicated by the dotted lines. The same procedure was performed for all the heating rates investigated here to obtain x1 and x2 pairs. Using Equation 4 and crystallized volume fractions of x1 and x2 pairs, an average value of the Avrami coefficient equal to 3.0 ± 0.3 was obtained.
As mentioned earlier, n equal to 3 indicates volume crystallization starting either from spontaneous (homogeneous) nucleation (in this case the crystals are two-dimensional, for instance disk or plate-shaped) or athermal (in this case the number of nuclei is fixed and the crystals are spherical, i.e., tri-dimensional) nuclei7. It is worth noting that a fixed number of crystals does not exclude homogeneous nucleation. In fact, in the case of glasses presenting high nucleation rates and low overlap between nucleation and growth curves (as a function of temperature), nuclei may be formed at temperatures before the DSC crystallization peak, and thus, crystallization at the DSC peak may occur from a fixed number of crystals. In this way, taking the result of the Avrami coefficient, n = 3 combined with the micrographs presented in Figure 2 which show the cross-sectional area of spherical crystals, it is possible to conclude that the Li1.5Al0.5Ge1.5(PO4)3 glass crystallizes mainly in the volume. These results, combined with some other characteristics, such as the reduced glass transition temperature Tgr = 0.57[8] points towards homogeneous nucleation. Furthermore, an Avrami coefficient of 3.0 is in accordance with that determined by Kun et al.6 for a similar glass composition.
5. CONCLUSIONS
Crystals with NASICON-type structure homogeneously distributed in a vitreous matrix were obtained by heat-treating a stoichiometric Li1.5Al0.5Ge1.5(PO4)3 glass. Using DSC at different heating rates and applying Ligero's and Kissinger's methods, the values of activation energy obtained for overall crystallization were 378 ± 19 kJ/mol and 415 ± 37 kJ/mol, respectively. Micrographs of partially crystallized samples show internal growth of spherical crystals. Thus, the calculated Avrami coefficient (3.0 ± 0.3) is attributed to volume crystallization, starting from a fixed number of nuclei. Volume crystallization is a relevant finding, since it allows for control of the glass-ceramic microstructure.
ACKNOWLEDGMENTS
The authors are grateful to FAPESP and CNPq (Brazil) for their financial support of this work. We are also indebted to Prof. Dr. Edgar D. Zanotto for his invaluable input.
Received: April 30, 2012
Revised: January 2, 2013
- 1. Fu J. Superionic conductivity of glass-ceramics in the system Li2O-Al2O3-TiO2-P2O5 Solid State Ionics 1997; 96:195-200. http://dx.doi.org/10.1016/S0167-2738(97)00018-0
- 2. Narváez-Semanate JL and Rodrigues ACM. Microstructure and ionic conductivity of Li1+xAlxTi2-x(PO4)3 NASICON glass-ceramics. Solid State Ionics 2010; 181:1197-04. http://dx.doi.org/10.1016/j.ssi.2010.05.010
- 3. Mariappan CR, Gellert M, Yada C, Rosciano F and Roling B. Grain boundary resistance of fast lithium ion conductors: comparison between a lithium-ion conductive Li-Al-Ti-P-O-type glass ceramic and a Li1.5Al0.5Ge1.5P3O12 ceramic. Electrochemistry Communications 2012; 14:25-28. http://dx.doi.org/10.1016/j.elecom.2011.10.022
- 4. Crétin M and Fabry P. Comparative study of lithium ion conductors in the system Li1+xAlxA2-xIV(PO4)3 with AIV = Ti or Ge and 0<x<0.7 for use as Li+ sensitive membranes. Journal of the European Ceramic Society 1999; 19:2931-40. http://dx.doi.org/10.1016/S0955-2219(99)00055-2
- 5. Badwal SPS and Rajendran S. Effect of micro- and nano-structures on the properties of ionic conductors. Solid State Ionics 1994; 70-71:83-95. http://dx.doi.org/10.1016/0167-2738(94)90291-7
- 6. Kun H, Yanhang W, Chengkui Z, Huifeng Z, Yonghua L, Jiang C et al. Influence of Al2O3 additions on crystallization mechanism and conductivity of Li2O-Ge2O-P2O5 glass-ceramics. Physica B 2011; 406:3947-50. http://dx.doi.org/10.1016/j.physb.2011.07.033
- 7. Gutzow IS and Schmelzer JWP. The vitreous state Srpinger-Verlag; 1995. p. 391-396.
- 8. Cruz AM, Ferreira EB and Rodrigues ACM. Controlled crystallization and ionic conductivity of a nanostructured LiAlGePO4 glass-ceramic. Journal of Non-Crystalline Solids 2009; 355:2295-01. http://dx.doi.org/10.1016/j.jnoncrysol.2009.07.012
- 9. Ligero RA, Vázquez J, Villares P and Jiménez-Garay R. A study of the crystallization kinetics of some Cu-As-Te glasses. Journal of Materials Science 1991; 26:211-15. http://dx.doi.org/10.1007/BF00576054
- 10. Kissinger HE. Variation of Peak Temperature With Heating Rate in Differential Thermal Analysis. Journal of Research of the National Bureau of Standards 1956; 57:217-21. http://dx.doi.org/10.6028/jres.057.026
- 11. Silva RA, Teixeira SR, Souza AE, Santos DI, Romero M and Rincón JM. Nucleation kinetics of crystalline phases from a kaolinitic body used in the processing of red ceramics. Applied Clay Science 2011; 52:165-70. http://dx.doi.org/10.1016/j.clay.2011.02.019
- 12. Teixeira SR, Romero M and Rincón JM. Crystallization of SiO2-CaO-Na2O glass using sugarcane bagasse ash as silica source. Journal of the American Ceramic Society 2010; 93:450-55. http://dx.doi.org/10.1111/j.1551-2916.2009.03431.x
- 13. Yinnon H and Uhlmann DR. Application of thermoanalytical techniques to the study of crystallization kinetics in glass-forming liquids, part I: theory. Journal of Non-Crystalline Solids 1983; 54:253-75. http://dx.doi.org/10.1016/0022-3093(83)90069-8
- 14. Matusita K and Sakka S. Kinetic study on crystallization of glass by differential thermal analysis-criterion on application of Kissinger plot. Journal of Non-Crystalline Solids 1980; 38:741-46. http://dx.doi.org/10.1016/0022-3093(80)90525-6
- 15. Rodrigues AM, Costa AMC and Cabral AA. Effect of simultaneous nucleation and crystal growth on DSC crystallization peaks of glasses. Journal of the American Ceramic Society 2012; 95(9):2885-90. http://dx.doi.org/10.1111/j.1551-2916.2012.05333.x
- 16. NETZSCH. Proteus Thermal Analysis version 4.8.4. Germany: NETZSCH; 2007. Software.
- 17. Aono H, Sugimoto E, Sadaoka Y, Imanaka N and Adachi G. Electrical properties and sinterability for lithium germanium phosphate Li1+xMxGe2-x(PO4)3, M = Al, Cr, Ga, Fe, Sc, and In systems. Bulletin of the Chemical Society of Japan 1992; 65:2200-04. http://dx.doi.org/10.1246/bcsj.65.2200
- 18. Fokin VM, Nascimento MLF and Zanotto ED. Correlation between maximum crystal growth rate and glass transition temperature of silicate glasses. Journal of Non-Crystalline Solids 2005; 351:789-94. http://dx.doi.org/10.1016/j.jnoncrysol.2005.02.005
- 19. Weinberg MC. Interpretation of DTA experiments used for crystal nucleation rate determinations. Journal of the American Ceramic Society 1991; 74:1905-09. http://dx.doi.org/10.1111/j.1151-2916.1991.tb07807.x
- 20. Kelton KF. Estimation of the nucleation rate by differential scanning calorimetry. Journal of the American Ceramic Society 1992; 75:2449-52. http://dx.doi.org/10.1111/j.1151-2916.1992.tb05597.x
- 21. Fokin VM, Cabral AA, Reis RMCV, Nascimento MLF and Zanotto ED. Critical assessment of DTA/DSC methods for the study of nucleation kinetics in glasses. Journal of Non-Crystalline Solids 2010; 356:358-67. http://dx.doi.org/10.1016/j.jnoncrysol.2009.11.038
- 22. Ray CS, Day DE, Huang W, Narayan KL, Cull TS and Kelton KF. Non-isothermal calorimetric studies of the crystallization of lithium disilicate glass. Journal of Non-Crystalline Solids 1996; 204:1-12. http://dx.doi.org/10.1016/0022-3093(96)00401-2
Publication Dates
-
Publication in this collection
16 Apr 2013 -
Date of issue
Aug 2013
History
-
Received
30 Apr 2012 -
Reviewed
02 Jan 2013