Abstract:
The objective of this work was to express soil roughness through statistical, geostatistical, and fractal indexes, comparing and relating them to soil and water losses in different experimental conditions. The study was conducted from 2012 to 2015, in the municipality of Lages, in the state of Santa Catarina, Brazil, in a completely randomized design with two replicates. Three treatments were evaluated: T1, scarified soil at the end of the ryegrass (Lolium multiflorum) crop cycle after removal of the shoot residue; T2, scarified soil at the end of the vetch (Vicia sativa) crop cycle after removal of the shoot residue; and T3, scarified soil without cultivation and without cover. The heights of the microrelief were read with a surface roughness tester with rods. Soil roughness was analyzed through the statistical, geostatistical, and fractal indexes. The fractal dimension and intersection distance showed a clear difference between the treatments with cultivation. All indexes, except R1, are associated with soil losses in the treatments with cultivation. As for water losses, there is only an association with the fractal dimension index and only in the treatment without cultivation.
Index terms:
fractal dimension; limiting difference; microrelief; random roughness
Resumo:
O objetivo deste trabalho foi expressar a rugosidade do solo por meio de índices estatísticos, geoestatísticos e fractais, para compará-los e relacioná-los às perdas de solo e de água em diferentes condições experimentais. O estudo foi conduzido de 2012 a 2015, em Lages, SC, em delineamento inteiramente casualizado, com duas repetições. Foram analisados três tratamentos: T1, solo escarificado ao final do ciclo da cultura do azevém (Lolium multiflorum) após eliminação do resíduo cultural da parte aérea; T2, solo escarificado ao final do ciclo da cultura da ervilhaca (Vicia sativa) após eliminação do resíduo cultural da parte aérea; e T3, solo escarificado sem cultivo e sem cobertura. As leituras das alturas do microrrelevo foram obtidas com rugosímetro de varetas. A rugosidade do solo foi analisada por meio de índices estatísticos, geoestatísticos e fractais. A dimensão fractal e a distância de intersecção mostraram uma clara discriminação entre os tratamentos com cultivo. Há associação entre todos os índices, com exceção de R1, e as perdas de solo nos tratamentos com cultivo. Quanto às perdas de água, há associação apenas com o índice dimensão fractal e somente no tratamento sem cultivo.
Termos para indexação:
dimensão fractal; diferença limite; microrrelevo; rugosidade aleatória
Introduction
Soil surface roughness is constituted by the microrelief or microtopography of the ground and is characterized by the sequence of microelevations and microdepressions, spatially distributed on soil surface (Zoldan Junior et al., 2008ZOLDAN JUNIOR, W.A.; BERTOL, I.; PEGORARO, R.; FABIAN, E.L.; ZAVASCHI, E.; VIDAL VÁZQUEZ, E. Rugosidade superficial do solo formada por escarificação e influenciada pela erosividade da chuva. Revista Brasileira de Ciência do Solo, v.32, p.353-362, 2008. DOI: 10.1590/S0100-06832008000100033.
https://doi.org/10.1590/S0100-0683200800...
; Vidal Vázquez et al., 2010aVIDAL VÁZQUEZ, E.; BERTOL, I.; SIQUEIRA, G.M.; PAZ-FERREIRO, J.; DA FONTE, J.D. Evolution of the soil surface roughness using geostatistical analysis. Bragantia, v.69, p.141-152, 2010a. Suplemento. DOI: 10.1590/S0006-87052010000500015.
https://doi.org/10.1590/S0006-8705201000...
).
Different elements of the soil, as well as preparation marks and even patterns of relief, contribute, in varying scales, to soil roughness (García Moreno, 2008GARCÍA MORENO, R.; DÍAZ ÁLVAREZ, M.C.; REQUEJO, A.S.; TARQUIS, A.M. Multifractal analysis of soil surface roughness. Vadose Zone Journal, v.7, p.507-512, 2008. DOI: 10.2136/vzj2007.0016.
https://doi.org/10.2136/vzj2007.0016...
), which is related to soil intrinsic factors, such as intensity and type of preparation, humidity prior to preparation, amount and type of plant residue, type of soil, and terrain declivity (Siqueira et al., 2012SIQUEIRA, G.M.; DAFONTE, J.D.; VIDAL VÁZQUEZ, E.; ARMESTO, M.V. Distribuição espacial da rugosidade do solo em microparcelas experimentais sob diferentes intensidades de chuva simulada. Revista Brasileira de Ciências Agrárias, v.7, p.671-679, 2012.). The two main forms of surface roughness are: roughness at random and soil surface roughness. The first is characterized by the completely random spatial distribution of micromodulations on the surface of the terrain (Linden & Van Doren Jr., 1986LINDEN, D.R.; VAN DOREN JR., D.M. Parameters for characterizing tillage-induced soil surface roughness. Soil Science Society of America Journal, v.50, p.1560-1565, 1986. DOI: 10.2136/sssaj1986.03615995005000060035x.
https://doi.org/10.2136/sssaj1986.036159...
; Bertol et al., 2008BERTOL, I.; ZOLDAN JUNIOR, W.A.; FABIAN, E.L.; ZAVASCHI, E.; PEGORARO, R.; PAZ GONZÁLEZ, A. Efeito de escarificação e da erosividade de chuvas sobre algumas variáveis de valores de erosão hídrica em sistemas de manejo de um Nitossolo Háplico. Revista Brasileira de Ciência do Solo, v.32, p.747-757, 2008. DOI: 10.1590/S0100-06832008000200029.
https://doi.org/10.1590/S0100-0683200800...
; Zoldan Junior et al., 2008ZOLDAN JUNIOR, W.A.; BERTOL, I.; PEGORARO, R.; FABIAN, E.L.; ZAVASCHI, E.; VIDAL VÁZQUEZ, E. Rugosidade superficial do solo formada por escarificação e influenciada pela erosividade da chuva. Revista Brasileira de Ciência do Solo, v.32, p.353-362, 2008. DOI: 10.1590/S0100-06832008000100033.
https://doi.org/10.1590/S0100-0683200800...
). The second may include the joint effect of terrain declivity and soil preparation marks or only the effects of the latter, in which case it is called orientated roughness (Vidal Vázquez et al., 2007VIDAL VÁZQUEZ, E.; MIRANDA, J.G.V.; PAZ GONZÁLEZ, A. Describing soil surface microrelief by crossover length and fractal dimension. Nonlinear Processes in Geophysics, v.4, p.223-235, 2007. DOI: 10.5194/npg-14-223-2007.
https://doi.org/10.5194/npg-14-223-2007...
; Paz-Ferreiro et al., 2008PAZ-FERREIRO, J.; BERTOL, I.; VIDAL VÁZQUEZ, E. Quantification of tillage, plant cover, and cumulative rainfall effects on soil surface microrelief by statistical, geostatistical and fractal indices. Nonlinear Processes in Geophysics, v.15, p.575-590, 2008. DOI: 10.5194/npg-15-575-2008.
https://doi.org/10.5194/npg-15-575-2008...
). Given the importance of soil roughness in the soil erosion process and in water storage on soil surface, it is paramount to quantify it accurately in different conditions of cultivation.
Several indexes have been used to describe the numerical variations of soil surface roughness. Initially, indexes based only on descriptive statistical measurements, such as the random roughness index, were proposed (Kamphorst et al., 2000KAMPHORST, E.C.; JETTEN, V.; GUÉRIF, J.; PITKÄNEN, J.; IVERSEN, B.V.; DOUGLAS, J.T.; PAZ, A. How to predict maximum water storage in depressions from soil roughness measurements. Soil Science Society of America Journal, v.64, p.1749-1758, 2000. DOI: 10.2136/sssaj2000.6451749x.
https://doi.org/10.2136/sssaj2000.645174...
; Correa, 2012CORREA, I.M.C.; BERTOL, I.; RAMOS, J.C.; TAKIZAWA, M.M. Rugosidade da superfície de um Cambissolo Húmico relacionada com o preparo e compactação do solo sob chuva natural. Revista Brasileira de Ciência do Solo, v.36, p.567-576, 2012. DOI: 10.1590/S0100-06832012000200026.
https://doi.org/10.1590/S0100-0683201200...
). However, the main drawback is that two soil surfaces with the same values of random roughness may present different topographies. In addition, the values of these indexes increase with the extension of the area in which the microelevations are measured. Therefore, when measuring roughness, spatial and scale dependence should also be considered, which does not occur when only a statistical index is used (Paz-Ferreiro et al., 2008PAZ-FERREIRO, J.; BERTOL, I.; VIDAL VÁZQUEZ, E. Quantification of tillage, plant cover, and cumulative rainfall effects on soil surface microrelief by statistical, geostatistical and fractal indices. Nonlinear Processes in Geophysics, v.15, p.575-590, 2008. DOI: 10.5194/npg-15-575-2008.
https://doi.org/10.5194/npg-15-575-2008...
). In this context, several other approaches have been presented, such as geostatistical indexes that consider the spatial distribution of microelevations on the terrain (Linden & Van Doren Jr, 1986LINDEN, D.R.; VAN DOREN JR., D.M. Parameters for characterizing tillage-induced soil surface roughness. Soil Science Society of America Journal, v.50, p.1560-1565, 1986. DOI: 10.2136/sssaj1986.03615995005000060035x.
https://doi.org/10.2136/sssaj1986.036159...
; Paz-Ferreiro et al., 2008PAZ-FERREIRO, J.; BERTOL, I.; VIDAL VÁZQUEZ, E. Quantification of tillage, plant cover, and cumulative rainfall effects on soil surface microrelief by statistical, geostatistical and fractal indices. Nonlinear Processes in Geophysics, v.15, p.575-590, 2008. DOI: 10.5194/npg-15-575-2008.
https://doi.org/10.5194/npg-15-575-2008...
) and indexes based on the fractal theory, considering both the effects of space and of the measurement scale on soil surface roughness (Vidal Vázquez et al., 2007VIDAL VÁZQUEZ, E.; MIRANDA, J.G.V.; PAZ GONZÁLEZ, A. Describing soil surface microrelief by crossover length and fractal dimension. Nonlinear Processes in Geophysics, v.4, p.223-235, 2007. DOI: 10.5194/npg-14-223-2007.
https://doi.org/10.5194/npg-14-223-2007...
, 2010bVIDAL VÁZQUEZ, E.; VIEIRA, S.R.; DE MARIA, I.C.; PAZ GONZÁLEZ, A. Fractal dimension and geostatistical parameters for soil microrelief as a function of cumulative precipitation. Scientia Agricola, v.67, p.78-83, 2010b. DOI: 10.1590/S0103-90162010000100011.
https://doi.org/10.1590/S0103-9016201000...
; Paz-Ferreiro et al., 2008PAZ-FERREIRO, J.; BERTOL, I.; VIDAL VÁZQUEZ, E. Quantification of tillage, plant cover, and cumulative rainfall effects on soil surface microrelief by statistical, geostatistical and fractal indices. Nonlinear Processes in Geophysics, v.15, p.575-590, 2008. DOI: 10.5194/npg-15-575-2008.
https://doi.org/10.5194/npg-15-575-2008...
). However, it should be noted that most of the runoff and erosion processes do not show an expressive correlation at small distances, indicating that the roughness indexes based on fractal parameters may not necessarily be more important than other indicators based on descriptive statistics or geostatistics (Paz-Ferreiro et al., 2008PAZ-FERREIRO, J.; BERTOL, I.; VIDAL VÁZQUEZ, E. Quantification of tillage, plant cover, and cumulative rainfall effects on soil surface microrelief by statistical, geostatistical and fractal indices. Nonlinear Processes in Geophysics, v.15, p.575-590, 2008. DOI: 10.5194/npg-15-575-2008.
https://doi.org/10.5194/npg-15-575-2008...
).
Most of the works found in the literature have focused on measuring the roughness indexes under different soil preparation systems. In the present work, another approach is taken, since these indexes are analyzed under the same soil preparation, in this case, scarification, but under different cultivation conditions. It is important to study the behavior of these indexes in varying soil cultivation conditions in order to better understand the relationship between them and also with soil and water losses.
The objective of this work was to express soil roughness through statistical, geostatistical, and fractal indexes, comparing and relating them to soil and water losses in different experimental conditions.
Materials and Methods
The primary data of surface roughness and soil and water losses used in the present study were originated from a study conducted by Júlio César Ramos in the municipality of Lages, in the state of Santa Catarina, Brazil (27º47'S, 50º18'W, at 908 m of altitude) (Ramos, 2015RAMOS, J.C. Cobertura e rugosidade da superfície na proposição de indicadores de qualidade de um Cambissolo Húmico relacionados ao controle da erosão hídrica. 2015. 202p. Tese (Doutorado) - Universidade do Estado de Santa Catarina, Lages.; Ramos et al., 2016RAMOS, J.C.; BERTOL, I.; BARBOSA, F.T.; BERTOL, C.; MAFRA, Á.L.; MIQUELLUTI, D.J.; MECABÔ JÚNIOR, J. Water erosion in surface soil conditions: runoff velocity, concentration and D50 index of sediments in runoff. Scientia Agricola, v.73, p.286-293, 2016. DOI: 10.1590/0103-9016-2015-0110.
https://doi.org/10.1590/0103-9016-2015-0...
). The climate of the region, according to Köppen’s classification, is of the Cfb type, and the annual average rainfall, according to Schick et al. (2014)SCHICK, J.; BERTOL, I.; COGO, N.P.; PAZ GONZÁLEZ, A. Erosividade das chuvas de Lages, Santa Catarina. Revista Brasileira de Ciência do Solo, v.38, p.1890-1905, 2014. DOI: 10.1590/S0100-06832014000600024.
https://doi.org/10.1590/S0100-0683201400...
, is of 1,533 mm. The relief of the experimental area is smooth-wavy, and the soil is a classified as a Cambissolo Húmico alumínico léptico (Inceptisol), with 196 g kg-1 sand, 412 g kg-1 silt, and 392 g kg-1 clay, belonging to the silty clay loam textural class, as described by Ramos (2015)RAMOS, J.C. Cobertura e rugosidade da superfície na proposição de indicadores de qualidade de um Cambissolo Húmico relacionados ao controle da erosão hídrica. 2015. 202p. Tese (Doutorado) - Universidade do Estado de Santa Catarina, Lages..
In the last crop cycle prior to the research carried out by Ramos (2015)RAMOS, J.C. Cobertura e rugosidade da superfície na proposição de indicadores de qualidade de um Cambissolo Húmico relacionados ao controle da erosão hídrica. 2015. 202p. Tese (Doutorado) - Universidade do Estado de Santa Catarina, Lages., the area was managed under no-tillage, except where the uncovered plots were installed, and soybean [Glycine max (L.) Merr.] and corn (Zea mays L.) crops were cultivated in the direction of the slope and in the surroundings. At the end of that cycle, the crop residues were removed, and the ryegrass (Lolium multiflorum Lam.) and vetch (Vicia sativa L.) crops were sown manually by broadcast, with the seeds being incorporated into the soil with a mild harrowing, transverse to the slope. The experimental design was completely randomized, with two replicates and the following three treatments: T1, scarified soil at the end of the ryegrass crop cycle after removal of the shoot residues; T2, scarified soil at the end of the vetch crop cycle after removal of the shoot residues; and T3, soil without cultivation and without cover, maintained since 2009 and prepared with a scarification identical to that in T1 and T2. Scarification was carried out transversely to the slope, using a Massey Ferguson mechanical scarifier (AGCO, Duluth, GA, USA), which contained two rows of mismatched rods, one in the front with seven rods and the other in the back with six rods, with a distance of 0.5 m between them. Therefore, scarification generated furrows spaced 0.25 m apart, with a depth of 0.15 m, causing great roughness in the three treatments.
In each treatment, eight simulated rainfalls of 90 min each and with a constant intensity, planned for 65 mm per hour, were applied. Soil surface roughness was measured immediately before and right after the scarification of the plots, immediately before each simulated rainfall, and at the end of the last simulated rainfall. A mechanical surface roughness tester, built at Universidade do Estado de Santa Catarina, in the municipality of Lages, in the state of Santa Catarina, Brazil (Correa et al., 2012CORREA, I.M.C.; BERTOL, I.; RAMOS, J.C.; TAKIZAWA, M.M. Rugosidade da superfície de um Cambissolo Húmico relacionada com o preparo e compactação do solo sob chuva natural. Revista Brasileira de Ciência do Solo, v.36, p.567-576, 2012. DOI: 10.1590/S0100-06832012000200026.
https://doi.org/10.1590/S0100-0683201200...
), was used, with 20 aluminum rods, spaced 30 mm from one another and delimited by a support line; the rods were visualized through a photographic camera coupled to the instrument. The readings were taken at an intermediate point of the plot, with the surface roughness tester positioned near the side of the plot, on wood supports stuck into the soil, allowing the readings to be carried out leveled, at the same height in relation to the ground, and in the same place. Twenty soil profiles, distanced 30 mm from each other, were taken, totaling 400 points, corresponding to a sampling area of 0.36 m2 (0.6x0.6 m). Soil profile readings were recorded photographically and later digitalized (Vidal Vázquez, 2002VIDAL VÁZQUEZ, E. Influencia de la precipitación y el laboreo en la rugosidad del suelo y la retención de agua en microdepresiones. 2002. 487p. Tese (Doutorado) - Universidade da Coruña, Coruña.).
To evaluate soil roughness, different statistical, geostatistical, and fractal indexes were calculated.
The first three - R1, R2, and R3 - are statistical indexes that express random roughness without considering the effects of spatial correlation and scale. The R1 index was calculated according to Allmaras et al. (1966)ALLMARAS, R.R.; BURWELL, R.E.; LARSON, W.E.; HOLT, R.F.; NELSON, W.W. Total porosity and roughness of the interrow zone as influenced by tillage. Washington: Usda, 1966. 22p. (Conservation Research Report, v.7). by determining the standard deviation of the residual values of the natural logarithm obtained in the elevation readings after removing the average effects of rows and columns; in this case, 10% of the extreme values were eliminated. The other two indexes were calculated as described in Kamphorst et al. (2000)KAMPHORST, E.C.; JETTEN, V.; GUÉRIF, J.; PITKÄNEN, J.; IVERSEN, B.V.; DOUGLAS, J.T.; PAZ, A. How to predict maximum water storage in depressions from soil roughness measurements. Soil Science Society of America Journal, v.64, p.1749-1758, 2000. DOI: 10.2136/sssaj2000.6451749x.
https://doi.org/10.2136/sssaj2000.645174...
, that is, without applying logarithmic transformation and without eliminating 10% of the extreme values. The R2 index was specifically obtained using the standard deviation of the corrected readings, removing the slope effect through multiple regression, with the best adjustment plan considering the row and column positions as independent variables and height readings as the dependent variable. The R3 index was determined by the standard deviation of the residual values after the simultaneous removal of the effects of the slope and of soil preparation marks, correcting the data in the row and in the column (Currence & Lovely, 1970CURRENCE, H.D.; LOVELY, W.G. The analysis of soil surface roughness. Transactions of the ASAE, v.13, p.710 -714, 1970. DOI: 10.13031/2013.38702.
https://doi.org/10.13031/2013.38702...
).
Two geostatistical indexes, i.e., limiting difference (LD) and limiting slope (LS), were obtained as described in Linden & Van Doren Jr. (1986)LINDEN, D.R.; VAN DOREN JR., D.M. Parameters for characterizing tillage-induced soil surface roughness. Soil Science Society of America Journal, v.50, p.1560-1565, 1986. DOI: 10.2136/sssaj1986.03615995005000060035x.
https://doi.org/10.2136/sssaj1986.036159...
and Paz-Ferreiro et al. (2008)PAZ-FERREIRO, J.; BERTOL, I.; VIDAL VÁZQUEZ, E. Quantification of tillage, plant cover, and cumulative rainfall effects on soil surface microrelief by statistical, geostatistical and fractal indices. Nonlinear Processes in Geophysics, v.15, p.575-590, 2008. DOI: 10.5194/npg-15-575-2008.
https://doi.org/10.5194/npg-15-575-2008...
. The LD and LS indexes were calculated using the mean difference, in absolute values, of the height data (ΔZh) as a function of distance (h), which is equivalent to a first-order semivariogram, in geostatistical terms.
The mean differences in height were calculated as:
where Zi is the height measured at each point (mm); Zi + h are the heights at adjacent points separated by h (mm); and n is the number of pairs of data that are compared with each other.
To obtain LD and LS, a hyperbolic function was adjusted to the first-order semivariogram, according to the following expression:
where ΔZh is the mean difference, in an absolute value, of accurate height data (mm); ΔXh is the horizontal space between points (mm); and a and b are the adjustment parameters.
The parameters a and b, calculated by the least squares regression, allow defining the LD and LS indexes as: LD = 1/a and LS = 1/b.
Two fractal indexes - fractal dimension (D) and intersection distance (l) - were obtained according to Paz-Ferreiro et al. (2008)PAZ-FERREIRO, J.; BERTOL, I.; VIDAL VÁZQUEZ, E. Quantification of tillage, plant cover, and cumulative rainfall effects on soil surface microrelief by statistical, geostatistical and fractal indices. Nonlinear Processes in Geophysics, v.15, p.575-590, 2008. DOI: 10.5194/npg-15-575-2008.
https://doi.org/10.5194/npg-15-575-2008...
and Vidal Vázquez et al. (2010b)VIDAL VÁZQUEZ, E.; VIEIRA, S.R.; DE MARIA, I.C.; PAZ GONZÁLEZ, A. Fractal dimension and geostatistical parameters for soil microrelief as a function of cumulative precipitation. Scientia Agricola, v.67, p.78-83, 2010b. DOI: 10.1590/S0103-90162010000100011.
https://doi.org/10.1590/S0103-9016201000...
. The fractal analysis was carried out using a variational method, assuming autosimilar surfaces to describe the microrelief. This method is based on a fractional Brownian motion model (fBM) from which the fractal parameters D and l are determined using the semivariance function expressed by the semivariogram estimated from the data. The semivariogram or variogram was obtained by:
where h is the measured distance or scale, calculated over the interval; [h - Δh, h + Δh], with 2Δh being the separation distance between the scales in the semivariogram; [Z(xi, yi) - Zh] is the difference in height between points separated by the mean distance h; and n(h) is number of points considered in each interval.
For the fBM, the variogram, considering autosimilar fractal surfaces, presents the following relationship: γ(h) α h2H where H is the Hurst exponent, related to the fractal dimension of the surface by D = 3 - H.
This variogram can also be described as a function of the intersection distance and the Hurst exponent, using the following expression: γ(h) = 12 - 2Hh2H
By adjusting the variogram to the previous equation, it is possible to obtain information about the organization (H) and magnitude (l) of surface roughness. In order to carry out this adjustment, a logarithmic transformation was applied to both terms of the equation, which resulted in: lnγ = (2 - 2H) ln(1) + 2H ln(h)
This above equation represents a line with slope a = 2H and intercept b = (2 - 2H) ln (l). Therefore, when this straight line is adjusted by the method of minimum squares, D and l are obtained by the following expressions:
where a is the declivity of the adjusted straight line and b is the intercept.
The obtained results were subjected to the descriptive statistical analysis. Pearson’s product-moment correlation coefficient was also used to evaluate the existence of linear relationships between the different calculated indexes and of these with the soil and water losses determined in the same treatments. For the purpose of analysis, the variables soil and water losses were taken on a logarithmic scale (natural logarithm). All analyzes were performed using the R software (R Core Team, 2016R CORE TEAM. R: a language and environment for statistical computing. Vienna: R Foundation for Statistical Computing, 2016. Available at: ˂Available at: ˂http://www.R-project.org
˃. Accessed on: Oct. 2 2017.
http://www.R-project.org...
), at 5% probability.
Results and Discussion
The R1, R2, R3, LD, and D indexes presented a symmetric unimodal frequency distribution (asymmetry = 0; p>0.05) and mesokurtic distribution (kurtosis = 3; p>0.05), a behavior that is indicative of compliance with the normality hypothesis (Ferreira, 2009FERREIRA, F.F. Estatística básica. 2.ed. Lavras: UFLA, 2009. 664p.) (Table 1). The R1 index, with an average value of 0.149, showed the lowest values among the statistical indexes. This is due to the application of log transformation to the vertical data of the microdepressions and microelevations, the removal of the effects of slope and soil preparation marks, and the exclusion of 10% of the lower and higher values (Allmaras et al., 1966ALLMARAS, R.R.; BURWELL, R.E.; LARSON, W.E.; HOLT, R.F.; NELSON, W.W. Total porosity and roughness of the interrow zone as influenced by tillage. Washington: Usda, 1966. 22p. (Conservation Research Report, v.7). ; Kamphorst et al., 2000KAMPHORST, E.C.; JETTEN, V.; GUÉRIF, J.; PITKÄNEN, J.; IVERSEN, B.V.; DOUGLAS, J.T.; PAZ, A. How to predict maximum water storage in depressions from soil roughness measurements. Soil Science Society of America Journal, v.64, p.1749-1758, 2000. DOI: 10.2136/sssaj2000.6451749x.
https://doi.org/10.2136/sssaj2000.645174...
).
The analysis of the behavior of the three treatments over time (Figures 1 A, B, and C) showed a significant increase in the three statistical roughness indexes after soil preparation, in all three treatments, with a faster decrease in the uncovered and scarified soil treatment (T3). In T1 and T2, the decrease was more discrete, due to the greater roughness stability because of the presence of ryegrass and vetch roots in the soil.

Variation in the R1 (A), R2 (B), and R3 (C) roughness indexes, in the three evaluated treatments, for different times of rainfall application. T1, scarified soil with ryegrass (Lolium multiflorum) roots; T2, scarified soil with vetch (Vicia sativa) roots; T3, scarified soil without cultivation; AP, after preparation; BP, before preparation; C1, first simulated rainfall; C2, second simulated rainfall; C3, third simulated rainfall; C4, fourth simulated rainfall; C5, fifth simulated rainfall; C6, sixth simulated rainfall; C7, seventh simulated rainfall; and C8, eighth simulated rainfall.
According to Ramos (2015)RAMOS, J.C. Cobertura e rugosidade da superfície na proposição de indicadores de qualidade de um Cambissolo Húmico relacionados ao controle da erosão hídrica. 2015. 202p. Tese (Doutorado) - Universidade do Estado de Santa Catarina, Lages. and Ramos et al. (2016)RAMOS, J.C.; BERTOL, I.; BARBOSA, F.T.; BERTOL, C.; MAFRA, Á.L.; MIQUELLUTI, D.J.; MECABÔ JÚNIOR, J. Water erosion in surface soil conditions: runoff velocity, concentration and D50 index of sediments in runoff. Scientia Agricola, v.73, p.286-293, 2016. DOI: 10.1590/0103-9016-2015-0110.
https://doi.org/10.1590/0103-9016-2015-0...
, the impact of droplets on the surface of the soil, especially when uncovered, decreases its roughness over time. The decrease in the roughness of uncovered and uncultivated soil may also be explained by the decrease in organic matter content and in the resistance of aggregates to water action (Bertol et al., 2006BERTOL, I.; AMARAL, A.J. do; VIDAL VÁZQUEZ, E.; PAZ GONZÁLES, A.; BARBOSA, F.T.; BRIGNONI, L.F. Relações da rugosidade superficial do solo com o volume de chuva e com a estabilidade de agregados em água. Revista Brasileira de Ciência do Solo, v.30, p.543-553, 2006. DOI: 10.1590/S0100-06832006000300014.
https://doi.org/10.1590/S0100-0683200600...
).
The mean value of the R2 index was 14.810 mm (Table 1). In T1 and T2, the values found for this index behaved similarly (Figure 1 B), increasing right after soil preparation and decreasing until the last applied rainfall. Zoldan Junior et al. (2008)ZOLDAN JUNIOR, W.A.; BERTOL, I.; PEGORARO, R.; FABIAN, E.L.; ZAVASCHI, E.; VIDAL VÁZQUEZ, E. Rugosidade superficial do solo formada por escarificação e influenciada pela erosividade da chuva. Revista Brasileira de Ciência do Solo, v.32, p.353-362, 2008. DOI: 10.1590/S0100-06832008000100033.
https://doi.org/10.1590/S0100-0683200800...
and Zhao et al. (2014)ZHAO, L.S.; LIANG, X.; WU, F. Soil surface roughness change and its effect on runoff and erosion on the Loess Plateau of China. Journal of Arid Land, v.6, p.400-409, 2014. DOI: 10.1007/s40333-013-0246-z.
https://doi.org/10.1007/s40333-013-0246-...
observed an exponential decrease in soil surface roughness, particularly in the initial rainfall tests. According to Ramos et al. (2016)RAMOS, J.C.; BERTOL, I.; BARBOSA, F.T.; BERTOL, C.; MAFRA, Á.L.; MIQUELLUTI, D.J.; MECABÔ JÚNIOR, J. Water erosion in surface soil conditions: runoff velocity, concentration and D50 index of sediments in runoff. Scientia Agricola, v.73, p.286-293, 2016. DOI: 10.1590/0103-9016-2015-0110.
https://doi.org/10.1590/0103-9016-2015-0...
, the fast reduction in roughness after the first rainfall is due to the reduction in porosity by surface sealing, attributed to the breaking and disintegration of clods after wetting and, to a lesser extent, to the deposition of sediments in microdepressions and to soil settling. However, in T3, there was a decrease until the fifth rainfall, followed by an increase in roughness in the sixth rainfall. This behavior can probably be explained by the formation of surface grooves and/or by the transport of finer particles in the runoff as visually verified in the plots and in the line, which was also reported by Bertol et al. (2006)BERTOL, I.; AMARAL, A.J. do; VIDAL VÁZQUEZ, E.; PAZ GONZÁLES, A.; BARBOSA, F.T.; BRIGNONI, L.F. Relações da rugosidade superficial do solo com o volume de chuva e com a estabilidade de agregados em água. Revista Brasileira de Ciência do Solo, v.30, p.543-553, 2006. DOI: 10.1590/S0100-06832006000300014.
https://doi.org/10.1590/S0100-0683200600...
and Ramos et al. (2016)RAMOS, J.C.; BERTOL, I.; BARBOSA, F.T.; BERTOL, C.; MAFRA, Á.L.; MIQUELLUTI, D.J.; MECABÔ JÚNIOR, J. Water erosion in surface soil conditions: runoff velocity, concentration and D50 index of sediments in runoff. Scientia Agricola, v.73, p.286-293, 2016. DOI: 10.1590/0103-9016-2015-0110.
https://doi.org/10.1590/0103-9016-2015-0...
.
The mean value of the R3 index was 10.607 mm (Table 1). Although this index presented lower values than R2, it is analogous to it (Figure 1 C). As the soil preparation was the same in all three treatments, this was expected - the difference is that, in order to calculate R3, besides slope correction, the effect of soil tillage marks was also removed.
The values obtained for LD and R3 present statistical similarities and important correlations (Linden & Van Doren Jr., 1986LINDEN, D.R.; VAN DOREN JR., D.M. Parameters for characterizing tillage-induced soil surface roughness. Soil Science Society of America Journal, v.50, p.1560-1565, 1986. DOI: 10.2136/sssaj1986.03615995005000060035x.
https://doi.org/10.2136/sssaj1986.036159...
; Vidal Vázquez, 2002VIDAL VÁZQUEZ, E. Influencia de la precipitación y el laboreo en la rugosidad del suelo y la retención de agua en microdepresiones. 2002. 487p. Tese (Doutorado) - Universidade da Coruña, Coruña.), although they are not identical. LD estimates the average trend of the absolute differences of height between neighboring points, whereas R3 estimates the average trend of height differences of points in relation to the mean. It should be noted that LS, contrary to LD, is not related to the R3 index (Linden & Van Doren Jr., 1986LINDEN, D.R.; VAN DOREN JR., D.M. Parameters for characterizing tillage-induced soil surface roughness. Soil Science Society of America Journal, v.50, p.1560-1565, 1986. DOI: 10.2136/sssaj1986.03615995005000060035x.
https://doi.org/10.2136/sssaj1986.036159...
).
Despite the divergence between LD and LS, the linear correlation coefficient values found were 0.96 (p<0.05) and 0.68 (p<0.05) between LD and R3 and between LS and R3, respectively, in the average of the studied treatments (Table 1). The mean values of the LD and LS indexes were 13.329 and 0.047 mm, respectively. Bertol et al. (2006)BERTOL, I.; AMARAL, A.J. do; VIDAL VÁZQUEZ, E.; PAZ GONZÁLES, A.; BARBOSA, F.T.; BRIGNONI, L.F. Relações da rugosidade superficial do solo com o volume de chuva e com a estabilidade de agregados em água. Revista Brasileira de Ciência do Solo, v.30, p.543-553, 2006. DOI: 10.1590/S0100-06832006000300014.
https://doi.org/10.1590/S0100-0683200600...
reported LD values of 8.97 mm in plots cultivated with corn and of 6.34 mm in plots with oat (Avena strigosa Schreb.), both prepared with a scarifier followed by harrowing, in a Cambissolo Húmico, i.e., a equivalente do nome do solo em inglês.
The LD values (Figure 2 B), although slightly higher, showed a similar behavior to that of R3 (Figure 1 C), in agreement with the results of Paz-Ferreiro et al. (2008)PAZ-FERREIRO, J.; BERTOL, I.; VIDAL VÁZQUEZ, E. Quantification of tillage, plant cover, and cumulative rainfall effects on soil surface microrelief by statistical, geostatistical and fractal indices. Nonlinear Processes in Geophysics, v.15, p.575-590, 2008. DOI: 10.5194/npg-15-575-2008.
https://doi.org/10.5194/npg-15-575-2008...
. There was an increase in the LS index (Figure 2 A) after soil preparation, followed by a decrease in treatments T2 and T3. It should be highlighted that this behavior is similar to that observed in the other indexes, in almost all treatments, except for the R1 index in T2, which is in alignment with the literature.

Variation in the limiting slope index (A) and in the limiting difference index (B), in the three evaluated treatments, for different times of rainfall application. T1, scarified soil with ryegrass (Lolium multiflorum) roots; T2, scarified soil with vetch (Vicia sativa) roots; T3, scarified soil without cultivation; AP, after preparation; BP, before preparation; C1, first simulated rainfall; C2, second simulated rainfall; C3, third simulated rainfall; C4, fourth simulated rainfall; C5, fifth simulated rainfall; C6, sixth simulated rainfall; C7, seventh simulated rainfall; and C8, eighth simulated rainfall.
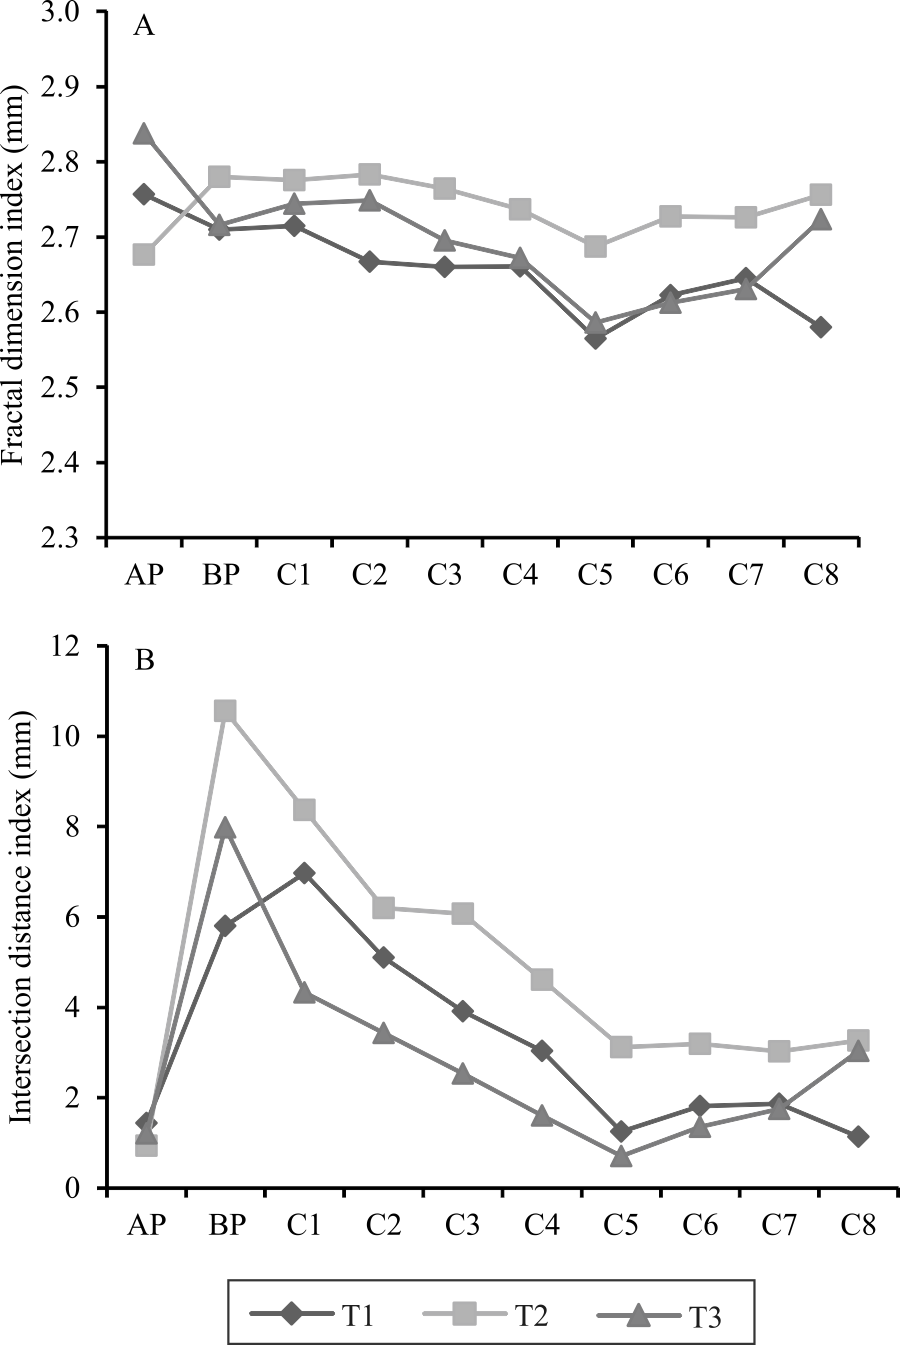
The fractal dimension indexes D and l presented mean values of 2.699 and 3.653 mm, respectively (Table 1). Vidal Vázquez (2002)VIDAL VÁZQUEZ, E. Influencia de la precipitación y el laboreo en la rugosidad del suelo y la retención de agua en microdepresiones. 2002. 487p. Tese (Doutorado) - Universidade da Coruña, Coruña. found values of 2.782 and 4.56 mm for D and l, respectively, in soil prepared with a scarifier. The greater similarity between the values of the D index indicates that it is less sensitive to varying experimental conditions, considering the different environments where the experiments were carried out here and in the work of Vidal Vázquez (2002)VIDAL VÁZQUEZ, E. Influencia de la precipitación y el laboreo en la rugosidad del suelo y la retención de agua en microdepresiones. 2002. 487p. Tese (Doutorado) - Universidade da Coruña, Coruña..
The behavior of the D index (Figure 3 A) differed from that of the l index (Figure 3 B), which presented a faster decrease in the early stages, similarly to the R3 index (Figure 3 C). This same behavior was also verified by Vidal Vázquez et al. (2007)VIDAL VÁZQUEZ, E.; MIRANDA, J.G.V.; PAZ GONZÁLEZ, A. Describing soil surface microrelief by crossover length and fractal dimension. Nonlinear Processes in Geophysics, v.4, p.223-235, 2007. DOI: 10.5194/npg-14-223-2007.
https://doi.org/10.5194/npg-14-223-2007...
, indicating that l, similarly to R3, has a greater discrimination power in the vertical scale of soil roughness, while D represents a relative measure of the distribution of different-sized structural elements on soil surface (Vidal Vázquez et al., 2010bVIDAL VÁZQUEZ, E.; VIEIRA, S.R.; DE MARIA, I.C.; PAZ GONZÁLEZ, A. Fractal dimension and geostatistical parameters for soil microrelief as a function of cumulative precipitation. Scientia Agricola, v.67, p.78-83, 2010b. DOI: 10.1590/S0103-90162010000100011.
https://doi.org/10.1590/S0103-9016201000...
).

Variation in the fractal dimension index (A) and the intersection distance index (B), in the three evaluated treatments, for different times of rainfall application. T1, scarified soil with ryegrass (Lolium multiflorum) roots; T2, scarified soil with vetch (Vicia sativa) roots; T3, scarified soil without cultivation; AP, after preparation; BP, before preparation; C1, first simulated rainfall; C2, second simulated rainfall; C3, third simulated rainfall; C4, fourth simulated rainfall; C5, fifth simulated rainfall; C6, sixth simulated rainfall; C7, seventh simulated rainfall; and C8, eighth simulated rainfall.
The D index was significantly correlated with almost all indexes in T2, but had no significant correlation in T3 (Table 2). This shows that D contains information that is not present in the other indexes, but that this characteristic is not constant in different experimental conditions. Vivas Miranda (2000)VIVAS MIRANDA, J.G. Análisis fractal del microrrelieve del suelo. 2000. 313p. Tese (Doutorado) - Universidade da Coruña, Coruña., for example, obtained significant correlations between the D and R1 indexes only on laboratory-constructed surfaces. Paz-Ferreiro et al. (2008)PAZ-FERREIRO, J.; BERTOL, I.; VIDAL VÁZQUEZ, E. Quantification of tillage, plant cover, and cumulative rainfall effects on soil surface microrelief by statistical, geostatistical and fractal indices. Nonlinear Processes in Geophysics, v.15, p.575-590, 2008. DOI: 10.5194/npg-15-575-2008.
https://doi.org/10.5194/npg-15-575-2008...
found correlations between D and l varying from 0.5 to 0.7 in areas cultivated with corn and oat in a Cambissolo Húmico. The high correlation values observed between R2 and R3 (Table 2) indicate that these two statistical indexes measure the same characteristics of the microrelief. In the case of R1, the transformation of the applied scale was probably responsible for the low values of the linear correlation coefficients obtained in the treatment with vetch roots.
With the exception of R1, the correlation coefficients showed a negative sign regarding soil losses in the other indexes (Table 3), indicating an exponential decrease with the increase of soil surface roughness. In fact, this relationship is indirect, since there is an exponential decrease in surface roughness with the accumulation of rainfall, according to Bertol et al. (2006)BERTOL, I.; AMARAL, A.J. do; VIDAL VÁZQUEZ, E.; PAZ GONZÁLES, A.; BARBOSA, F.T.; BRIGNONI, L.F. Relações da rugosidade superficial do solo com o volume de chuva e com a estabilidade de agregados em água. Revista Brasileira de Ciência do Solo, v.30, p.543-553, 2006. DOI: 10.1590/S0100-06832006000300014.
https://doi.org/10.1590/S0100-0683200600...
, Zoldan Junior et al. (2008)ZOLDAN JUNIOR, W.A.; BERTOL, I.; PEGORARO, R.; FABIAN, E.L.; ZAVASCHI, E.; VIDAL VÁZQUEZ, E. Rugosidade superficial do solo formada por escarificação e influenciada pela erosividade da chuva. Revista Brasileira de Ciência do Solo, v.32, p.353-362, 2008. DOI: 10.1590/S0100-06832008000100033.
https://doi.org/10.1590/S0100-0683200800...
, and Ramos (2015)RAMOS, J.C. Cobertura e rugosidade da superfície na proposição de indicadores de qualidade de um Cambissolo Húmico relacionados ao controle da erosão hídrica. 2015. 202p. Tese (Doutorado) - Universidade do Estado de Santa Catarina, Lages., due to surface sealing. For this reason, there is a decrease in the rate of infiltration and an increase in runoff velocity, which culminates in greater soil losses.
D and l showed a correlation with soil losses in all studied treatments. This indicates that they do not represent the same microrelief characteristics as the other indexes and that they have theoretical properties that better describe the behavior of the microrelief. The values obtained for D and l are also indicative that the description of soil roughness characteristics by a single parameter that represents only the vertical component is inadequate, as suggested by Vidal Vázquez et al. (2007)VIDAL VÁZQUEZ, E.; MIRANDA, J.G.V.; PAZ GONZÁLEZ, A. Describing soil surface microrelief by crossover length and fractal dimension. Nonlinear Processes in Geophysics, v.4, p.223-235, 2007. DOI: 10.5194/npg-14-223-2007.
https://doi.org/10.5194/npg-14-223-2007...
and Paz-Ferreiro et al. (2008)PAZ-FERREIRO, J.; BERTOL, I.; VIDAL VÁZQUEZ, E. Quantification of tillage, plant cover, and cumulative rainfall effects on soil surface microrelief by statistical, geostatistical and fractal indices. Nonlinear Processes in Geophysics, v.15, p.575-590, 2008. DOI: 10.5194/npg-15-575-2008.
https://doi.org/10.5194/npg-15-575-2008...
.
In relation to water losses, only the fractal dimension showed a significant correlation and only in the treatment without cultivation and with uncovered and scarified soil. This result indirectly contradicts those of Kamphorst et al. (2000)KAMPHORST, E.C.; JETTEN, V.; GUÉRIF, J.; PITKÄNEN, J.; IVERSEN, B.V.; DOUGLAS, J.T.; PAZ, A. How to predict maximum water storage in depressions from soil roughness measurements. Soil Science Society of America Journal, v.64, p.1749-1758, 2000. DOI: 10.2136/sssaj2000.6451749x.
https://doi.org/10.2136/sssaj2000.645174...
and Vidal Vázquez (2002)VIDAL VÁZQUEZ, E.; VIEIRA, S.R.; DE MARIA, I.C.; PAZ GONZÁLEZ, A. Fractal dimension and geostatistical parameters for soil microrelief as a function of cumulative precipitation. Scientia Agricola, v.67, p.78-83, 2010b. DOI: 10.1590/S0103-90162010000100011.
https://doi.org/10.1590/S0103-9016201000...
, who found significant linear associations between water storage in soil microdepressions and the R3 index.
Conclusions
-
Virtually all indexes, with the exception of R1 and fractal dimension, present lower values in the treatment without cultivation than in those where ryegrass (Lolium multiflorum) and vetch (Vicia sativa) roots were kept.
-
The values of the R3 and limiting difference indexes decrease in a similar proportion, compared with the initial values, in all evaluated treatments, as rainfall increases.
-
The intersection distance index shows a faster decrease from the beginning to the fifth rainfall event, compared with the other indexes.
-
Both the fractal dimension and the intersection distance show a clear difference between the treatment with ryegrass roots and the one with vetch roots.
-
All evaluated indexes, except R1, are strongly associated with soil losses in the treatments with cultivation, whereas the fractal dimension index is associated with water losses, but only in the treatment without cultivation.
Acknowledgments
To Conselho Nacional de Desenvolvimento Científico e Tecnológico (CNPq, project number 562404-2010-4) and to Fundação de Amparo à Pesquisa e Inovação do Estado de Santa Catarina (Fapesc, project number 5290-2011-6), for financial support;and to Coordenação de Aperfeiçoamento de Pessoal de Nível Superior (Capes), for scholarship granted to the first author.
References
- ALLMARAS, R.R.; BURWELL, R.E.; LARSON, W.E.; HOLT, R.F.; NELSON, W.W. Total porosity and roughness of the interrow zone as influenced by tillage. Washington: Usda, 1966. 22p. (Conservation Research Report, v.7).
- BERTOL, I.; AMARAL, A.J. do; VIDAL VÁZQUEZ, E.; PAZ GONZÁLES, A.; BARBOSA, F.T.; BRIGNONI, L.F. Relações da rugosidade superficial do solo com o volume de chuva e com a estabilidade de agregados em água. Revista Brasileira de Ciência do Solo, v.30, p.543-553, 2006. DOI: 10.1590/S0100-06832006000300014.
» https://doi.org/10.1590/S0100-06832006000300014 - BERTOL, I.; ZOLDAN JUNIOR, W.A.; FABIAN, E.L.; ZAVASCHI, E.; PEGORARO, R.; PAZ GONZÁLEZ, A. Efeito de escarificação e da erosividade de chuvas sobre algumas variáveis de valores de erosão hídrica em sistemas de manejo de um Nitossolo Háplico. Revista Brasileira de Ciência do Solo, v.32, p.747-757, 2008. DOI: 10.1590/S0100-06832008000200029.
» https://doi.org/10.1590/S0100-06832008000200029 - CORREA, I.M.C.; BERTOL, I.; RAMOS, J.C.; TAKIZAWA, M.M. Rugosidade da superfície de um Cambissolo Húmico relacionada com o preparo e compactação do solo sob chuva natural. Revista Brasileira de Ciência do Solo, v.36, p.567-576, 2012. DOI: 10.1590/S0100-06832012000200026.
» https://doi.org/10.1590/S0100-06832012000200026 - CURRENCE, H.D.; LOVELY, W.G. The analysis of soil surface roughness. Transactions of the ASAE, v.13, p.710 -714, 1970. DOI: 10.13031/2013.38702.
» https://doi.org/10.13031/2013.38702 - FERREIRA, F.F. Estatística básica. 2.ed. Lavras: UFLA, 2009. 664p.
- GARCÍA MORENO, R.; DÍAZ ÁLVAREZ, M.C.; REQUEJO, A.S.; TARQUIS, A.M. Multifractal analysis of soil surface roughness. Vadose Zone Journal, v.7, p.507-512, 2008. DOI: 10.2136/vzj2007.0016.
» https://doi.org/10.2136/vzj2007.0016 - KAMPHORST, E.C.; JETTEN, V.; GUÉRIF, J.; PITKÄNEN, J.; IVERSEN, B.V.; DOUGLAS, J.T.; PAZ, A. How to predict maximum water storage in depressions from soil roughness measurements. Soil Science Society of America Journal, v.64, p.1749-1758, 2000. DOI: 10.2136/sssaj2000.6451749x.
» https://doi.org/10.2136/sssaj2000.6451749x - LINDEN, D.R.; VAN DOREN JR., D.M. Parameters for characterizing tillage-induced soil surface roughness. Soil Science Society of America Journal, v.50, p.1560-1565, 1986. DOI: 10.2136/sssaj1986.03615995005000060035x.
» https://doi.org/10.2136/sssaj1986.03615995005000060035x - PAZ-FERREIRO, J.; BERTOL, I.; VIDAL VÁZQUEZ, E. Quantification of tillage, plant cover, and cumulative rainfall effects on soil surface microrelief by statistical, geostatistical and fractal indices. Nonlinear Processes in Geophysics, v.15, p.575-590, 2008. DOI: 10.5194/npg-15-575-2008.
» https://doi.org/10.5194/npg-15-575-2008 - R CORE TEAM. R: a language and environment for statistical computing. Vienna: R Foundation for Statistical Computing, 2016. Available at: ˂Available at: ˂http://www.R-project.org ˃. Accessed on: Oct. 2 2017.
» http://www.R-project.org - RAMOS, J.C. Cobertura e rugosidade da superfície na proposição de indicadores de qualidade de um Cambissolo Húmico relacionados ao controle da erosão hídrica. 2015. 202p. Tese (Doutorado) - Universidade do Estado de Santa Catarina, Lages.
- RAMOS, J.C.; BERTOL, I.; BARBOSA, F.T.; BERTOL, C.; MAFRA, Á.L.; MIQUELLUTI, D.J.; MECABÔ JÚNIOR, J. Water erosion in surface soil conditions: runoff velocity, concentration and D50 index of sediments in runoff. Scientia Agricola, v.73, p.286-293, 2016. DOI: 10.1590/0103-9016-2015-0110.
» https://doi.org/10.1590/0103-9016-2015-0110 - SCHICK, J.; BERTOL, I.; COGO, N.P.; PAZ GONZÁLEZ, A. Erosividade das chuvas de Lages, Santa Catarina. Revista Brasileira de Ciência do Solo, v.38, p.1890-1905, 2014. DOI: 10.1590/S0100-06832014000600024.
» https://doi.org/10.1590/S0100-06832014000600024 - SIQUEIRA, G.M.; DAFONTE, J.D.; VIDAL VÁZQUEZ, E.; ARMESTO, M.V. Distribuição espacial da rugosidade do solo em microparcelas experimentais sob diferentes intensidades de chuva simulada. Revista Brasileira de Ciências Agrárias, v.7, p.671-679, 2012.
- VIDAL VÁZQUEZ, E. Influencia de la precipitación y el laboreo en la rugosidad del suelo y la retención de agua en microdepresiones. 2002. 487p. Tese (Doutorado) - Universidade da Coruña, Coruña.
- VIDAL VÁZQUEZ, E.; BERTOL, I.; SIQUEIRA, G.M.; PAZ-FERREIRO, J.; DA FONTE, J.D. Evolution of the soil surface roughness using geostatistical analysis. Bragantia, v.69, p.141-152, 2010a. Suplemento. DOI: 10.1590/S0006-87052010000500015.
» https://doi.org/10.1590/S0006-87052010000500015 - VIDAL VÁZQUEZ, E.; MIRANDA, J.G.V.; PAZ GONZÁLEZ, A. Describing soil surface microrelief by crossover length and fractal dimension. Nonlinear Processes in Geophysics, v.4, p.223-235, 2007. DOI: 10.5194/npg-14-223-2007.
» https://doi.org/10.5194/npg-14-223-2007 - VIDAL VÁZQUEZ, E.; VIEIRA, S.R.; DE MARIA, I.C.; PAZ GONZÁLEZ, A. Fractal dimension and geostatistical parameters for soil microrelief as a function of cumulative precipitation. Scientia Agricola, v.67, p.78-83, 2010b. DOI: 10.1590/S0103-90162010000100011.
» https://doi.org/10.1590/S0103-90162010000100011 - VIVAS MIRANDA, J.G. Análisis fractal del microrrelieve del suelo. 2000. 313p. Tese (Doutorado) - Universidade da Coruña, Coruña.
- ZHAO, L.S.; LIANG, X.; WU, F. Soil surface roughness change and its effect on runoff and erosion on the Loess Plateau of China. Journal of Arid Land, v.6, p.400-409, 2014. DOI: 10.1007/s40333-013-0246-z.
» https://doi.org/10.1007/s40333-013-0246-z - ZOLDAN JUNIOR, W.A.; BERTOL, I.; PEGORARO, R.; FABIAN, E.L.; ZAVASCHI, E.; VIDAL VÁZQUEZ, E. Rugosidade superficial do solo formada por escarificação e influenciada pela erosividade da chuva. Revista Brasileira de Ciência do Solo, v.32, p.353-362, 2008. DOI: 10.1590/S0100-06832008000100033.
» https://doi.org/10.1590/S0100-06832008000100033
Publication Dates
-
Publication in this collection
June 2018
History
-
Received
09 June 2017 -
Accepted
21 Oct 2017