ABSTRACT
The use of crop models that integrate soil, climate, cultivar and management information may broaden the understanding of the interactions between soybean cropping system and local climate variability. This study aimed to analyze the potentiality of soybean in an Amazonian production environment, as well as to determine an optimal sowing window via agrometeorological modeling. A crop model was programmed to simulate the soybean yield for 18 sowing dates, obtained along 33 years of climatic data, under attainable and potential conditions. The simulated potential of soybean yield ranged from 3,785 kg ha-1 to 5,114 kg ha-1, owing to the local energy availability, whereas the average attainable yield ranged from 557 kg ha-1 to 4,700 kg ha-1, mainly because of the soil moisture conditions. The smallest difference between the potential and attainable yields was observed in the sowing dates from 01-Jan to 15-Feb. For this window, the probability of obtaining yields above 3,500 kg ha-1 was higher than 90 %.
KEYWORDS:
Glycine max; CROPGRO-Soybean; optimum sowing window
RESUMO
O uso de modelos de culturas que integram informações de solo, clima, cultivar e práticas de manejo pode ampliar a compreensão das interações entre o sistema de cultivo da soja e a variabilidade climática local. Objetivou-se analisar a potencialidade da soja em ambiente de produção amazônico, bem como determinar uma janela ótima de semeadura, por meio de modelagem agrometeorológica. Um modelo de cultura foi utilizado para simular o rendimento da soja para 18 datas de semeadura, ao longo de uma série histórica de 33 anos de dados meteorológicos, sob condições potencial e atingível. O rendimento potencial da soja variou de 3.785 kg ha-1 a 5.114 kg ha-1, devido à disponibilidade energética local. Por outro lado, o rendimento médio atingível variou de 557 kg ha-1 a 4.700 kg ha-1, devido, principalmente, às condições de umidade do solo. A menor diferença entre o rendimento potencial e o atingível foi observada entre as datas de semeadura 01 de janeiro e 15 de fevereiro, sendo que, nesta janela, a probabilidade de se obterem rendimentos acima de 3.500 kg ha-1 foi superior a 90 %.
PALAVRAS-CHAVE:
Glycine max; CROPGRO-Soybean; janela ótima de semeadura
INTRODUCTION
Despite several agrarian, environmental and social problems, soybean crops in the Amazon have intensified since the year 2000, owing to numerous structural and edaphoclimatic conditions (Fapespa 2015FUNDAÇÃO AMAZÔNIA DE AMPARO A ESTUDOS E PESQUISAS DO PARÁ (Fapespa). Boletim agropecuário do estado do Pará 2015. Belém: Fapespa, 2015.). The Pará state has shown a strong increase in the soybean production, with a yield of 2,968 (± 209) kg ha-1 (average of previous ten years), resembling to the Mato Grosso state (3,132 kg ha-1), that is the largest national soybean producer (Conab 2018COMPANHIA NACIONAL DE ABASTECIMENTO (Conab). Séries estatísticas. 2018. Available at: <http://www.conab.gov.br/conteudos.php?a=1252&t=>. Access on: Jan. 2019.
http://www.conab.gov.br/conteudos.php?a=...
). However, a lack of knowledge regarding the interaction of soybean crops with the Amazonian environment has created inconsistent information about the attainable potential of soybean crops in this region.
An approach about the potential yield and yield gaps could help to understand the interactions of the soybean production system with the Amazon agro-ecosystem and, at the same time, develop suitable strategies to improve the yield of a crop (Sentelhas et al. 2015SENTELHAS, P. C. et al. The soybean yield gap in Brazil: magnitude, causes and possible solutions for sustainable production. Journal of Agricultural Science, v. 153, n. 8 p. 1-18, 2015.). However, identifying the yields at different production levels and quantifying the yield gaps through field experiments may take many years of data collection, in order to make meaningful inferences.
An alternative would be the use of dynamic crop simulation models, since that, in recent years, this approach has been developed to predict crop growth, development and yield, using systems that integrate knowledge on the underlying processes and interaction of different crop production components (Jin et al. 2018JIN, X. et al. A review of data assimilation of remote sensing and crop models. European Journal of Agronomy, v. 92, n. 1, p. 141-152, 2018.). This crop models incorporate local climatic variability, soil conditions, crop genetic characteristics and management practices to enable a probabilistic approach to climatic risks and a more realistic prediction (Andarzian et al. 2015ANDARZIAN, B. et al. Determining optimum sowing date of wheat using CSM-CERES-wheat model. Journal of the Saudi Society of Agricultural Sciences, v. 14, n. 2, p. 189-199, 2015. )
The Decision Support System for Agrotechnology Transfer (DSSAT) is a computational system that incorporates many crop models, including the CROPGRO-Soybean one, that was developed to simulate the main processes of soybean growth, such as photosynthesis, transpiration, nitrogen fixation, leaf area increase, phenology stage progress, internode elongation and mass partitioning on a daily basis. The crop development in the CROPGRO uses a complex structure involving meteorological information, soil and cultivar data, in addition to management practices and, this way, the final predicted yield is the integrated result of all modeled processes limited by environmental factors such as air temperature, photoperiod, water and nitrogen stress. In the DSSAT, the development and growing process are a two-stage computation, in which the first step is to calculate the potential rate, considering the minimum of any environmental stress. In the second step, this potential rate is limited to attainable conditions, depending on stress factors. For example, if the potential transpiration demand is higher than the potential supply by the root system, a water stress factor by deficit is calculated. On the other hand, when the soil pore space becomes completely water-filled, then a stress factor by flooding is computed. In any case, the nodule senescence is enhanced, as well as the decline in the leaf nitrogen (N) concentration, causing a decline in the leaf and canopy photosynthesis (Boote et al. 1998aBOOTE, K. J.; JONES, J. W.; HOOGENBOOM, G. Simulation of crop growth: CROPGRO model. In: PEART, R. M.; CURRY, R. B. Agricultural systems modeling and simulation. New York: M. Dekker, 1998a. p. 651-691. and 1998bBOOTE, K. J. et al. The CROPGRO model for grain legumes. In: TSUJI, G. Y.; HOOGENBOOM, G.; THORNTON, P. K. Understanding options for agricultural production. Dordrecht: Kluwer, 1998b. p. 99-128.).
The CROPGRO-soybean model has been tested extensively, with its principal applications including the evaluation of the effects of climate change on crops growth (Ventrella et al. 2012VENTRELLA, D. et al. Climate change impact on crop rotations of winter durum wheat and tomato in southern Italy: yield analysis and soil fertility. Italian Journal of Agronomy, v. 7, n. 15, p. 100-108, 2012.); mitigation alternatives, such as the determination of the best time and density of sowing and nitrogen fertilizer application (Banterng et al. 2010BANTERNG, P. et al. Application of the Cropping System Model (CSM)-CROPGRO soybean for determining optimum management strategies for soybean in tropical environments. Journal of Agronomy and Crop Science, v. 196, n. 3, p. 231-242, 2010.); and water management (Moradi et al. 2013MORADI, R. et al. Adaptation strategies for maize cultivation under climate change in Iran: irrigation and planting date management. Mitigation and Adaptation Strategies for Global Change, v. 18, n. 2, p. 265-284, 2013.).
In order to try to understand the agricultural dynamics of soybean with the predominant climate risk factors in the Amazon region, the present study aimed to apply the CROPGRO-Soybean model, which was previously calibrated and validated, to analyze the potentiality of soybean in Paragominas, Pará state, Brazil, as well as to determine an optimal sowing window, assuming the yield gap by water deficit.
MATERIAL AND METHODS
The CROPGRO-Soybean model, which is part of the DSSAT V.4.6, was used. Its structure is based on submodules that retain climate, soil and crop information to simulate the soil-plant-atmosphere interaction, associated with management practices. To run this software, daily meteorological data are required, including air temperature (maximum and minimum), solar irradiance, rainfall, soil physical and chemical characteristics, as well as management information such as date and density of sowing, fertilization and irrigation, if used (Rauff & Bello 2015RAUFF, K. O.; BELLO, R. Review of crop growth simulation models as tools for agricultural meteorology. Agricultural Sciences, v. 6, n. 9, p. 1098-1105, 2015.).
The simulations were carried out in Paragominas (03º05′S, 47º20′W and 85 m above the sea level), which is the main soybean producer in the Pará state. The climate of this region is classified as warm and humid and, based on the Köppen-Geiger climate classification, it is Awi, which is characterized as rainy tropical, with an expressive dry season. The predominant soil in this region is the Yellow Latosol, with texture ranging from medium to very clayey, which is deep and well drained, but chemically poor (Rodrigues et al. 2003RODRIGUES, T. E. et al. Caracterização e classificação dos solos do município de Paragominas, estado do Pará. Belém: Embrapa Amazônia Oriental, 2003. (Documentos, 162).).
For the climate analysis and construction of the meteorological data file required by the model, a daily historical series of meteorological data from 1981 to 2013 was used, containing measurements of air temperature (maximum and minimum), rainfall and global solar radiance, that were obtained from the National Institute of Meteorology, National Water Agency and Embrapa Amazônia Oriental.
The main physical and soil chemical data necessary to create the soil database required by the DSSAT software (Table 1) were obtained from previous soil characterization studies in Paragominas (Rodrigues et al. 2003RODRIGUES, T. E. et al. Caracterização e classificação dos solos do município de Paragominas, estado do Pará. Belém: Embrapa Amazônia Oriental, 2003. (Documentos, 162).). Soil moisture values near to saturation, field capacity and permanent wilting point were determined by pedotransfer equations [θ10 = (0.5266 x clay + 0.3999 x silt + 3.1752 x SOC)/100, θ33 = (0.46 x clay + 0.3045 x silt + 2.0703 x SOC)/100 and θ1500 = (0.3624 x clay + 0.117 x silt + 1.6054 x SOC)/100, where θ10 , θ33 and θ1500 represent the volumetric water content near saturation, at field capacity and permanent wilting point (m3 m-3), respectively; clay and silt at dag kg-1; and SOC: soil organic carbon (dag kg-1), adjusted for tropical soils according to Batjes (1996)]. Other soil parameters, such as albedo (0.17), evaporation limit (6 mm), drainage rate (0.5 day-1) and runoff curve number (72) were set according to the DSSAT V4.6 software.
Characteristics of the soil layers of Paragominas (Pará state, Brazil) used to compose the soil file required by the DSSAT software.
Biological N-fixation was performed according to the DSSAT subroutines, whose parameters remained unchanged. In the DSSAT, the N-fixation will occur when the N uptake is less than the N demand. In this case, an amount of carbohydrate will be partitioned to nodules for N fixation, currently at a cost of 7.06 g of glucose g-1 of fixed N. The effects of environmental factors of temperature, water deficit, flooding and nodule age act on N fixing according to the DSSAT V4.6 software standards set.
Soybean yield was simulated by the CROPGRO-Soybean model of the DSSAT V4.6, using genetic coefficients obtained from the study by Lima (2016)LIMA, M. J. A. Aplicação do modelo CROPGRO-Soybean para otimizar épocas de semeadura e colheita da soja em polos de grãos do Pará. 2016. 68 f. Tese (Doutorado) - Universidade Federal Rural da Amazônia, Belém, 2016., by calibration studies, with the experimental data obtained from Paragominas between 2006 and 2009, using the BRS-Tracajá cultivar (maturation group 9.2), with determined growth and mean cycle of 100-110 days. During the calibration process, only half of the coefficients for soybean growth and development were modified, in addition to two ecotype coefficients (Table 2).
Genetic coefficients of generic soybean and BRS-Tracajá cultivar calibrated with experimental data obtained from the soil and climate conditions of Paragominas (Pará state, Brazil).
During the calibration and validation processes, this model showed a satisfactory performance, with less than three days of error, for estimating the occurrence of the principal phenological phases, simulating the biomass curves of leaf, stem and pod + grain with more than 92 % of agreement with the respective observed values and showing an average error lower than 5 % for yield estimates (Lima 2016LIMA, M. J. A. Aplicação do modelo CROPGRO-Soybean para otimizar épocas de semeadura e colheita da soja em polos de grãos do Pará. 2016. 68 f. Tese (Doutorado) - Universidade Federal Rural da Amazônia, Belém, 2016.).
After calibration and validation, the DSSAT was programmed to simulate 18 sowing dates, performed on the 1st and 15th day of each month, starting in September and ending in May, in each of the 33 years of the historical series (1981-2013), resulting in 594 yield simulations.
This long-term simulations for potential yield were carried out under two scenarios, i.e., water non-limiting and limiting. For the water non-limiting potential yield, the water, nutrient and pest controls switches of the model were kept off. For simulation of the water limiting yield, only the water balance switch of the model was activated (Bhatia et al. 2008).
The management practices adopted in the simulation were similar to those used by the local producers, i.e., line spacing of 50 cm, sowing density of 200,000 plants ha-1 and fertilizing with 640 kg ha-1 of NPK (2:20:18).
In this study, the yield gap was quantified by percent differences between the water non-limiting yield, here named potential yield (Yp), and water limiting yield, here named attainable yield (Ya), as descried by Sentelhas et al. (2015)SENTELHAS, P. C. et al. The soybean yield gap in Brazil: magnitude, causes and possible solutions for sustainable production. Journal of Agricultural Science, v. 153, n. 8 p. 1-18, 2015.: Yg = [1 - (Ya/Yp)] x 100, where Yg is the yield gap by water deficit (%), Ya the attainable simulated yield (kg ha-1) and Yp the potential simulated yield (kg ha-1). A 95 % confidence interval was estimated using the bootstrap resampling technique (Efron & Tibshirani 1986EFRON, B.; TIBSHIRANI, R. Confidence intervals based on bootstrap percentiles. In: EFRON, B. An introduction to the bootstrap. New York: Chapman & Hill, 1993. p. 168-177. ).
The bootstrap technique is a resampling method that determines the confidence interval for statistics whose probability distribution is unknown. The native bootstrap statistical package of the R programming environment was used to create 1,000 resamplings with replacement of the simulated yield gap to construct the empirical distribution and determine the 2.5 % and 97.5 % percentiles to obtain a 95 % confidence probability interval.
RESULTS AND DISCUSSION
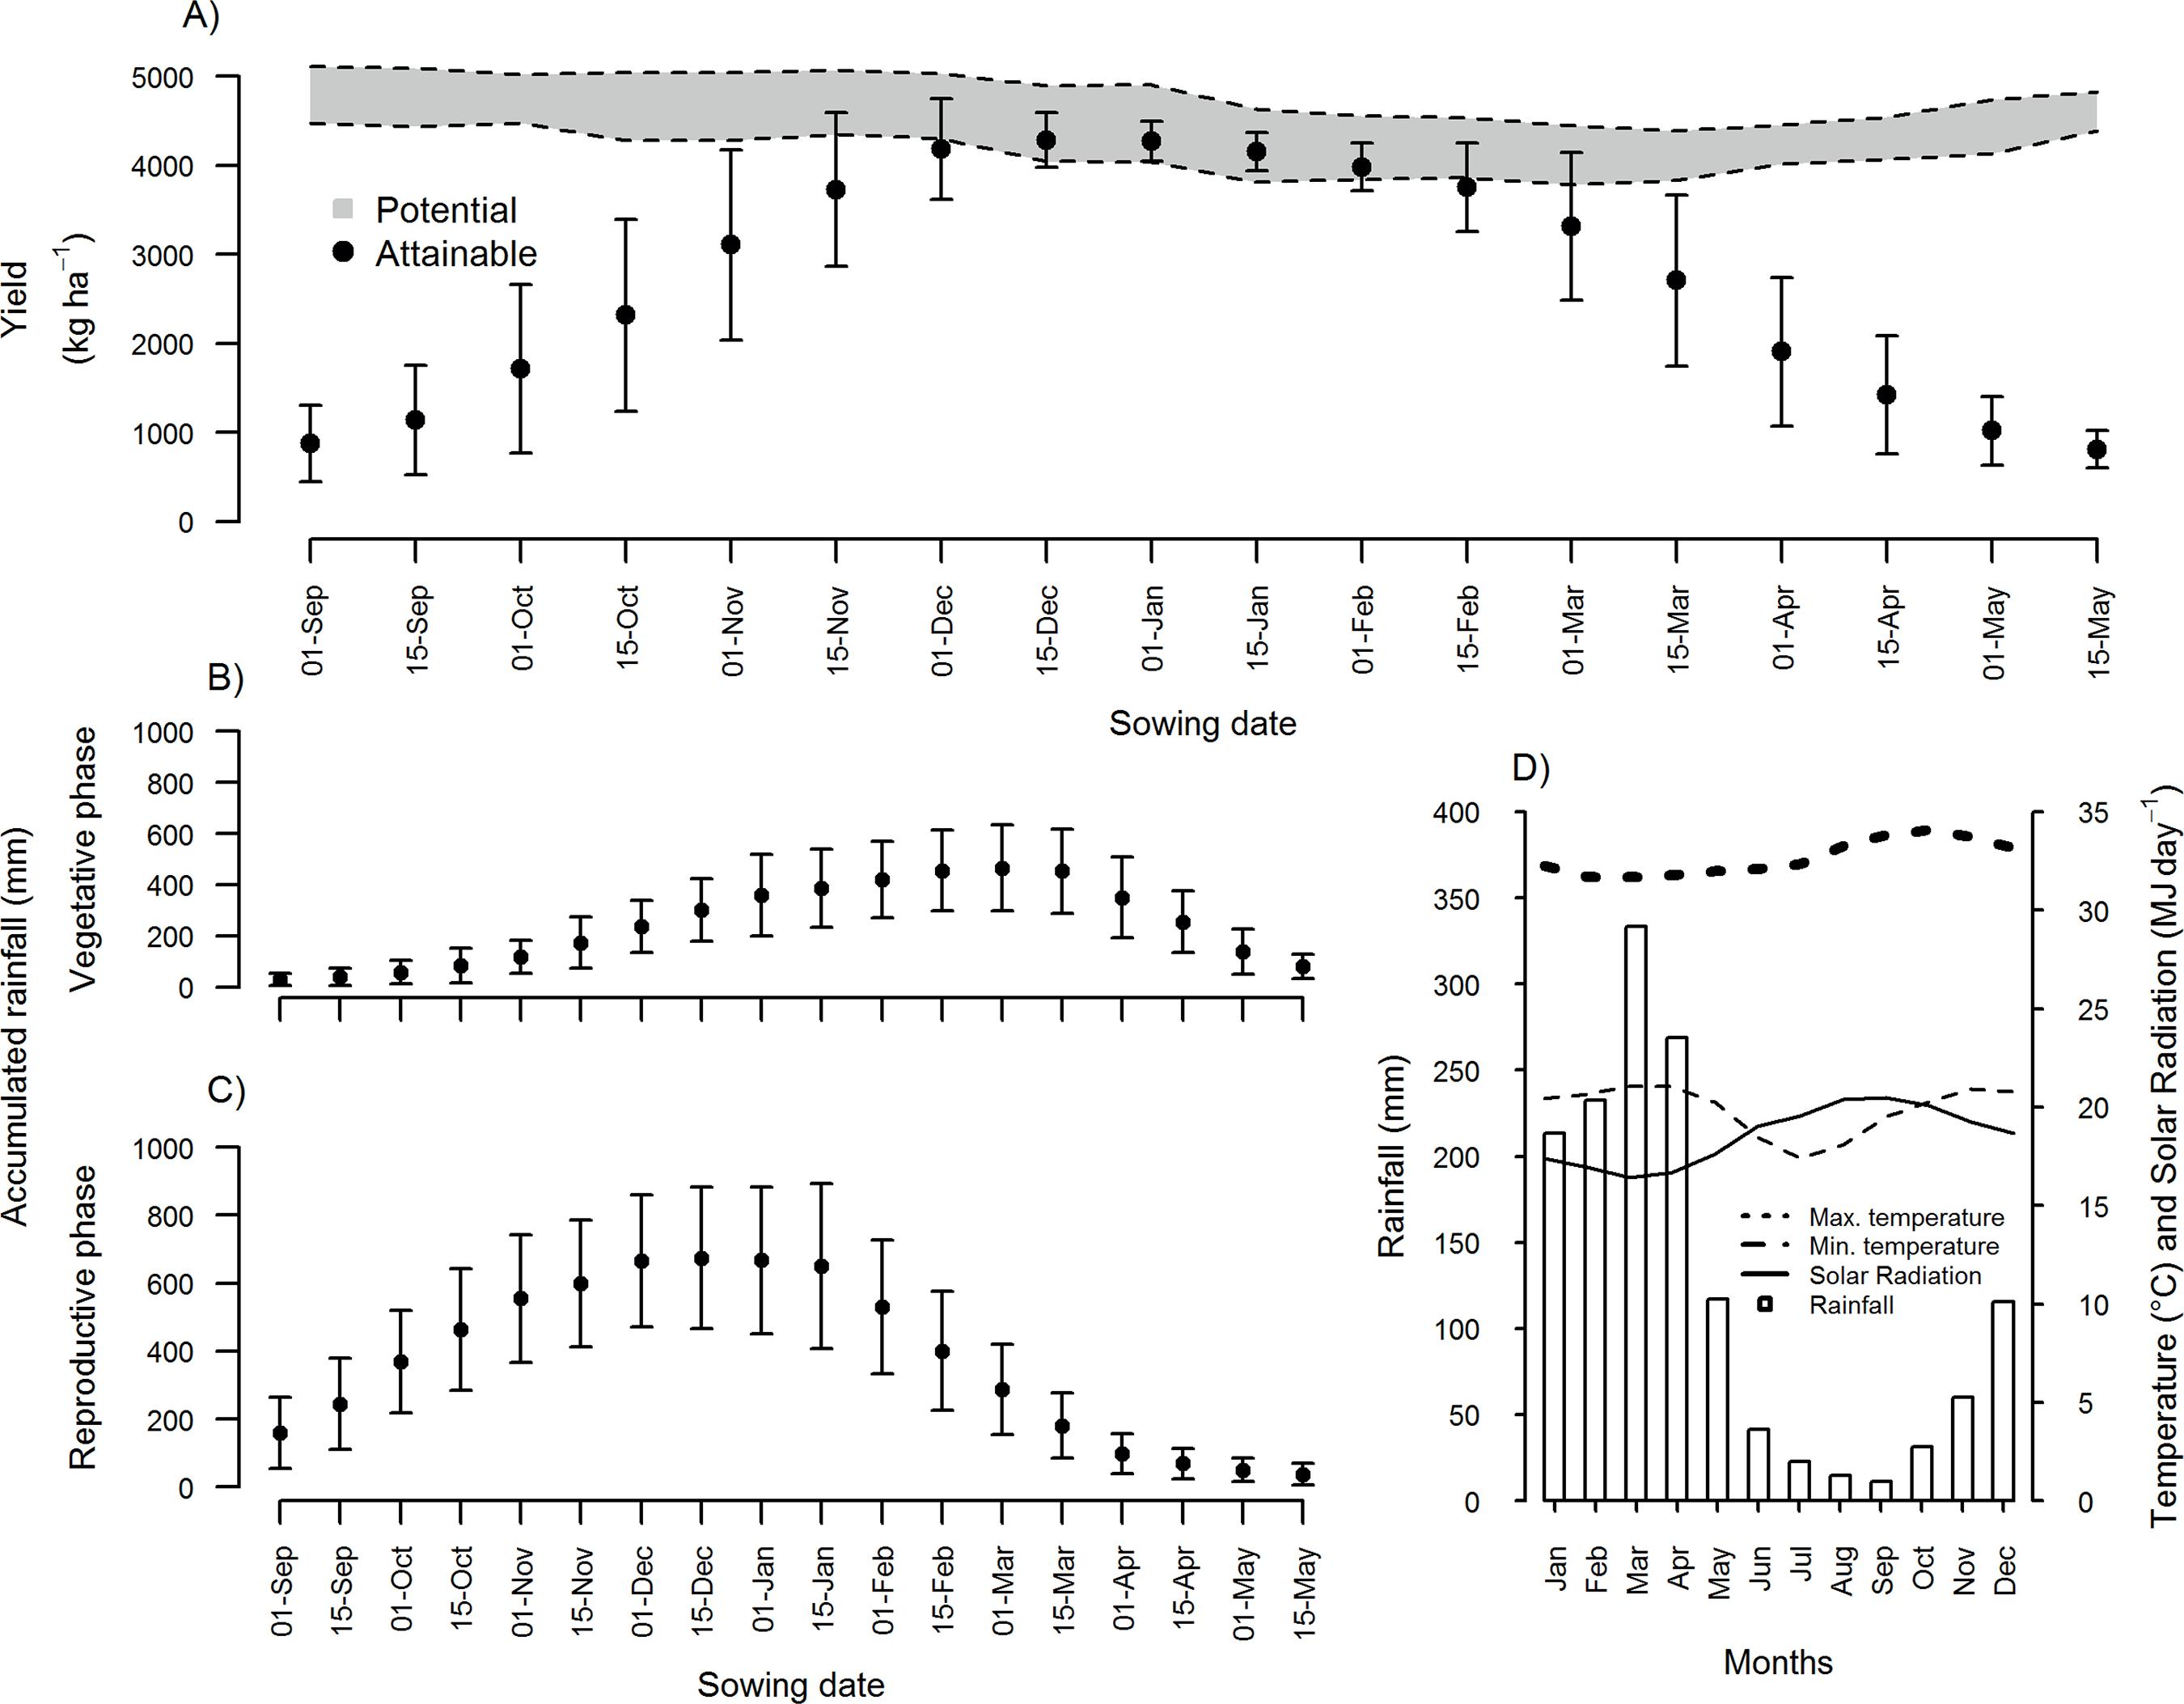
The simulated potential yield (Yp) of soybean measured by the CROPGRO-Soybean model under the soil and climate conditions found in Paragominas ranged from 3,785 kg ha-1 to 5,114 kg ha-1 (Figure 1A). This variation suggests that solar irradiance limits the Yp, because the sowing dates between December and March had Yp values lower than 4,500 kg ha-1. Thus, the crop cycle was exposed to a period of low solar radiation intensity (December-June), coinciding with the rainiest season of the region (Figure 1D).
Simulations of potential and attainable yield by water deficit in Paragominas (Pará state, Brazil) (A), accumulated rainfall during the vegetative (B) and reproductive (C) phases and climatology of Paragominas, considering a historical series of 33 years (1981-2013) (D). The gray area represents the 95 % confidence interval for the mean and bars represent the standard deviation considering 33 simulations.
Previous studies on solar irradiance use efficiency of soybean crops in the field (conventional experiment) have shown that the low incidence of solar irradiance negatively compromised the production of photoassimilates mainly during the vegetative phase, when there was a higher energy demand that reflected negatively on the crop yield (Souza et al. 2011SOUZA, P. J. O. P. et al. Simulation of soybean growth and yield under northeastern Amazon climatic conditions. Pesquisa Agropecuária Brasileira, v. 46, n. 6, p. 567-577, 2011., Zanon Júnior et al. 2015ZANON JÚNIOR, A. et al. Development of soybean cultivars as a function of maturation group and growth type in high lands and in lowlands. Bragantia, v. 74, n. 4, p. 400-411, 2015., Petter et al. 2016PETTER, F. A. et al. Does high seeding density increase soybean productivity?: photosynthetically active radiation responses. Bragantia, v. 75, n. 2, p. 173-183, 2016. ). However, the results of the present study indicate that, if the soil moisture conditions were maintained, the crop would have the potential to obtain yields higher than 3,500 kg ha-1 (Figure 1A), with average solar irradiance of 16 MJ day-1, which was the lowest value observed in this region (Figure 1D).
The CROPGRO-Soybean model has submodules that simulate plant parts that are sensitive to the interception of solar irradiance and contain different levels of canopy cover (Alagarswamy et al. 2006ALAGARSWAMY, G. et al. Evaluating the CROPGRO-soybean model ability to simulate photosynthesis response to carbon dioxide levels. Agronomy Journal, v. 98, n. 1, p. 34-42, 2006.). The application of these submodules may help to select cultivars with foliar architectures that are more efficient for light absorption, and may also indicate management practices and techniques that maximize light interception. The agrometeorological modeling can accelerate the process of generating technological information, which is fundamental for adapting management practices for the Amazonian environment.
Differently from the results obtained for the Yp, the Ya showed a higher variability (557-4,690 kg ha-1) for sowing between 01-Sep and 15-May, mainly because of the higher variation in water supply during the crop cycle (72-1,403 mm cycle-1). However, an optimum sowing window was observed from 01-Dec to 15-Feb, which favored a higher yield and lower yield variation (Figure 1A).
For the optimum sowing window conditions, the cycle length of the BRS-Tracajá cultivar ranged from 109 to 121 days, with yields above 3,500 kg ha-1, measured in more than 97 % of the simulations, and average accumulated rainfall of 958 (± 276) mm cycle-1. However, this potential shown by the field investigation is rarely achieved, because the occurrence of pests, diseases and soil heterogeneity are limiting factors not included in the model. One example of such a pest is the Asian soybean rust (Phakopsora pachyrhizi Sydow & Sydow), which is a highly destructive fungal disease that may reduce the soybean yield by more than 65 % (Hikishima et al. 2010HIKISHIMA, M. et al. Relationships among disease intensity, canopy reflectance and grain yield in the Asian soybean rust pathosystem. Tropical Plant Pathology, v. 35, n. 1, p. 96-103, 2010.).
However, conventional studies conducted in field investigations have shown that the achievement of high yields (> 3,500 kg ha-1) by soybean is conditioned to rainfall between 700 mm cycle-1 and 1,200 mm cycle-1 (Gercek et al. 2009GERCEK, S. et al. Water pillow irrigation compared to furrow irrigation for soybean production in a semi-arid area. Agricultural Water Management, v. 96, n. 1, p. 87-92, 2009., Lamm et al. 2010LAMM, F. R.; KHEIRA, A. A.; TROOIEN, T. P. Sunflower, soybean and grain sorghum crop production as affected by drip line depth. American Society of Agricultural and Biological Engineer, v. 26, n. 5, p. 873-882, 2010., Candogan et al. 2013CANDOGAN, B. N. et al. Yield, quality and crop water stress index relationships for deficit-irrigated soybean [Glycine max (L.) Merr.] in sub-humid climatic conditions. Agricultural Water Management, v. 118, n. 2, p. 113-121, 2013.). These measurements were similar to those found in the present simulation study and corroborate the model sensitivity in quantifying the water deficit effects on soybean yield.
Sowing prior to the optimum window, i.e., between 01-Sep and 01-Dec, showed a high dispersion of yield values (506-4,601 kg ha-1), mainly owing to rainfall variability during the growth phase (Figure 1B). During this period, the average daily rainfall was 1.7 (± 1.6) mm day-1, which was lower than the real water demand (3-5 mm day-1) for the soybean during this developmental stage (Morando et al. 2014MORANDO, R. et al. Water deficit: effect on soybean crop. Journal of Agronomic Sciences, v. 3, n. 2, p. 114-129, 2014., Souza et al. 2016SOUZA, P. J. O. P. et al. Soybean water requirement in northeast of Pará state. Irriga, v. 1, n. 1, p. 218-231, 2016.).
The soybean cycle, specifically the vegetative phase, was exposed to higher levels of solar irradiance during the optimum window from 01-Sep to 01-Dec (Figure 1D); however, the water deficit events considerably decreased the canopy development rate, resulting in a structure that was unable to sustain high yields. Therefore, the intercepted solar irradiance was also reduced, what caused decreases in the total biomass and final yield (Adeboye et al. 2015ADEBOYE, O. B. et al. Crop water productivity and economic evaluation of drip irrigated soybeans (Glyxine max L. Merr.). Agricuture and Food Security, v. 4, n. 1, p. 1-13, 2015. ).
Late sowing performed between 15-Feb and 15-May also showed a high yield variability (605-4,040 kg ha-1); however, the larger variability of accumulated rainfall during the reproductive phase (75-427 mm) might have significantly influenced this result (Figure 1C). During this period, the crop received rainfall from 1 mm day-1 to 5 mm day-1, whereas the real crop demand was from 4.5 mm day-1 to 7 mm day-1, on average (Morando et al. 2014MORANDO, R. et al. Water deficit: effect on soybean crop. Journal of Agronomic Sciences, v. 3, n. 2, p. 114-129, 2014., Souza et al. 2016SOUZA, P. J. O. P. et al. Soybean water requirement in northeast of Pará state. Irriga, v. 1, n. 1, p. 218-231, 2016.).
Generally, when soybean experiences water deficiencies during the reproductive phase, it shortens its growth cycle, especially the grain filling stage, resulting in grains with low weight, what seriously compromises the final yield (Hu & Wiatrac 2012HU, M.; WIATRAK, P. Effect of planting date on soybean growth, yield, and grain quality: review. Agronomy Journal, v. 104, n. 3, p. 785-790, 2012.). These results reflect the common rainfall conditions of this area, mainly during the growing season of the crop, what indicates that rain events represent the principal climate variable that limits the soybean production in Paragominas, due to lower air temperature variability (20-35 ºC) and solar irradiance (16-22 MJ day-1) in the study area (Figure 1D).
The identification of periods with favorable and unfavorable climatic conditions to the optimal agronomic performance of soybean is of great importance for producers and researchers, because this information allows the optimization of the use of natural resources and creates management strategies that adjust the production system to environmental conditions aimed at high yields and low risks.
In relative terms, the present study showed that the mean yield loss of soybean was lower than 15 % for sowing performed in the beginning of December to the middle of February in more than 95 % of the simulations. A mean yield loss of up to 20 % in sowing was observed on 15-Nov and 01-Mar. However, both sowing dates showed variation from 15 % to 27 %, based on the 95 % confidence interval (Figure 2A).
Mean yield gap by water deficit associated with the 95 % confidence interval (A) and yield probability for sowing dates that showed yield loss < 20 % (B).
From 15-Feb, the mean yield loss increased almost linearly at a rate of approximately 1 % for each day of delayed sowing. The same was observed for each anticipated day from 01-Dec, reaching breakages of over 80 % in sowings performed on 01-Sep and 15-May. This was caused by the water deficiency that occurred during the vegetative and reproductive phases, in periods before and after the optimum window, as previously discussed.
Although sowing in December showed higher yields and lower yield losses than sowing during other times, this practice is not recommended, because of the high probability of rain events during the physiological maturation and harvest phases, i.e., soybean sown in December will be harvested in April, coinciding with the rainiest period of the region.
These results are very similar to those obtained by Lambert et al. (2007)LAMBERT, E. S.; MEYER, M. C.; KLEPKER, D. Cultivares de soja 2007/2008: regiões Norte e Nordeste. Londrina: Embrapa Soja, 2007. (Documentos, 184)., which were based on numerous conventional experiments in several locations and in different years in Paragominas, which determined an optimum window of 47 days, between 15-Dec and 31-Jan.
The optimum window determined in the present study was contained in the sowing window published by the Agricultural Zoning of Climate Risk (Brazil 2015BRASIL. Portaria n. 224, de 29 de setembro de 2015. Aprova o zoneamento agrícola de risco climático para a cultura de soja no estado do Pará, ano-safra 2015/2016. Diário Oficial da União, Brasília, DF, 30 set. 2015. Seção 1. p. 55.) for the Pará state, which was based on the study of the soil water balance associated with phenological phases of the crop that are more sensitive to water deficits, and that determined an optimum window of 150 days between 01-Dec and 30-Apr.
The discrepancy between the optimum window determined by the Zoning of Climate Risk, previously commented, and that obtained in the present study using the CROPGRO-Soybean model is related to the simplified methodology used by the Zoning of Climate Risk, which completely disregarded the effects of drought on the duration of the vegetative and reproductive crop phases, as well as the possible excessive rainfall during the harvest period. Thus, the optimum window in the most recent Zoning of Climate Risk was larger than the optimum window calculated in the present study. The simplification of the process may generate information; however, the result obtained can be very generic.
The present study also showed the high sensitivity of the CROPGRO-Soybean model to environmental variations. For example, even within the sowing season with yield loss lower than 20 % (15-Dec to 01-Mar), the probability of reaching yields greater than 3,500 kg ha-1 varied considerably, because sowing between 15-Dec and 01-Feb presented a probability above 90 %, whereas previous or later sowing on 15-Nov and 01-Mar presented 61 % and 58 %, respectively (Figure 2B).
The sensitivity of the CROPGRO-Soybean model has been reported in previous studies (Banterng et al. 2010BANTERNG, P. et al. Application of the Cropping System Model (CSM)-CROPGRO soybean for determining optimum management strategies for soybean in tropical environments. Journal of Agronomy and Crop Science, v. 196, n. 3, p. 231-242, 2010., Paknejad et at. 2012PAKNEJAD, F. et al. Simulation of soybean growth under sowing date management by CROPGRO model. American Journal of Agricultural and Biological Sciences, v. 7, n. 2, p. 143-149, 2012. ) that simulated several growth conditions with different sowing densities, nitrogen doses and sowing dates. Other relevant applications of agrometeorological modeling may be exemplified in the study by Paz et al. (2012)PAZ, J. O. et al. Cotton yields as influenced by ENSO at different planting dates and spatial aggregation levels. Agricultural Systems, v. 111, n. 1, p. 45-52, 2012., who used the CROPGRO-Cotton model to evaluate the effect of water stress on cotton crop caused by climatic events such as El Niño and La Niña, and obtained a good agreement of the simulations with the observed results. These studies have demonstrated the potential of modeling as a tool to support agricultural planning and management practices.
CONCLUSION
Paragominas (Pará state, Brazil) presents a high climatic potential for soybean production, and the CROPGRO-Soybean model was effective on determining the optimum window and generating technological information such as soybean water demand and yield loss risk associated with sowing dates.
ACKNOWLEDGMENTS
The first author thanks the Fundação Amazônia de Amparo a Estudos e Pesquisas do Pará (Fapespa) and Coordenação de Aperfeiçoamento de Pessoal de Nível Superior (Capes), for granting a PhD scholarship in Brazil and in the USA, respectively.
REFERENCES
- ADEBOYE, O. B. et al. Crop water productivity and economic evaluation of drip irrigated soybeans (Glyxine max L. Merr.). Agricuture and Food Security, v. 4, n. 1, p. 1-13, 2015.
- ALAGARSWAMY, G. et al. Evaluating the CROPGRO-soybean model ability to simulate photosynthesis response to carbon dioxide levels. Agronomy Journal, v. 98, n. 1, p. 34-42, 2006.
- ANDARZIAN, B. et al. Determining optimum sowing date of wheat using CSM-CERES-wheat model. Journal of the Saudi Society of Agricultural Sciences, v. 14, n. 2, p. 189-199, 2015.
- BANTERNG, P. et al. Application of the Cropping System Model (CSM)-CROPGRO soybean for determining optimum management strategies for soybean in tropical environments. Journal of Agronomy and Crop Science, v. 196, n. 3, p. 231-242, 2010.
- BOOTE, K. J.; JONES, J. W.; HOOGENBOOM, G. Simulation of crop growth: CROPGRO model. In: PEART, R. M.; CURRY, R. B. Agricultural systems modeling and simulation New York: M. Dekker, 1998a. p. 651-691.
- BOOTE, K. J. et al. The CROPGRO model for grain legumes. In: TSUJI, G. Y.; HOOGENBOOM, G.; THORNTON, P. K. Understanding options for agricultural production Dordrecht: Kluwer, 1998b. p. 99-128.
- BRASIL. Portaria n. 224, de 29 de setembro de 2015. Aprova o zoneamento agrícola de risco climático para a cultura de soja no estado do Pará, ano-safra 2015/2016. Diário Oficial da União, Brasília, DF, 30 set. 2015. Seção 1. p. 55.
- CANDOGAN, B. N. et al. Yield, quality and crop water stress index relationships for deficit-irrigated soybean [Glycine max (L.) Merr.] in sub-humid climatic conditions. Agricultural Water Management, v. 118, n. 2, p. 113-121, 2013.
- COMPANHIA NACIONAL DE ABASTECIMENTO (Conab). Séries estatísticas 2018. Available at: <http://www.conab.gov.br/conteudos.php?a=1252&t=>. Access on: Jan. 2019.
» http://www.conab.gov.br/conteudos.php?a=1252&t= - EFRON, B.; TIBSHIRANI, R. Confidence intervals based on bootstrap percentiles. In: EFRON, B. An introduction to the bootstrap New York: Chapman & Hill, 1993. p. 168-177.
- FUNDAÇÃO AMAZÔNIA DE AMPARO A ESTUDOS E PESQUISAS DO PARÁ (Fapespa). Boletim agropecuário do estado do Pará 2015 Belém: Fapespa, 2015.
- GERCEK, S. et al. Water pillow irrigation compared to furrow irrigation for soybean production in a semi-arid area. Agricultural Water Management, v. 96, n. 1, p. 87-92, 2009.
- HIKISHIMA, M. et al. Relationships among disease intensity, canopy reflectance and grain yield in the Asian soybean rust pathosystem. Tropical Plant Pathology, v. 35, n. 1, p. 96-103, 2010.
- HU, M.; WIATRAK, P. Effect of planting date on soybean growth, yield, and grain quality: review. Agronomy Journal, v. 104, n. 3, p. 785-790, 2012.
- JIN, X. et al. A review of data assimilation of remote sensing and crop models. European Journal of Agronomy, v. 92, n. 1, p. 141-152, 2018.
- LAMBERT, E. S.; MEYER, M. C.; KLEPKER, D. Cultivares de soja 2007/2008: regiões Norte e Nordeste. Londrina: Embrapa Soja, 2007. (Documentos, 184).
- LAMM, F. R.; KHEIRA, A. A.; TROOIEN, T. P. Sunflower, soybean and grain sorghum crop production as affected by drip line depth. American Society of Agricultural and Biological Engineer, v. 26, n. 5, p. 873-882, 2010.
- LIMA, M. J. A. Aplicação do modelo CROPGRO-Soybean para otimizar épocas de semeadura e colheita da soja em polos de grãos do Pará 2016. 68 f. Tese (Doutorado) - Universidade Federal Rural da Amazônia, Belém, 2016.
- MORADI, R. et al. Adaptation strategies for maize cultivation under climate change in Iran: irrigation and planting date management. Mitigation and Adaptation Strategies for Global Change, v. 18, n. 2, p. 265-284, 2013.
- MORANDO, R. et al. Water deficit: effect on soybean crop. Journal of Agronomic Sciences, v. 3, n. 2, p. 114-129, 2014.
- PAKNEJAD, F. et al. Simulation of soybean growth under sowing date management by CROPGRO model. American Journal of Agricultural and Biological Sciences, v. 7, n. 2, p. 143-149, 2012.
- PAZ, J. O. et al. Cotton yields as influenced by ENSO at different planting dates and spatial aggregation levels. Agricultural Systems, v. 111, n. 1, p. 45-52, 2012.
- PETTER, F. A. et al. Does high seeding density increase soybean productivity?: photosynthetically active radiation responses. Bragantia, v. 75, n. 2, p. 173-183, 2016.
- RAUFF, K. O.; BELLO, R. Review of crop growth simulation models as tools for agricultural meteorology. Agricultural Sciences, v. 6, n. 9, p. 1098-1105, 2015.
- RODRIGUES, T. E. et al. Caracterização e classificação dos solos do município de Paragominas, estado do Pará Belém: Embrapa Amazônia Oriental, 2003. (Documentos, 162).
- SENTELHAS, P. C. et al. The soybean yield gap in Brazil: magnitude, causes and possible solutions for sustainable production. Journal of Agricultural Science, v. 153, n. 8 p. 1-18, 2015.
- SOUZA, P. J. O. P. et al. Simulation of soybean growth and yield under northeastern Amazon climatic conditions. Pesquisa Agropecuária Brasileira, v. 46, n. 6, p. 567-577, 2011.
- SOUZA, P. J. O. P. et al. Soybean water requirement in northeast of Pará state. Irriga, v. 1, n. 1, p. 218-231, 2016.
- VENTRELLA, D. et al. Climate change impact on crop rotations of winter durum wheat and tomato in southern Italy: yield analysis and soil fertility. Italian Journal of Agronomy, v. 7, n. 15, p. 100-108, 2012.
- ZANON JÚNIOR, A. et al. Development of soybean cultivars as a function of maturation group and growth type in high lands and in lowlands. Bragantia, v. 74, n. 4, p. 400-411, 2015.
Publication Dates
-
Publication in this collection
18 July 2019 -
Date of issue
2019
History
-
Received
24 Aug 2018 -
Accepted
15 Feb 2019 -
Published
03 June 2019