Abstract
Poly(phenylene sulfide) (PPS) is an engineering thermoplastic polymer that presents high temperature resistance (glass transition temperature around 85 ºC and melting point at 285 ºC). These properties combined with its mechanical properties and its high chemical resistance allows its use in technological applications such as molding resins and as matrix for structural thermoplastic composites. During the manufacture of thermoplastic composites, the polymer is exposed to repeated melting, quenching and crystallization processes. The properties of semicrystalline polymers, such as PPS, depend on its crystallization behavior. This work deals with the PPS crystallization kinetics under different thermal cycles. This study was performed under isothermal conditions in a differential scanning calorimetry (DSC), coupled to Perkin Elmer crystallization software referred to as Pyris Kinetics - Crystallization. The results were correlated with microscopic analyses carried out in a polarized light microscope, equipped with a controlled heating and cooling accessory. In this case, the experimental conditions were the same adopted for the DSC analyses. From the results, parameters could be established to be used in the composite manufacture.
PPS; DSC; crystallinity; Polarized; Light Microscope
ARTIGO TÉCNICO CIENTÍFICO
Study of crystallization behavior of poly(phenylene sulfide)
Liliana B. NoharaI; Evandro L. NoharaII; Andreza MouraIII; Joseane M. R. P. GonçalvesIII; Michelle L. CostaIV; Mirabel C. RezendeIV
IDepartamento de Engenharia Aeronáutica e Mecânica, ITA
IIDepartamento de Engenharia Mecânica, UNITAU
IIIDivisão de Materiais, IAE, CTA; Departamento de Engenharia Aeronáutica e Mecânica, ITA
IVDivisão de Materiais, IAE, CTA
Corresponding author Corresponding author: Mirabel C. Rezende Divisão de Materiais, IAE, CTA Praça Marechal-do-Ar Eduardo Gomes 50 - Vila das Acácias CEP: 12228-904, São José dos Campos, SP E-mail: mirabel@iae.cta.br
ABSTRACT
Poly(phenylene sulfide) (PPS) is an engineering thermoplastic polymer that presents high temperature resistance (glass transition temperature around 85 ºC and melting point at 285 ºC). These properties combined with its mechanical properties and its high chemical resistance allows its use in technological applications such as molding resins and as matrix for structural thermoplastic composites. During the manufacture of thermoplastic composites, the polymer is exposed to repeated melting, quenching and crystallization processes. The properties of semicrystalline polymers, such as PPS, depend on its crystallization behavior. This work deals with the PPS crystallization kinetics under different thermal cycles. This study was performed under isothermal conditions in a differential scanning calorimetry (DSC), coupled to Perkin Elmer crystallization software referred to as Pyris Kinetics - Crystallization. The results were correlated with microscopic analyses carried out in a polarized light microscope, equipped with a controlled heating and cooling accessory. In this case, the experimental conditions were the same adopted for the DSC analyses. From the results, parameters could be established to be used in the composite manufacture.
Keywords: PPS, DSC, crystallinity, Polarized Light Microscope.
Introduction
The poly(phenylene sulfide) has attracted considerable interest as engineering polymer due to its both high modulus and tensile strength and its good dimensional stability. Its high deflection temperature (around 227 ºC), flame resistance, and excellent stability in organic liquids determine many of its applications. These properties make the PPS a polymer particularly useful in automotive and electronic industries[1-3]. The PPS is largely used in the manufacture of ball valves, electrical sockets, battery and telephone components, optical-fiber cables, electronic component encapsulation, and as a thermoplastic matrix for advanced composites[4]. The solvent resistance of this polymer limits the PPS characterization. There is no solvent for PPS below 210 ºC; except the a-chloronaphthalene that solves partially the PPS at this temperature[5]. This behavior makes very difficult its molecular weight determination by intrinsic viscosity, light scattering and gel permeation chromatography measurements.
The crystalline structure of PPS is orthorhombic and its intramolecular repeating unit reflects an extended backbone in which the sulfide group defines a planar zig-zag conformation as shown in Figure 1. The unit cell dimensions of PPS consist of: a=0.867 nm; b=0.561 nm; c=1.026 nm (Figure 1). The phenyl rings are inclined in an alternating manner to the backbone plane, the angle of inclination being assumed to lie in the 40-45º range. It is well known that thermal transitions for this polymer occur exceptionally at high temperatures, in comparison to aliphatic polymers, due to the restricted mobility of the chains imposed by phenyl groups on backbone[6,7] .
The properties of semicrystalline polymers, such as PPS, depend on the degree of crystallinity and morphology of polymeric structure. Some studies have been carried out to investigate the crystalline structure, morphology, thermal stability and crystallization kinetics of PPS[6,7].
Analogously to poly(ether-ether-ketone) (PEEK) and poly(phenyl-ether-ketone) (PEK), PPS is a polymer that crystallizes slowly, when compared to other conventional polymers without aromatic groups, for example the polyethylene or poly(methylene oxide), and specimens fully crystallized show comparatively low crystallinity (commonly near 50%)[6,7].
The effect of thermal treatment on polymer morphology can be studied by differential scanning calorimetry (DSC). In semicrystalline polymers, the DSC scans show glass transition temperature (Tg) and crystalline melting point (Tm). The heating of a semicrystalline polymer above its Tm will melt the polymer, and the cooling process will solidify the polymer in an organized manner restoring its crystalline arrangement. The crystals formation is identified by the appearance of an exothermic peak corresponding to crystallization temperature (Tc). On the other hand, if the sample is heated up to Tm and quenched below the Tg, it becomes solid. However, the polymeric chains will not have time to organize and to form crystalline regions, i.e., the sample is in amorphous solid state, in spite of its tendency to crystallize[8,9].
Since the changes in thermoplastic crystallinity results in significant modification of mechanical properties of composites, in particular those in which the matrix is dominant, such as compression or creep[9], the study of crystalline morphology of matrix for applications in thermoplastic composites is essential to understand the structure and the behavior for these materials.
The purpose of this work is to study the effect of thermal cycles on the crystallization kinetics of PPS, under isothermal conditions using differential scanning calorimetry coupled to crystallization software. The kinetic model adopted in this study is based on Avrami equation. The kinetics results were correlated to images obtained by a polarized light microscope (PLM) coupled to controlled heating and cooling system. It were used the same experimental conditions in DSC analysis. The obtained results allowed establishing parameters to be used in processing of carbon fiber/PPS composites and to demonstrate that the investigation with polarized light microscope can be decisive in the adequate choice of these parameters.
Materials and Methods
It was used a poly(phenylene sulfide) sample purchased from Ticona Polymers, grade Fortron 0214B1.
Study of crystallization kinetics
The DSC analysis were carried out in Perkin-Elmer Pyris 1 differential scanning calorimetry, previously calibrated with indium and zinc and operated under a constant nitrogen flux (20mL/min) and scanning rate of 10 ºC/min. The samples of PPS (~15 mg) were encapsulated into a sample holder of aluminum. Initially a non-isothermal scanning (30 ºC to 340 ºC, at 10 ºC/min) was carried out to obtain the knowledge of PPS crystallization temperature and melting point. Afterwards, the samples were heated at 10 ºC/min from room temperature up to the thermodynamic melting point of PPS (340 ºC)[10], holding for 2 minutes at this temperature to allow the complete melting of all crystals, in order to destroy all crystals that can act as seeds during the crystallization. Afterwards, the samples were cooled at 100 ºC/min to crystallization isothermal temperatures (265 ºC, 268 ºC and 270 ºC) and kept in isothermal condition until the formation of crystallization exothermic peak. From isothermal data was possible to establish the crystallization kinetic parameters supported by Avrami kinetic model.
PPS morphology study by polarized light microscope
The melting and the crystallization of PPS were investigated by the use of polarized light optical microscope Leica-DMLS, with temperature control system Linkam THMS600 Heating and Freezing Stage, with heating and cooling rate precision equal to 0.1 ºC/min. The PPS sample was heated up to 340 ºC (~55 ºC above Tm of PPS).
The Linkam THMS600 heating stage is based on resistive plate and the freezing stage is based on nitrogen flux. For the analysis were produced thin films, by heating a small amount of polymer sandwiched between two thin glass slides in the hot stage. The samples were submitted to the same heating/isothermal/cooling cycle used in DSC analysis. All the micrographs were obtained at 200x.
Results and Discussion
Crystallization Kinetics studies
In this study each sample was subjected to two DSC dynamic run. First run has the purpose to eliminate the polymer thermal history and the second run was considered to collect data for analyses. Figure 2 shows the second dynamic PPS run, indicating the sample melting temperature of 285.4 ºC and melting enthalpy of 43.1J/g. According to the literature, the PPS melting temperature is around 285 ºC and the melting enthalpy is 76.5J/g[1]. However, these values are directly related to the thermal cycle (heating and cooling) that the sample is submitted (heating and cooling rates and isothermals), becoming difficult a direct comparison between the data.
The variation on the crystallinity percentage affects directly several properties of the material. Thus, for some applications it is necessary to determine the crystallinity parameters. In this work, this evaluation was carried out by using the endothermic peak related to the crystalline melting. The area above the basis line (area under the peak) is directly related with the energy absorbed in the polymer crystalline region melting. A higher quantity of heat is absorbed during the melting when the sample chains present arranged (more crystalline regions or higher degree of crystallinity). Also, the opposite is valid, low degree of crystallinity demands a low quantity of heat. So, the crystallinity percentage can be reached by equation 1:
where: DHsample melting is the sample melting enthalpy with unknown crystallinity percentage and DHreference is the sample melting enthalpy with the known crystallinity percentage.
Thus, dividing the sample enthalpy value (43.1J/g) by the reference PPS enthalpy (76.5J/g)[1], it is obtained 56% of crystallinity for the PPS studied in the present work (according to the thermal cycle heating and cooling - test procedures).
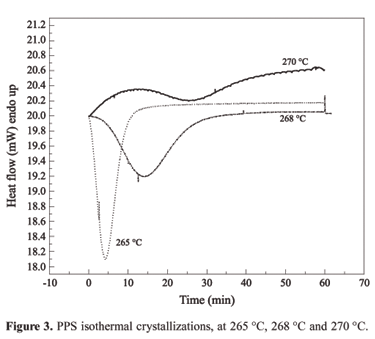
The semicrystalline PPS was characterized at 10 ºC/min heating rate between 30 ºC and 330 ºC, obtaining the thermal scan, glass transition temperature (Tg) and melting temperature (Tm). At the end of the test, the polymer was in the melted state and it was cooled down at 10 ºC/min until three different isothermal plateaus (265 ºC, 268 ºC and 270 ºC, respectively), respecting the relation Tg<Tisothermal<Tm . The polymer was kept in each isothermal for 60 minutes. The adopted procedures allow the polymeric chains to be arranged and/or aligned. In each isothermal treatment, there is great possibility of occurring chain movements allowing new arrangements. Thus, the exothermic peak, related to the Tc, was observed. Figure 3 shows the crystallization peak under isothermal scan.
According to the literature, the polymer crystallization may not occur when the isothermal temperatures used in the thermal cycle get as close as possible to the Tg or Tm[2,6,8,9]. The polymeric chains lose mobility and they can not get a proper arrangement as the temperature gets close to the Tg. Close to the Tm, the energy available in the system permits higher mobility of the chains and it promotes an unstable chain arrangement and alignment. Theorically, the crystallization becomes possible in the interval concerning temperatures above the Tg and below the Tm in an isothermal process. Although, the crystallization rates will change depending on the temperature used in the isothermal experiments[2,6,8,9].
Table 1 depicts the melting enthalpy values for each isothermal studied. It is observed that the isotherms at 265 ºC and 268 ºC promote the more complete crystallization of the sample, once the enthalpy values are close to those obtained in the dynamic PPS melting. On the other hand, the isotherm at 270 ºC is very close to the PPS melting temperature (277 ºC) presenting a low melting enthalpy value, suggesting that the sample reached a low degree of crystallinity. The higher crystallization rate was obtained during the 268 ºC isotherm test.
The kinetic crystallization studies are based on the sample behavior previously described where the sample is hold isothermally until the exothermic event. The maximum sample crystallization takes some time to happen and this time depends on each different sample. The fraction of crystallized material, x(t), in the time t, as function of the global crystallization rate, k, follow the Avrami equation (2)[2,11,12].
where: n is the Avrami exponent, which describes the crystallization mechanism and gives qualitative information about the kind of nucleation process and the crystal growth. Its value generally changes from 1 to 4[8].
The material partial crystallization is obtained by integrating the area of exothermic peak at the set time intervals, according to the equation 3:
To obtain the relative crystallization or degree of crystallinity (a) is assumed that t = 0 is the time where the thermal equilibrium is reached, t = ¥ is the end of the crystallization process, dH/dt refers to the heat flow rate and x(t)is the weight fraction of the crystallized region. The variable x(t) relates the instantaneous degree of crystallinity with the total crystallinity. The total crystallinity depends on the each experimental parameter chosen. Thus, the normalized value of x(t) changes from 0 to 1[2, 6, 8, 9].
Avrami's equation (2) can be rearranged as equation (4):
The equation (4) is a linear relation. The PPS crystallization kinetic parameters were obtained using the x(t) values from the exothermic peaks in Figure 3. Figure 4 shows the experimental data obtained from the isotherms and the mathematical correction used to obtain the kinetic parameters. The good correlation between the experimental data and the mathematical correction suggests that the Avrami model fits satisfactorily the PPS crystallization. The n value is in the range of 2.5 and 3.0, indicating a heterogeneous nucleation in spherulite disc geometry[8]. This fact suggests that the nucleus do not appear at the same time and there are no homogeneous nucleus distributions as function of time.
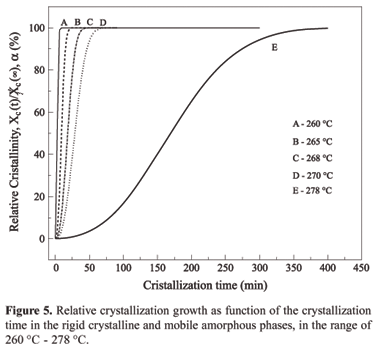
Figure 5 depicts the relative crystallization growing as function of the isotherm for the rigid crystalline and the mobile amorphous phase temperatures in the range of 260 ºC and 278 ºC. The "S" shape of the scan suggests that the crystallization begins at zero, grows slowly in the beginning of the crystallization, becomes faster and finally slows down at the end. Sometimes the crystallization process at the end is constant (260 ºC, 265 ºC, 268 ºC and 270 ºC) or it grows up slowly as function of time (278 ºC). In this latter case, this growing characterizes what is called secondary crystallization where usually small and not perfect crystals grow around the crystallization lamellas or inside the amorphous phase[2,6,8,9]. In the specific case of PPS this growth occurs around the lamellas due to the fact that the curve was obtained very close to the polymer melting temperature.
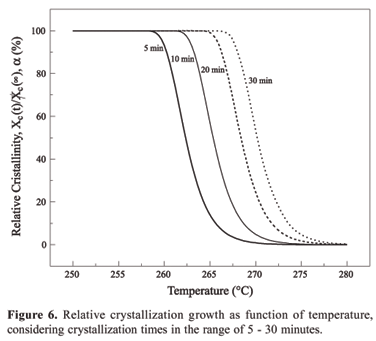
Figure 6 shows the relative crystallization growing as function of the temperature at defined crystallization times. Again, it is observed that to reach a high degree of crystallization it is necessary longer times when the sample is submitted to the temperatures around the melting point. On the other hand, the crystallization process happens faster when the sample is submitted to temperatures far from Tg and Tm. Figures 5 and 6 are very useful in the establishment of process parameters as they define the optimum and appropriate time and temperature to reach the best material degree of crystallization.
PPS morphology study by polarized light microscope
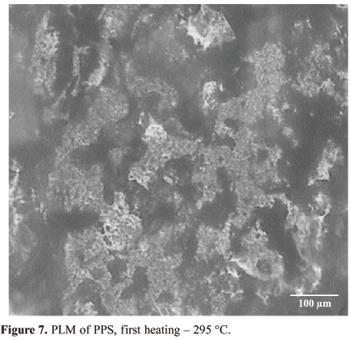
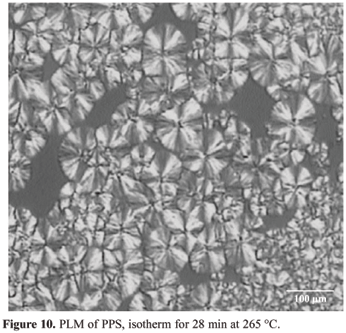
Figures 7 to 10 (magnification of 200x) shows the micrographs of PPS submitted to the same thermal treatments used in the DSC study. The sample was isothermally crystallized from its melting point up to the desired crystallization temperatures.
Figure 7 shows that when the sample is heated up to 295 ºC, 10 ºC above the melting temperature of polymer (285 ºC is the melting temperature identified in DSC scan) it is still on melting process, i.e. the polymeric chains are acquiring mobility and there are crystals not melted. For this reason, it was not possible to spread out the polymer properly between the glass slides by application of manual pressure, in order to form a film with homogeneous thickness for observation in the PLM.
From these results it is possible to conclude that in the case of composites processed at this temperature (295 ºC), the polymer do not have appropriate viscosity to promote a good wettability of the reinforcement and the remnant crystals can act as seeds during the cooling, promoting a heterogeneous crystallization of the polymer. Besides this, polymer partially melted, i.e., presenting crystals well ordered, during the application of pressure, can provoke damages as fiber breakages and voids in the manufactured composite, decreasing its mechanical properties. This condition suggests that this process requires higher temperatures or larger isotherms to guarantee the total destruction of crystals.
At 330 ºC, the PPS still presents crystals not melted (Figure 8), due to the fact that the used PPS (as-received) has crystalline regions with higher ordered degree of crystallinity. These regions require higher temperatures to melt. If the melting temperature is not sufficiently high to melt remnant crystals, these will act as nuclei for crystallization on subsequent cooling. The term self-nucleation has been used to describe the nucleation from a melted polymer or from a solution by its own crystals grown previously[3].
The self-nucleation generally occurs in semicrystalline polymers near to the thermodynamic melting point, 340 ºC for PPS. The melt temperature for PPS is 285 ºC but requires processing temperature equal to 340ºC. Only at this temperature all residual crystals or high ordered regions disappear[11]. Many polymers like polystyrene, polyamide 6, polyethylene, among others, present self-nucleation temperature very close to their thermodynamic melting point, as presented by Lee and Porter[11].
For instance, PEEK present maximum self-nucleation temperature approximately equal to 390 ºC, very close to their thermodynamic melting point, 395 ºC[11,13]. The proximity of these two temperatures suggests that minute crystalline seeds can remain until the thermodynamic melting point.
As a consequence, the crystallization of polymers with the presence of remnant seeds decreases the crystallization free energy barrier, increasing the crystallization rate. To avoid this condition the melting temperature need to be sufficiently high to promote the destruction of all seeds, probably more ordered which act as nuclei for crystallization on subsequent cooling[10].
PPS presents spherulitic crystallization pattern (Figure 9), according to n values obtained from Avrami kinetic model, with n data similarly what is found for many other polymers[8]. This aspect is characterized by dominant lamellae structures which growth according to the thermal cycle. It can not be observed between 260 ºC and 270 ºC significant changes on spherulitic aspect, according to n values from Avrami model found in DSC analysis.
It can be observed in Figure 10 two different crystal populations in the sample (primary and secondary). The primary is constituted of well formed spherulites that contribute in DSC analysis with the higher peaks, better formed with higher melt temperatures. The secondary population is characterized by spherulites relatively very small. In the second population the PPS molecules do not get enough time to get oriented in proper condition during cooling. This population contributes to smaller peaks and lower temperatures during the melting process in the DSC analysis. Figure 9 shows also that the nuclei was created sporadically in time and space, as revealed by n value (in the range of 2.5 to 3.0), calculated from Avrami equation.
Conclusion
The PPS isothermal crystallization behavior was studied by using DSC and PLM techniques. The highest crystallization rate was obtained with isothermal treatment at 268 ºC. It was verified that isothermal crystallization from melted PPS can be described by Avrami kinetic modeling. The Avrami exponent n for PPS is in the range of 2.5 to 3.0. This result agrees with heterogeneous nucleation and spherulitical growing and also with the observations made by PLM.
The melting temperature determined by conventional DSC indicates that PPS melting starts at 285 ºC. However, during the process of obtaining thin films between two glass slides, used in the PLM analysis, it was verified that the melting temperature determined by DSC do not offer an adequate polymer viscosity to obtain a film with homogeneous thickness. Thus, the PPS melting point temperature (determined by DSC analysis) is 285 ºC, but its manufacture requires processing temperature of 340 ºC (thermodynamic melting point). At this temperature all remnant crystals or highly ordered regions disappear. For this reason, the temperature to be used in the composite processing must be 340 ºC, because it is necessary to obtain an appropriate viscosity to promote a good wettability of the polymer in the reinforcement. Otherwise, the polymer impregnation in the reinforcement is deficient, generating voids and poor matrix regions, decreasing the stress transfer from matrix to fibers, and acting as stress concentrators as well.
It was also observed by PLM technique the presence of polymer crystals at temperatures close to 330 ºC. The determination of this temperature is important to avoid the self-nucleation temperature, i.e., the presence of remnant crystals in the melting process can interfere on crystal nucleation during the cooling, not allowing a precise control on the final composite microstructure, which can generates a material with low mechanical properties.
Acknowledgments
The authors would like to thank FAPESP (Proc. N. 00/15107-5; 02/01808-7 and 03/08255-6) and CNPq (Proc. N. 303528/2003-6) for the financial support of this work.
Enviado: 15/07/05
Reenviado: 13/12/05
Aprovado: 20/12/05
- 1. Hay, J. N. & Luck, D. A. Polymer, 42, p.8297-8301, (2001).
- 2. Mei, Z. & Chung, D. D. L. Polymers & Polymer Composites, 8, p.319-24, (2000).
- 3. Lee, T. H.; Boey, F. Y. C. & Khor, K. A. Composites Science and Technology, 53, p.259-274, (1995).
- 4. Gardner, S. H. "An investigation of the structure-property relationships for high performance thermoplastic matrix, carbon fiber composites with a tailored polyimide interphase", PhD in Chemical Engineering, Faculty of the Virginia Polytechnic Institute and State University, Virgínia, EUA, (1998).
- 5. Beck, H. N. Journal of Applied Polymer Science, 45, p.1361-6, (1992).
- 6. Risch, B. G; Srinivas, S.; Wilkes, G. L.; Geibel, J. F.; Ash, C.; White, S. & Hicks, M. Polymer, 37, p.3623-36, (1996).
- 7. Waddon, A. J.; Hill, M. J.; Keller, A. & Blundell, D. J. Journal of Materials Science, 22, p.1773-84, (1987).
- 8. Lucas, E. F.; Soares, B. G. & Monteiro, E. "Caracterização de Polímeros: Determinação de Peso Molecular e Análise Térmica", E-papers, Rio de Janeiro, (2001).
- 9. Canevarolo, S. V. Jr. - "Ciência dos Polímeros", Autiliber Editora, São Paulo (2002).
- 10. Moura, A.; Nohara, L. B.; Nohara, E. L. & Rezende, M. C. - "Efeito da história térmica na cristalização do PPS", in: Anais do I Workshop Universidade Empresa em Automação, Energia e Materiais. Universidade de Taubaté, CD-ROOM Taubaté - SP (2004).
- 11. Lee, Y. & Porter, R. S. - Macromolecules, 21, p.2770-6, (1988).
- 12. Jenkins, M. - J. Polymer, 42, p.1981-6, (2001).
- 13. Cebe, P. & Hong, S.-D. - Polymer, 27, p.1183-92, (1986).
Publication Dates
-
Publication in this collection
02 Oct 2006 -
Date of issue
June 2006
History
-
Received
15 July 2005 -
Reviewed
13 Dec 2005 -
Accepted
20 Dec 2005


