ABSTRACT:
The aim of the present study was to describe the dynamics of glucose and insulin curves in pregnant mares, and to evaluate the curves according to body condition score, identifying the presence of insulin resistance and correlating these values with the weight, height and clinical changes of the neonates. For this, pregnant mares were evaluated and then grouped according to body condition score during the gestation length until lactation. GrM corresponds to mares with moderate body score (BCS 5-6); GrOv were mares with overweight body score (BCS 7) and GrOb were obese mares (BCS 8-9). A two-step oral sugar test (OST) was used to determine the data. Cortisol analysis was performed with 300-320 days of gestation, at foaling and after parturition. For evaluation of the neonate, a general clinical examination and, weight and height measurements were performed. The results showed hyperglycemia in response to OST with normal insulin values at foaling with a subsequent fall in both values at lactation disregarding group division. Baseline glucose was decreased in GrM compared to GrOv and GrOb with 70-100 days of gestation and with 130-160 days of gestation. With 270-300 days of gestation and post-partum GrOb had increased baseline glucose than GrM. After OST, glucose at foaling day in GrOb presented increased values than GrM. Baseline insulin values did not differ between groups. Post OST insulin levels were higher in GrOb than GrM and GrOv at parturition. No difference in cortisol between moments was identified. GrOb and GrOv maintained increased concentrations after foaling while GrM had a decrease. No correlation was found between maternal glucose and insulin values with foal weight and height, however, a lower ratio between neonatal weight and mare’s weight in GrOb and GrOv was identified in relation to the GrM. At foaling, mares presented glucose dysregulation, with obese and overweight mares presenting a greater response to OST.
INDEX TERMS:
Glucose; insulin; pregnancy; mares; clinics; biometry; newborn; obesity; overweight; hyperglycemia; foals; horses
RESUMO:
O objetivo do presente estudo foi descrever a dinâmica das curvas de glicose e insulina em éguas gestantes e avaliar as curvas de acordo com o escore de condição corporal, identificando a presença de resistência insulínica e correlacionando esses valores com o peso, altura e alterações clínicas dos neonatos. Para isso, as éguas prenhes foram avaliadas em conjunto e agrupadas de acordo com o escore de condição corporal durante a gestação até o pós-parto. GrM pertenciam éguas com escore corporal moderado (EC 5-6); GrOv, grupo de éguas com escore corporal acima do peso (EC 7) e GrOb, grupo de éguas obesas (EC 8-9). O teste de glicose oral em duas etapas (OST) foi usado para determinar os dados. A análise do cortisol também foi realizada nos 300-320 dias de gestação, no dia do parto e após o parto. Para avaliação do neonato, foram realizados exame clínico geral e medidas de peso e altura. Os resultados mostraram hiperglicemia em resposta ao OST com valores normais de insulina no momento parto, com uma queda subsequente em ambas as variáveis na lactação, desconsiderando a divisão do grupo. A glicemia basal diminuiu no GrM em comparação com GrOv e GrOb com 70-100 dias de gestação e com 130-160 dias de gestação. Com 270-300 dias de gestação e no pós-parto, o GrOb apresentou aumento na glicemia basal em relação ao GrM. Após OST, a glicose no dia do parto no GrOb apresentou valores aumentados em relação ao GrM. Os valores basais de insulina não diferiram entre os grupos. Após OST níveis de insulina foram maiores no GrOb do que GrM e GrOv no momento do parto. Não houve diferença nos valores de cortisol entre os momentos. O GrOb e GrOv mantiveram cortisol aumentado após o parto enquanto o GrM diminuiu. Não foi encontrada correlação entre os valores de glicemia e insulina materna com o peso e a altura do potro, entretanto, foi identificada uma relação menor entre o peso neonatal e o peso da égua no GrOb e GrOv em relação ao GrM. No parto, as éguas apresentaram desregulação da glicose, sendo que as éguas obesas e com sobrepeso apresentaram uma resposta maior ao OST.
TERMOS DE INDEXAÇÃO:
Glicose; insulina; éguas; clínica; biometria; neonatos; gestação; obesidade; sobrepeso; hiperglicemia; equinos
Introduction
A progressive decrease in insulin sensitivity is known to occur physiologically in pregnancy. During this period, the mare’s metabolism undergoes several changes that help its body to adapt to the placental and fetal growth requirements. The final trimester of gestation is considered the period in which greater mobilization of substrates to the foal occurs, and this period also correlates with increased fetal growth. The mainly source of this substrate is the glucose present in the mare’s blood circulation (Ralston 2002Ralston S.L. 2002. Insulin and glucose regulation. Vet. Clin. N. Am., Equine Pract. 18(2):295-304., Galantino-Homer & Engiles 2013Galantino-Homer H.L. & Engiles J.B. 2013. Insulin resistance and laminitis in broodmares. J. Equine Vet. Sci. 33(10):844-846. <http://dx.doi.org/10.1016/j.jevs.2013.08.011>
https://doi.org/10.1016/j.jevs.2013.08.0...
).
Similarly in woman, Catalano (2010)Catalano P.M. 2010. Obesity, insulin resistance, and pregnancy outcome. Reproduction 140(3):365-371. <http://dx.doi.org/10.1530/REP-10-0088> <PMid:20457594>
https://doi.org/10.1530/REP-10-0088...
describes a decrease of at least 50% in insulin sensitivity during gestation. The metabolic syndrome of pregnancy increases the risk of hypertension, nutritional metabolic disorders and inflammation. Although these conditions are solved after childbirth, the woman still faces the risk of developing metabolic syndrome later in life, occurring mainly in individuals who gained considerable weight during pregnancy. Obesity during gestation is also correlated to metabolic alterations, leading to impairment to neonatal health (Catalano et al. 2009Catalano P.M., Presley L., Minium J. & Hauguel-de Mouzon S. 2009. Fetuses of obese mothers develop insulin resistance in utero. Diabetes Care 32(6):1076-1080. <http://dx.doi.org/10.2337/dc08-2077> <PMid:19460915>
https://doi.org/10.2337/dc08-2077...
). A similar mechanism is thought to occur in equine species (Satterfield et al. 2010Satterfield M.C., Coverdale J.A. & Wu G. 2010. Review of fetal programming: implications to horse health. Proceedings of the Annual Convention of the AAEP, Baltimore, US, p.207-214.).
Obesity is considered a pathological condition, found with increasing frequency in horses and described in several breeds (McCue et al. 2015McCue M.E., Geor R.J. & Schultz N. 2015. Equine metabolic syndrome: a complex disease influenced by genetics and the environment. J. Equine Vet. Sci. 35(5):367-375. <http://dx.doi.org/10.1016/j.jevs.2015.03.004>
https://doi.org/10.1016/j.jevs.2015.03.0...
). This disturbance is related to the development of insulin resistance (IR), known as a reduction in the sensitivity of target tissues to insulin, meaning that in normal concentration, insulin fails to decrease glucose levels, and consequently its concentration remains high in blood causing hyperinsulinemia (Frank & Tadros 2014Frank N. & Tadros E.M. 2014. Insulin dysregulation. Equine Vet. J. 46(1):103-112. <http://dx.doi.org/10.1111/evj.12169> <PMid:24033478>
https://doi.org/10.1111/evj.12169...
). IR is involved in the pathophysiology of several chronic endocrine diseases of great importance in equine breeding, which can lead to severe life-threatening consequences (Firshman & Valberg 2007Firshman A.M. & Valberg S.J. 2007. Factors affecting clinical assessment of insulin sensitivity in horses. Equine Vet. J. 39(6):567-575. <http://dx.doi.org/10.2746/042516407X238512> <PMid:18065318>
https://doi.org/10.2746/042516407X238512...
, Frank 2009Frank N. 2009. Equine metabolic syndrome. J. Equine Vet. Sci. 29(5):259-267. <http://dx.doi.org/10.1016/j.jevs.2009.04.183>
https://doi.org/10.1016/j.jevs.2009.04.1...
, 2011Frank N. 2011. Equine metabolic syndrome. Vet. Clin. N. Am., Equine Pract. 27(1):73-92. <http://dx.doi.org/10.1016/j.cveq.2010.12.004> <PMid:21392655>
https://doi.org/10.1016/j.cveq.2010.12.0...
). For this reason, obesity can be considered a risk factor during the gestational period.
Fetal development depends on the nutritional, hormonal and metabolic environment provided by the mare, and any change in these variables may reflect in the fetal development and be deleterious to its health in the future (Firshman & Valberg 2007Firshman A.M. & Valberg S.J. 2007. Factors affecting clinical assessment of insulin sensitivity in horses. Equine Vet. J. 39(6):567-575. <http://dx.doi.org/10.2746/042516407X238512> <PMid:18065318>
https://doi.org/10.2746/042516407X238512...
). Mares presenting endocrine changes related to obesity may exacerbate insulin resistance and hyperglycemia, becoming more susceptible to development of laminitis, which in known as the main consequence of hyperinsulinemia in horses, and may potentially lead to abortion (Oke 2013Oke S. 2013. Metabolic syndrome dangerous for pregnant mares. American Association of Equine Practitioners (AAEP) 2012. Available at <Available at https://thehorse.com/115224/metabolic-syndrome-dangerous-for-pregnant-mares-aaep-2012
> Accessed on Feb. 10, 2018.
https://thehorse.com/115224/metabolic-sy...
).
There are a few studies evaluating glucose and insulin dynamics during gestation (Ousey et al. 2008Ousey J.C., Fowden A.L., Wilsehr S. & Allen W.R. 2008. The effects of maternal health and body condition on the endocrine responses of neonatal foals. Equine Vet. J. 40(7):673-679. <http://dx.doi.org/10.2746/042516408X322175> <PMid:19165937>
https://doi.org/10.2746/042516408X322175...
, George et al. 2011George L.A., Staniar W.B., Cubitt T.A., Treiber K.H., Harris P.A. & Geor R.J. 2011. Evaluation of the effects of pregnancy on insulin sensitivity, insulin secretion, and glucose dynamics in Thoroughbred mares. Am. J. Vet. Res. 72(5):666-674. <http://dx.doi.org/10.2460/ajvr.72.5.666> <PMid:21529219>
https://doi.org/10.2460/ajvr.72.5.666...
, Smith et al. 2017Smith S., Marr C.M., Dunnett C. & Menzies-Gow N.J. 2017. The effect of mare obesity and endocrine function on foal birthweight in Thoroughbreds. Equine Vet. J. 49(4):461-466. <http://dx.doi.org/10.1111/evj.12645> <PMid:27862248>
https://doi.org/10.1111/evj.12645...
, Robles et al. 2018Robles M., Nouveau E., Gautier C., Mendoza L., Dubois C., Dahirel M., Lagofun B., Aubrière M-C., Lejeune J-P., Caudron I., Guenon I., Viguie C., Wimel L., Bouraima Lelong D., Serteyn A., Couturier-Tarrade A. & Chavete- Palmer P. 2018. Maternal obesity increases insulin resistance, low-grade inflammation and osteochondrosis lesions in foals and yearlings until 18 months of age. PLoS One 13(1):1:e0190309. <http://dx.doi.org/10.1371/journal.pone.0190309>
https://doi.org/10.1371/journal.pone.019...
). However, little is known about these dynamics and its relation to the newborn foal. We evaluate insulin resistance throughout the gestational period and, to the authors’ knowledge for the first time this evaluation was done at the foaling day. Therefore, the aim of the present study is: i) to describe the dynamics of the glucose, insulin and cortisol curves in pregnant mares and, from these data, ii) to evaluate the curve according to the body condition score during the gestation period, identifying the presence of insulin resistance and its relation to the weight, height and clinical changes of neonates.
Materials and Methods
Twenty-six pregnant multiparous pony mares were used, with a mean age of 11 (5-17) years old. The experiment was conducted during the breeding season of 2016. The mares were evaluated by the same trained observer at the beginning of data collection, when they were already confirmed to be pregnant, according to BCS following the system described by Henneke et al. (1983)Henneke D.R., Potter G.D., Kreider J.L. & Yeates B.F. 1983. Relationship between condition score, physical measurements and body fat percentage in mares. Equine Vet. J. 15(4):371-372. <http://dx.doi.org/10.1111/j.2042-3306.1983.tb01826.x> <PMid:6641685>
https://doi.org/10.1111/j.2042-3306.1983...
, and then separated and maintained into three distinct groups throughout the entire research period. The animals that had a body condition score (BCS) from 5 to 6 out of 9 were included in the moderate group (GrM, n=5), presenting a mean weight of 355.4 ±19.87kg. Mares identified with a BCS of 7 out of 9 were included in the overweight group (GrOv, n=9), presenting a mean weight of 452±24.65kg, and mares presenting a BCS of greater than 7 out of 9 were considered obese and were included in the obese group (GrOb, n=12) with a mean weight of 523.9±11.47kg. All data collected in this study were approved by the Ethical Committee on Animal of the Federal University of Pelotas, registered under the number CEEA 4579.
In order to evaluate glucose and insulin, a two-step oral sugar test (OST) was performed. The animals remained fasted for 12 hours and, blood was collected the following morning through venipuncture of the external jugular vein in two vacuum tubes (Vacutainer®, U.S.A.) containing sodium fluoride and sodium heparin for glucose and insulin analysis, respectively. At the same time, another blood sample for evaluation of cortisol was collected using a vacuum tube with no anticoagulant. Immediately after the baseline sample collection, corn syrup was administered orally at a dose of 0.15mL/kg, and 60 minutes later the same sample collection was repeated for glucose and insulin analysis.
The oral glucose tolerance test proposed in this study was based on the principle that normally, insulin concentrations should return to basal values after sixty minutes of corn syrup administration. Insulin resistant horses were therefore considered as animals with insulin above 60μUI/mL during that time (Frank 2011Frank N. 2011. Equine metabolic syndrome. Vet. Clin. N. Am., Equine Pract. 27(1):73-92. <http://dx.doi.org/10.1016/j.cveq.2010.12.004> <PMid:21392655>
https://doi.org/10.1016/j.cveq.2010.12.0...
). Basal values of these variables above the reference range for equine species were also considered as an indicative of insulin resistance (Frank 2011Frank N. 2011. Equine metabolic syndrome. Vet. Clin. N. Am., Equine Pract. 27(1):73-92. <http://dx.doi.org/10.1016/j.cveq.2010.12.004> <PMid:21392655>
https://doi.org/10.1016/j.cveq.2010.12.0...
, Johnson et al. 2010Johnson P.J., Wiedmeyer C.E., LaCarrubba A., Ganjam V.K. & Messer 4th N.T. 2010. Laminitis and the equine metabolic syndrome. Vet. Clin. N. Am., Equine Pract. 26(2):239-255. <http://dx.doi.org/10.1016/j.cveq.2010.04.004> <PMid:20699172>
https://doi.org/10.1016/j.cveq.2010.04.0...
).
Animals were submitted to the two steps OST test at predetermined gestation time points as follows: 70-110 days, 130-160 days, 190-210 days, 270-300 days, 300-320 days, foaling day, 7-10 days postpartum. For cortisol analysis, only 300-320 days, foaling and 7-10 days postpartum were considered. The samples were centrifuged at 800g for 10 minutes; the supernatant was separated and frozen at -20°C until analysis.
Within twelve hours postpartum, the foals were submitted to a general clinical examination, including evaluation of basic parameters such as: heart and respiratory rates, gastrointestinal motility, temperature, mucosal and capillary refill time (CRT). Physical characteristics and presence of alterations were recorded. At that time, weight and height measurements were also performed using a standard weight strip (Corpore foals - Organnact Nutracêuticos®) and a species specific hipometer respectively.
Glucose concentrations were performed using an enzymatic assay (hexokinase method, with commercial kits COBAS Glucose HK c11(catalog number: 04657527; Standard range: 1.98-720mg/dL; Roche Diagnostica Brasil Ltda., São Paulo/SP, Brazil) on a COBAS C11 automatic analyzer, Roche®). Insulin dosages were performed by a chemiluminescent immunoassay using an automatic analyzer (Access immunoassay systems, with commercially available kits - Acess® Ultrasensitive Insulin - catalog number 33410; Standard range: 0.03-300uIU/mL; Intra-assay variation: 2.0-4.2%; Inter-assay variation: 3.1-5.6%, Beckmann Coulter®, Fullerton, CA). For cortisol concentrations, samples were analyzed by B.E.T. laboratories©, Rio de Janeiro/RJ, Brazil, using the radioimmunoassay technique (Cortisol [125I] RIA kit, Standard range: 0-580ng/ml; Intra-assay variation: 5,3-8,9%; Inter-assay variation: 7,5-9,3%, MP Biomedicals LLC, Solon, OH).
The commercial software IBM® SPSS statistics 23 was used for statistical analysis. Descriptive analysis of gestation time, mares’ glucose, insulin and cortisol levels, mares’ and foals’ weight and height are presented as mean ± SE. Firstly, mares’ glucose, insulin and cortisol are described with no group separation. Afterwards, they were separated in each corresponding group according to BCS. Data normality was tested using Shapiro Wilk normality test. Non- normally distributed data was transformed to Log10. A one-way repeated measure ANOVA was used. Statistical comparison among groups and group between moments were made by LSD All- Pairwise comparisons, significance was considered at 5% level. A paired t- test was also performed to evaluate difference between glucose and insulin concentrations at baseline and after OST test.
The relationship between the variables weight and height of foals and mares’ weight, glucose and insulin concentrations and gestation length was performed using Pearson correlation coefficient. An ANOVA was also performed to determine differences among groups in gestation time, mare’s weight, neonatal weight and height and the relation between mare’s weight and newborn’s weight (M/N) which is described as percent (%). Difference was assessed using LSD All- Pairwise comparison test.
Results
Glucose and insulin curves of all mares during the gestation length, independent of groups, baseline and after 60 minutes of challenge with corn syrup, are shown in the graphs of Figure 1. Baseline glucose and insulin variables remained in the normal reference range in all time points. At foaling, a greater increase in both glucose and insulin values can be observed: 124.8mg/dL and 21.1mIU/mL respectively.
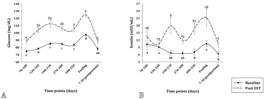
(A) Glucose curve of all mares at baseline and after OST during gestation length. (B) Insulin curve of all mares at baseline and after OST during gestation length.
Both baseline and 60 minutes’ glucose and insulin concentrations during parturition were different from the remaining moments and a significant decrease in the glucose and insulin values post foaling occurred in all variables. Paired t- test showed a significant increase from basal glucose and insulin values compared to post OST test in al time points in both variables, except in insulin levels from the 130-160 days. No difference was found in cortisol concentration between moments disregarding group separation. Cortisol values in the 5th, 6th and 7th moments were 34.35ng/ml, 41.86ng/ml and 44.78ng/ml respectively.
When the mares were separated into the three distinct groups based on BCS, differences between moments were still observed. Basal glucose curves of the groups are presented in Figure 2 A. Considering the variations between groups in each time point, fasting glucose was lower in GrM compared to GrOv and GrOb at 70-100 days and 130-160 days. At 270-300 days and 7-10 days after foaling moments, GrOb had higher basal glucose levels when compared with GrM, but no difference was found from GrOv.

Baseline and post OST glucose and insulin curves of mares separated in the three groups according to body condition score. (A) Baseline glucose levels during gestation length in moderate group (GrM), overweight group (GrOv) and obese group (GrOb). (B) Glucose concentration after 60 minutes of OST in moderate group (GrM), overweight group (GrOv) and obese group (GrOb). (C) Baseline insulin concentration during gestation in moderate group (GrM), overweight group (GrOv) and obese group (GrOb). (D) Insulin concentration 60 minutes after OST during gestation in moderate group (GrM), overweight group (GrOv) and obese group (GrOb).
After corn syrup administration, an increased glucose response is seen at the day of foaling with a subsequent fall after parturition (Fig.2B). Regarding group comparison, at 70-120 days of gestation, GrM presented an increased response when compared with GrOb. The response during time points 130-160 days, 190-210 days, 270-300 days, and 300- 320 days remained constant in all three groups, and, at foaling, a raise in glucose levels in GrOb compared to GrM was observed, with no difference from GrOv.
Resting insulin concentrations remained within normal reference range in all time points (Fig.2C). No difference was found between groups in any time points. After glucose administration, insulin levels were increased in GrOb when compared to GrM and GrOv at foaling (Fig.2D). No differences were observed in the remaining time points. Regarding cortisol analysis, no difference between time points were identified, however, GrOb and GrOv maintained increased concentrations after foaling while GrM had a decrease (Fig.3). No difference between groups in cortisol was found in the remaining time points.

Cortisol concentration at 300-320 days of gestation, at the foaling day and postpartum in moderate group (GrM), overweight group (GrOv) and obese group (GrOb).
All the foals presented normal clinical findings in all groups. Regarding the physical features, only foals from GrOv and GrOb presented mild alterations. Changes like angular deviations (1/21), flexural deformities including hypertension and hyperflexion of flexor tendons in hind and front limbs (7/21) and bulging of the frontal bone in the head (6/21) were observed.
Newborns’ weight, height and mares’ gestation length were not different between groups. However, mares of GrOb had higher weight, followed by GrOv and then GrM. In addition, mares from GrOb presented a smaller relation between maternal and neonatal weight (Table 1). At Pearson’s correlation test, no correlation between newborn weight and height with mare’s glucose and insulin concentration was found. However, mares’ weight correlated with newborn weight (r=0.640, p=0.02) and height (r=0.610, p=0.02), gestation length correlated negatively with newborns’ weight (r= -0.435, p= 0.03) and the relation among mares’ and foal’ weight correlated negatively with mares’ baseline insulin concentration at foaling (r= -0.42, p=0.04).
Discussion
None of the mares showed basal hyperglycemia across all time points, once these values were within the reference range (Frank 2011Frank N. 2011. Equine metabolic syndrome. Vet. Clin. N. Am., Equine Pract. 27(1):73-92. <http://dx.doi.org/10.1016/j.cveq.2010.12.004> <PMid:21392655>
https://doi.org/10.1016/j.cveq.2010.12.0...
, Frank & Tadros 2014Frank N. & Tadros E.M. 2014. Insulin dysregulation. Equine Vet. J. 46(1):103-112. <http://dx.doi.org/10.1111/evj.12169> <PMid:24033478>
https://doi.org/10.1111/evj.12169...
). However, the majority of the mares showed hyperglycemia (>115mg/dL) after OST challenge at the moment of foaling with three of them also presenting increased insulin concentration (60μUI/mL) at that time, suggestive of insulin resistance (Johnson et al. 2010Johnson P.J., Wiedmeyer C.E., LaCarrubba A., Ganjam V.K. & Messer 4th N.T. 2010. Laminitis and the equine metabolic syndrome. Vet. Clin. N. Am., Equine Pract. 26(2):239-255. <http://dx.doi.org/10.1016/j.cveq.2010.04.004> <PMid:20699172>
https://doi.org/10.1016/j.cveq.2010.04.0...
). Increased glucose response can occur due to a primary inadequacy of β-cell secretion of insulin, impaired disposal of glucose, or fat adaptation that spares glucose utilization without decreasing insulin sensitivity (Kronfeld et al. 2005Kronfeld D.S., Treiber K.H. & Geor R.J. 2005. Comparison of nonspecific indications and quantitative methods for the assessment of insulin resistance in horses and ponies. J. Am. Vet. Med. Assoc. 226(5):712-719. <http://dx.doi.org/10.2460/javma.2005.226.712> <PMid:15776943>
https://doi.org/10.2460/javma.2005.226.7...
).
When lower peaks of insulin with higher glucose concentrations are identified it is referred as uncompensated IR, which indicates pancreatic insufficiency or beta cell exhaustion, resembling what occurs in diabetes mellitus (Frank 2009Frank N. 2009. Equine metabolic syndrome. J. Equine Vet. Sci. 29(5):259-267. <http://dx.doi.org/10.1016/j.jevs.2009.04.183>
https://doi.org/10.1016/j.jevs.2009.04.1...
, Frank & Tadros 2014Frank N. & Tadros E.M. 2014. Insulin dysregulation. Equine Vet. J. 46(1):103-112. <http://dx.doi.org/10.1111/evj.12169> <PMid:24033478>
https://doi.org/10.1111/evj.12169...
). This can be identified in horses with pituitary pars intermedia dysfunction (PPID), although, none of the mares of this study presented clinical signs compatible with the disease (Frank 2009Frank N. 2009. Equine metabolic syndrome. J. Equine Vet. Sci. 29(5):259-267. <http://dx.doi.org/10.1016/j.jevs.2009.04.183>
https://doi.org/10.1016/j.jevs.2009.04.1...
, Frank & Tadros 2014Frank N. & Tadros E.M. 2014. Insulin dysregulation. Equine Vet. J. 46(1):103-112. <http://dx.doi.org/10.1111/evj.12169> <PMid:24033478>
https://doi.org/10.1111/evj.12169...
). Decompensation was also identified in a similar diabetic- like condition occurring during pregnancy (Trieber 2006Trieber K.H. 2006. Glucose disposal and insulin sensitivity at rest and during exercise in trained horses adapted to different dietary energy sources and in association with laminitis in ponies. Doctoral Dissertation, Virginia Polytechnic Institute and State University, Blacksburg. 269p.), which is more likely to have occurred in these mares at the time of foaling. When glucose and insulin are both elevated it’s considered a transient state between compensated to uncompensated IR (Trieber 2006Trieber K.H. 2006. Glucose disposal and insulin sensitivity at rest and during exercise in trained horses adapted to different dietary energy sources and in association with laminitis in ponies. Doctoral Dissertation, Virginia Polytechnic Institute and State University, Blacksburg. 269p.).
It should be considered that insulin and glucose peaks have been identified in other studies after sixty minutes the OST test, which could have interfered in insulin resistance analysis in the current study, as evaluation was done in just one time point after OST due to the study being conducted on a private farm, where stress was managed during the procedures to avoid pregnancy loss (Hoffman et al. 2003Hoffman R.M., Kronfeld D.S., Cooper W.L. & Harris P.A. 2003. Glucose clearance in grazing mares is affected by diet, pregnancy, and lactation. J. Anim. Sci. 81(7):1764-1771. <http://dx.doi.org/10.2527/2003.8171764x> <PMid:12854813>
https://doi.org/10.2527/2003.8171764x...
, Bamford et al. 2014Bamford N.J., Potter S.J., Harris P.A. & Bailey S.R. 2014. Breed differences in insulin sensitivity and insulinemic responses to oral glucose in horses and ponies of moderate body condition score. Domest. Anim. Endocrinol. 47:101-107. <http://dx.doi.org/10.1016/j.domaniend.2013.11.001> <PMid:24308928>
https://doi.org/10.1016/j.domaniend.2013...
). Besides that, to the author’s knowledge, it is the first time that increased response peaks of insulin and glucose are observed at the day of foaling in equine species.
Compensated IR was not identified in the remaining moments before parturition as described by literature (Fowden et al. 1984Fowden A.L., Comline R.S. & Silver M. 1984. Insulin secretion and carbohydrate metabolism during pregnancy in the mare. Equine Vet. J. 16(4):239-246. <http://dx.doi.org/10.1111/j.2042-3306.1984.tb01919.x> <PMid:6383807>
https://doi.org/10.1111/j.2042-3306.1984...
, George et al. 2011George L.A., Staniar W.B., Cubitt T.A., Treiber K.H., Harris P.A. & Geor R.J. 2011. Evaluation of the effects of pregnancy on insulin sensitivity, insulin secretion, and glucose dynamics in Thoroughbred mares. Am. J. Vet. Res. 72(5):666-674. <http://dx.doi.org/10.2460/ajvr.72.5.666> <PMid:21529219>
https://doi.org/10.2460/ajvr.72.5.666...
), probably due to reasons previously mentioned. However, from 190-210 days insulin response after oral glucose syrup was higher from basal values, which are in the time frame considered with most glucose uptake for fetal placental growth which is in agreement with previous studies (Fowden et al. 1984Fowden A.L., Comline R.S. & Silver M. 1984. Insulin secretion and carbohydrate metabolism during pregnancy in the mare. Equine Vet. J. 16(4):239-246. <http://dx.doi.org/10.1111/j.2042-3306.1984.tb01919.x> <PMid:6383807>
https://doi.org/10.1111/j.2042-3306.1984...
, Galantino-Homer & Engiles 2013Galantino-Homer H.L. & Engiles J.B. 2013. Insulin resistance and laminitis in broodmares. J. Equine Vet. Sci. 33(10):844-846. <http://dx.doi.org/10.1016/j.jevs.2013.08.011>
https://doi.org/10.1016/j.jevs.2013.08.0...
). This increase in insulin response to glucose is mediated by insulin synthesis and secretion. During pregnancy, it occurs as an adaptive mechanism that slows clearance of glucose from maternal tissues to ensure sufficient glucose supply for fetoplacental tissues (George et al. 2011George L.A., Staniar W.B., Cubitt T.A., Treiber K.H., Harris P.A. & Geor R.J. 2011. Evaluation of the effects of pregnancy on insulin sensitivity, insulin secretion, and glucose dynamics in Thoroughbred mares. Am. J. Vet. Res. 72(5):666-674. <http://dx.doi.org/10.2460/ajvr.72.5.666> <PMid:21529219>
https://doi.org/10.2460/ajvr.72.5.666...
). The maternal alteration in glucose and insulin dynamics during pregnancy is also correlated with actions of other hormones connected to gestation (Galantino-Homer & Engiles 2013Galantino-Homer H.L. & Engiles J.B. 2013. Insulin resistance and laminitis in broodmares. J. Equine Vet. Sci. 33(10):844-846. <http://dx.doi.org/10.1016/j.jevs.2013.08.011>
https://doi.org/10.1016/j.jevs.2013.08.0...
).
At lactation, glucose and insulin concentrations and response returned to normal, which is in agreement with other study (Bryden et al. 2013Bryden W.L., Foote C.E., Cawdell-Smith A.J. & Anderson S.T. 2013. No. 13/101, Insulin dynamics during equine pregnancy: possible relationship to osteochondrosis in foals. Rural Industries Research Development Corporation, Austrália. 35p.). In this case, a lower concentration and a faster removal of glucose after an oral test with lower peak occur due to redirection of glucose to the mammary gland for milk production (Firshman & Valberg 2007Firshman A.M. & Valberg S.J. 2007. Factors affecting clinical assessment of insulin sensitivity in horses. Equine Vet. J. 39(6):567-575. <http://dx.doi.org/10.2746/042516407X238512> <PMid:18065318>
https://doi.org/10.2746/042516407X238512...
).
Cortisol concentrations of all mares did not show any differences between time points. Similar serum cortisol values in pregnant mares have been previously described (Flisinska-Bojanowka et al. 1992Flisinska-Bojanowka A., Gill J. & Grzelkow K. 1992. Diurnal changes in cortisol level, neutrophil number and lyzozyme activity in foals during the first 13 weeks of life and in their lactating mothers. J. Vet. Med. 39(9):641-647. <http://dx.doi.org/10.1111/j.1439-0442.1992.tb00229.x> <PMid:1455932>
https://doi.org/10.1111/j.1439-0442.1992...
, Satué et al. 2011Satué K., Domingo R. & Redondo J.I. 2011. Relationship between progesterone, oestrone sulphate and cortisol and the components of renin angiotensin aldosterone system in Spanish purebred broodmares during pregnancy. Theriogenology 76(8):1404-1415. <http://dx.doi.org/10.1016/j.theriogenology.2011.06.009> <PMid:21835454>
https://doi.org/10.1016/j.theriogenology...
, Marcilla et al. 2017Marcilla M., Muñoz A. & Satué K. 2017. Longitudinal changes in serum catecholamines, dopamine, serotonin, ACTH and cortisol in pregnant Spanish mares. Res. Vet. Sci. 115:29-33. <http://dx.doi.org/10.1016/j.rvsc.2017.01.020> <PMid:28131969>
https://doi.org/10.1016/j.rvsc.2017.01.0...
). In pregnancy, this hormone is involved in the regulation of fetal metabolism and growth (Marcilla et al. 2017Marcilla M., Muñoz A. & Satué K. 2017. Longitudinal changes in serum catecholamines, dopamine, serotonin, ACTH and cortisol in pregnant Spanish mares. Res. Vet. Sci. 115:29-33. <http://dx.doi.org/10.1016/j.rvsc.2017.01.020> <PMid:28131969>
https://doi.org/10.1016/j.rvsc.2017.01.0...
). Cortisol is also a counterregulatory hormone of glucose, antagonizing the effects of insulin and promoting hepatic gluconeogenesis and inhibition of cellular glucose uptake (Firshman & Valberg 2007Firshman A.M. & Valberg S.J. 2007. Factors affecting clinical assessment of insulin sensitivity in horses. Equine Vet. J. 39(6):567-575. <http://dx.doi.org/10.2746/042516407X238512> <PMid:18065318>
https://doi.org/10.2746/042516407X238512...
, Hart et al. 2016Hart K.A., Wochele D.M., Norton N.A., McFarlane D., Wooldridge A.A. & Frank N. 2016. Effect of age, season, body condition, and endocrine status on serum free cortisol fraction and insulin concentration in horses. J. Vet. Intern. Med. 30(2):653-663. <http://dx.doi.org/10.1111/jvim.13839> <PMid:26860336>
https://doi.org/10.1111/jvim.13839...
). Nagel et al. (2012)Nagel C., Erber R., Bergmaier C., Wulf M., Aurich J., Mostl E. & Aurich C. 2012. Cortisol and progestin release, heart rate and heart rate variability in the pregnant and postpartum mare, fetus and newborns foal. Theriogenology 78(4):759-767. <http://dx.doi.org/10.1016/j.theriogenology.2012.03.023> <PMid:22626780>
https://doi.org/10.1016/j.theriogenology...
describes an increase in plasmatic cortisol levels in the fourth days prior to parturition, with even higher concentration occurring at the day of foaling to at least 8 hours after. Other studies have demonstrated that the greater increase in cortisol values during pregnancy occurs between the fourth and fifth months, decreasing progressively in the following period, which is suggested to be negatively correlated with estrogens concentrations as the gestation progresses (Satué et al. 2011Satué K., Domingo R. & Redondo J.I. 2011. Relationship between progesterone, oestrone sulphate and cortisol and the components of renin angiotensin aldosterone system in Spanish purebred broodmares during pregnancy. Theriogenology 76(8):1404-1415. <http://dx.doi.org/10.1016/j.theriogenology.2011.06.009> <PMid:21835454>
https://doi.org/10.1016/j.theriogenology...
, Marcilla et al. 2017Marcilla M., Muñoz A. & Satué K. 2017. Longitudinal changes in serum catecholamines, dopamine, serotonin, ACTH and cortisol in pregnant Spanish mares. Res. Vet. Sci. 115:29-33. <http://dx.doi.org/10.1016/j.rvsc.2017.01.020> <PMid:28131969>
https://doi.org/10.1016/j.rvsc.2017.01.0...
).
Considering group evaluations, the higher glucose and insulin response in the obese and overweight mares, especially at foaling, suggests that they could exacerbate glucose and insulin dysregulation at that time point, as was observed in this study (Morresey 2012Morresey P.R. 2012. Metabolic syndrome in the pregnant mare. Proceedings of the 58th AAEP Annual Convention Proceedings for Meeting Held, Anaheim, CA, p.339-344.). Metabolic dysregulation was associated with obesity in pregnant mares and women in other studies (George et al. 2009George L.A., Staniar W.B., Treiber K.H., Harris P.A. & Geor R.J. 2009. Insulin sensitivity and glucose dynamics during pre-weaning foal development and in response to maternal diet composition. Domest. Anim. Endocrinol. 37(1):23-29. <http://dx.doi.org/10.1016/j.domaniend.2009.01.003> <PMid:19359126>
https://doi.org/10.1016/j.domaniend.2009...
, Catalano 2010Catalano P.M. 2010. Obesity, insulin resistance, and pregnancy outcome. Reproduction 140(3):365-371. <http://dx.doi.org/10.1530/REP-10-0088> <PMid:20457594>
https://doi.org/10.1530/REP-10-0088...
, Peugnet et al. 2015Peugnet P., Robles M., Mendoza L., Wimel L., Dubois C., Dahirel M., Guillaume D., Camous S., Berthelot V., Toquet M.P., Richard E., Sandersen C., Chaffaux S., Lejeune J.P., Tarrade A., Serteyn D. & Chavatte-Palmer P. 2015. Effects of moderate amounts of barley in late pregnancy on growth, glucose metabolism and osteoarticular status of pre-weaning horses. PloS One 10(4):e0122596. <http://dx.doi.org/10.1371/journal.pone.0122596>
https://doi.org/10.1371/journal.pone.012...
). Conversely, Song (2014)Song X. 2014. Insulin resistance in pregnant mares: the influence of body condition. Master’s Thesis, University of Queensland, Austrália. 85p. found insulin dysregulation in mares with low BCS due to β- pancreatic cell deficiency.
When groups were evaluated for cortisol concentrations, obese and overweight mares maintained high cortisol levels within 7-10 days after foaling while moderate BCS mares had a significant decrease at that moment. Cortisol demand is closely related to the degree of metabolic activity, which is increased in the initial lactation period due to glucose requirement for milk production and could also be related to high BCS. Together with other related hormones, cortisol remains high because it is responsible for maintaining milk production (Satué et al. 2011Satué K., Domingo R. & Redondo J.I. 2011. Relationship between progesterone, oestrone sulphate and cortisol and the components of renin angiotensin aldosterone system in Spanish purebred broodmares during pregnancy. Theriogenology 76(8):1404-1415. <http://dx.doi.org/10.1016/j.theriogenology.2011.06.009> <PMid:21835454>
https://doi.org/10.1016/j.theriogenology...
).
Although no correlation was found between maternal insulin and glucose levels with the weight and height of the neonate, the present data show that in the group of obese mares, maternal weight and foal birth weight relation of 8.49% was obtained, and the overweight group had a relation of 9.25%, being significantly lower than the group with a moderate BCS (P<0.05). According to Brown-Douglas et. al. (2011)Brown-Douglas C., Huntington P. & Pagan J. 2011. Growth of horses, p.280-291. In: McKinnon A.O., Squires E.L., Vaala W.E. & Varner D.D. (Ed.), Equine Reproduction. 2nd ed. West Sussex, Wiley-Blackwell., the weight of the neonate should correspond to 10% of the dam’s body weight, which is considered a reflection of the placental efficiency. Smith et al. (2017)Smith S., Marr C.M., Dunnett C. & Menzies-Gow N.J. 2017. The effect of mare obesity and endocrine function on foal birthweight in Thoroughbreds. Equine Vet. J. 49(4):461-466. <http://dx.doi.org/10.1111/evj.12645> <PMid:27862248>
https://doi.org/10.1111/evj.12645...
have identified an inverse relationship between body score and foal weight at birth than what we found in the present study, observing that mares with higher body scores gave birth to heavier foals. It was also observed that the majority of physical alterations presented by foals of GrOv and GrOb at birth were consistent with immaturity (Stoneham 2006Stoneham S.J. 2006. Assessing the newborn foal, p.1-11. In: Paradis M.R. (Ed.), Equine Neonatal Medicine: a case-based approach. Saunders Elsevier, Philadelphia.).
The relation of maternal weight and foals’ birthweight correlated negatively with mare’s fasting insulin at parturition, showing that mares with higher insulin concentrations at foaling had lower weight percentage relation between mare and foal. However, this data should be further investigated.
Conclusions
At foaling, mares presented glucose and insulin dysregulation. During earlier gestational period, it also showed diminished glucose removal rate, which is related to fetal-placental growth demand. Obese and overweight mares had greater response to OST at the foaling day and higher cortisol values in post-partum.
Insulin resistance was not identified in the majority of the mares. It was not observed difference in weight and height of the newborns in the different groups, however, obese and overweight mares presented a lower relation between maternal weight and foal birthweight. No correlation of newborn weight and height with mare’s glucose and insulin values were found.
Acknowledgments
Our thanks to Ruth Patten for the English spelling check.
References
- Bamford N.J., Potter S.J., Harris P.A. & Bailey S.R. 2014. Breed differences in insulin sensitivity and insulinemic responses to oral glucose in horses and ponies of moderate body condition score. Domest. Anim. Endocrinol. 47:101-107. <http://dx.doi.org/10.1016/j.domaniend.2013.11.001> <PMid:24308928>
» https://doi.org/10.1016/j.domaniend.2013.11.001 - Bryden W.L., Foote C.E., Cawdell-Smith A.J. & Anderson S.T. 2013. No. 13/101, Insulin dynamics during equine pregnancy: possible relationship to osteochondrosis in foals. Rural Industries Research Development Corporation, Austrália. 35p.
- Brown-Douglas C., Huntington P. & Pagan J. 2011. Growth of horses, p.280-291. In: McKinnon A.O., Squires E.L., Vaala W.E. & Varner D.D. (Ed.), Equine Reproduction. 2nd ed. West Sussex, Wiley-Blackwell.
- Catalano P.M. 2010. Obesity, insulin resistance, and pregnancy outcome. Reproduction 140(3):365-371. <http://dx.doi.org/10.1530/REP-10-0088> <PMid:20457594>
» https://doi.org/10.1530/REP-10-0088 - Catalano P.M., Presley L., Minium J. & Hauguel-de Mouzon S. 2009. Fetuses of obese mothers develop insulin resistance in utero. Diabetes Care 32(6):1076-1080. <http://dx.doi.org/10.2337/dc08-2077> <PMid:19460915>
» https://doi.org/10.2337/dc08-2077 - Firshman A.M. & Valberg S.J. 2007. Factors affecting clinical assessment of insulin sensitivity in horses. Equine Vet. J. 39(6):567-575. <http://dx.doi.org/10.2746/042516407X238512> <PMid:18065318>
» https://doi.org/10.2746/042516407X238512 - Flisinska-Bojanowka A., Gill J. & Grzelkow K. 1992. Diurnal changes in cortisol level, neutrophil number and lyzozyme activity in foals during the first 13 weeks of life and in their lactating mothers. J. Vet. Med. 39(9):641-647. <http://dx.doi.org/10.1111/j.1439-0442.1992.tb00229.x> <PMid:1455932>
» https://doi.org/10.1111/j.1439-0442.1992.tb00229.x - Frank N. 2009. Equine metabolic syndrome. J. Equine Vet. Sci. 29(5):259-267. <http://dx.doi.org/10.1016/j.jevs.2009.04.183>
» https://doi.org/10.1016/j.jevs.2009.04.183 - Frank N. 2011. Equine metabolic syndrome. Vet. Clin. N. Am., Equine Pract. 27(1):73-92. <http://dx.doi.org/10.1016/j.cveq.2010.12.004> <PMid:21392655>
» https://doi.org/10.1016/j.cveq.2010.12.004 - Frank N. & Tadros E.M. 2014. Insulin dysregulation. Equine Vet. J. 46(1):103-112. <http://dx.doi.org/10.1111/evj.12169> <PMid:24033478>
» https://doi.org/10.1111/evj.12169 - Fowden A.L., Comline R.S. & Silver M. 1984. Insulin secretion and carbohydrate metabolism during pregnancy in the mare. Equine Vet. J. 16(4):239-246. <http://dx.doi.org/10.1111/j.2042-3306.1984.tb01919.x> <PMid:6383807>
» https://doi.org/10.1111/j.2042-3306.1984.tb01919.x - Galantino-Homer H.L. & Engiles J.B. 2013. Insulin resistance and laminitis in broodmares. J. Equine Vet. Sci. 33(10):844-846. <http://dx.doi.org/10.1016/j.jevs.2013.08.011>
» https://doi.org/10.1016/j.jevs.2013.08.011 - George L.A., Staniar W.B., Treiber K.H., Harris P.A. & Geor R.J. 2009. Insulin sensitivity and glucose dynamics during pre-weaning foal development and in response to maternal diet composition. Domest. Anim. Endocrinol. 37(1):23-29. <http://dx.doi.org/10.1016/j.domaniend.2009.01.003> <PMid:19359126>
» https://doi.org/10.1016/j.domaniend.2009.01.003 - George L.A., Staniar W.B., Cubitt T.A., Treiber K.H., Harris P.A. & Geor R.J. 2011. Evaluation of the effects of pregnancy on insulin sensitivity, insulin secretion, and glucose dynamics in Thoroughbred mares. Am. J. Vet. Res. 72(5):666-674. <http://dx.doi.org/10.2460/ajvr.72.5.666> <PMid:21529219>
» https://doi.org/10.2460/ajvr.72.5.666 - Hart K.A., Wochele D.M., Norton N.A., McFarlane D., Wooldridge A.A. & Frank N. 2016. Effect of age, season, body condition, and endocrine status on serum free cortisol fraction and insulin concentration in horses. J. Vet. Intern. Med. 30(2):653-663. <http://dx.doi.org/10.1111/jvim.13839> <PMid:26860336>
» https://doi.org/10.1111/jvim.13839 - Henneke D.R., Potter G.D., Kreider J.L. & Yeates B.F. 1983. Relationship between condition score, physical measurements and body fat percentage in mares. Equine Vet. J. 15(4):371-372. <http://dx.doi.org/10.1111/j.2042-3306.1983.tb01826.x> <PMid:6641685>
» https://doi.org/10.1111/j.2042-3306.1983.tb01826.x - Hoffman R.M., Kronfeld D.S., Cooper W.L. & Harris P.A. 2003. Glucose clearance in grazing mares is affected by diet, pregnancy, and lactation. J. Anim. Sci. 81(7):1764-1771. <http://dx.doi.org/10.2527/2003.8171764x> <PMid:12854813>
» https://doi.org/10.2527/2003.8171764x - Johnson P.J., Wiedmeyer C.E., LaCarrubba A., Ganjam V.K. & Messer 4th N.T. 2010. Laminitis and the equine metabolic syndrome. Vet. Clin. N. Am., Equine Pract. 26(2):239-255. <http://dx.doi.org/10.1016/j.cveq.2010.04.004> <PMid:20699172>
» https://doi.org/10.1016/j.cveq.2010.04.004 - Kronfeld D.S., Treiber K.H. & Geor R.J. 2005. Comparison of nonspecific indications and quantitative methods for the assessment of insulin resistance in horses and ponies. J. Am. Vet. Med. Assoc. 226(5):712-719. <http://dx.doi.org/10.2460/javma.2005.226.712> <PMid:15776943>
» https://doi.org/10.2460/javma.2005.226.712 - Marcilla M., Muñoz A. & Satué K. 2017. Longitudinal changes in serum catecholamines, dopamine, serotonin, ACTH and cortisol in pregnant Spanish mares. Res. Vet. Sci. 115:29-33. <http://dx.doi.org/10.1016/j.rvsc.2017.01.020> <PMid:28131969>
» https://doi.org/10.1016/j.rvsc.2017.01.020 - McCue M.E., Geor R.J. & Schultz N. 2015. Equine metabolic syndrome: a complex disease influenced by genetics and the environment. J. Equine Vet. Sci. 35(5):367-375. <http://dx.doi.org/10.1016/j.jevs.2015.03.004>
» https://doi.org/10.1016/j.jevs.2015.03.004 - Morresey P.R. 2012. Metabolic syndrome in the pregnant mare. Proceedings of the 58th AAEP Annual Convention Proceedings for Meeting Held, Anaheim, CA, p.339-344.
- Nagel C., Erber R., Bergmaier C., Wulf M., Aurich J., Mostl E. & Aurich C. 2012. Cortisol and progestin release, heart rate and heart rate variability in the pregnant and postpartum mare, fetus and newborns foal. Theriogenology 78(4):759-767. <http://dx.doi.org/10.1016/j.theriogenology.2012.03.023> <PMid:22626780>
» https://doi.org/10.1016/j.theriogenology.2012.03.023 - Ousey J.C., Fowden A.L., Wilsehr S. & Allen W.R. 2008. The effects of maternal health and body condition on the endocrine responses of neonatal foals. Equine Vet. J. 40(7):673-679. <http://dx.doi.org/10.2746/042516408X322175> <PMid:19165937>
» https://doi.org/10.2746/042516408X322175 - Oke S. 2013. Metabolic syndrome dangerous for pregnant mares. American Association of Equine Practitioners (AAEP) 2012. Available at <Available at https://thehorse.com/115224/metabolic-syndrome-dangerous-for-pregnant-mares-aaep-2012 > Accessed on Feb. 10, 2018.
» https://thehorse.com/115224/metabolic-syndrome-dangerous-for-pregnant-mares-aaep-2012 - Peugnet P., Robles M., Mendoza L., Wimel L., Dubois C., Dahirel M., Guillaume D., Camous S., Berthelot V., Toquet M.P., Richard E., Sandersen C., Chaffaux S., Lejeune J.P., Tarrade A., Serteyn D. & Chavatte-Palmer P. 2015. Effects of moderate amounts of barley in late pregnancy on growth, glucose metabolism and osteoarticular status of pre-weaning horses. PloS One 10(4):e0122596. <http://dx.doi.org/10.1371/journal.pone.0122596>
» https://doi.org/10.1371/journal.pone.0122596 - Ralston S.L. 2002. Insulin and glucose regulation. Vet. Clin. N. Am., Equine Pract. 18(2):295-304.
- Robles M., Nouveau E., Gautier C., Mendoza L., Dubois C., Dahirel M., Lagofun B., Aubrière M-C., Lejeune J-P., Caudron I., Guenon I., Viguie C., Wimel L., Bouraima Lelong D., Serteyn A., Couturier-Tarrade A. & Chavete- Palmer P. 2018. Maternal obesity increases insulin resistance, low-grade inflammation and osteochondrosis lesions in foals and yearlings until 18 months of age. PLoS One 13(1):1:e0190309. <http://dx.doi.org/10.1371/journal.pone.0190309>
» https://doi.org/10.1371/journal.pone.0190309 - Satterfield M.C., Coverdale J.A. & Wu G. 2010. Review of fetal programming: implications to horse health. Proceedings of the Annual Convention of the AAEP, Baltimore, US, p.207-214.
- Satué K., Domingo R. & Redondo J.I. 2011. Relationship between progesterone, oestrone sulphate and cortisol and the components of renin angiotensin aldosterone system in Spanish purebred broodmares during pregnancy. Theriogenology 76(8):1404-1415. <http://dx.doi.org/10.1016/j.theriogenology.2011.06.009> <PMid:21835454>
» https://doi.org/10.1016/j.theriogenology.2011.06.009 - Smith S., Marr C.M., Dunnett C. & Menzies-Gow N.J. 2017. The effect of mare obesity and endocrine function on foal birthweight in Thoroughbreds. Equine Vet. J. 49(4):461-466. <http://dx.doi.org/10.1111/evj.12645> <PMid:27862248>
» https://doi.org/10.1111/evj.12645 - Song X. 2014. Insulin resistance in pregnant mares: the influence of body condition. Master’s Thesis, University of Queensland, Austrália. 85p.
- Stoneham S.J. 2006. Assessing the newborn foal, p.1-11. In: Paradis M.R. (Ed.), Equine Neonatal Medicine: a case-based approach. Saunders Elsevier, Philadelphia.
- Trieber K.H. 2006. Glucose disposal and insulin sensitivity at rest and during exercise in trained horses adapted to different dietary energy sources and in association with laminitis in ponies. Doctoral Dissertation, Virginia Polytechnic Institute and State University, Blacksburg. 269p.
Publication Dates
-
Publication in this collection
04 Nov 2019 -
Date of issue
Sept 2019
History
-
Received
09 Apr 2019 -
Accepted
06 May 2019


