Abstract
What is the effect of social distancing policies on the spread of the new coronavirus? Social distancing policies rose to prominence as most capable of containing contagion and saving lives. Our purpose in this paper is to identify the causal effect of social distancing policies on the number of confirmed cases of COVID-19 and on contagion velocity. We align our main argument with the existing scientific consensus: social distancing policies negatively affect the number of cases. To test this hypothesis, we construct a dataset with daily information on 78 affected countries in the world. We compute several relevant measures from publicly available information on the number of cases and deaths to estimate causal effects for short-term and cumulative effects of social distancing policies. We use a time-series cross-sectional matching approach to match countries’ observable histories. Causal effects (ATTs and ATEs) can be extracted via a dif-in-dif estimator. Results show that social distancing policies reduce the aggregated number of cases by 4,832 on average (or 17.5/100 thousand), but only when strict measures are adopted. This effect seems to manifest from the third week onwards.
Keywords:
COVID-19; government response; social distancing policies
Resumo
Qual o efeito das políticas de distanciamento social na disseminação do novo coronavírus? As políticas de distanciamento social ganharam destaque como as mais capazes de conter contágio e salvar vidas. Nosso objetivo neste artigo é identificar o efeito causal das políticas de distanciamento social no número de casos confirmados da COVID-19 e na velocidade de contágio. Alinhamos nosso argumento principal com o consenso científico existente: políticas de distanciamento social afetam negativamente o número de casos de contaminação. Para testar esta hipótese, construímos um banco de dados com informações diárias sobre 78 países afetados no mundo. Calculamos várias medidas relevantes a partir de informações publicamente disponíveis sobre o número de casos de infectados e mortes, a fim de estimar efeitos causais para efeitos em curto prazo e cumulativos de políticas de distanciamento social. Usamos uma abordagem de time-series cross-sectional matching a fim de parear históricos observáveis dos países. Efeitos causais (ATTs e ATEs) podem ser extraídos através de um estimador dif-in-dif. Resultados mostram que as políticas de distanciamento social reduzem o número agregado de pessoas contaminadas em 4.832 em média (ou 17,5/100 mil), mas apenas quando medidas rigorosas são adotadas. Esse efeito parece se manifestar a partir da terceira semana.
Palavras-chave:
COVID-19; resposta governamental; políticas de distanciamento social
Resumen
¿Cuál es el efecto de las políticas de distanciamiento social en la diseminación del nuevo coronavirus? Las políticas de distanciamiento social salieron a la fama como las más capaces de contener el contagio y salvar vidas. Nuestro objetivo en este artículo es identificar el efecto causal de las políticas de distanciamiento social en el número de casos confirmados de COVID-19 y en la velocidad de contagio. Alineamos nuestro argumento principal con el consenso científico existente: las políticas de distanciamiento social afectan negativamente el número de casos de contaminación. Para probar esta hipótesis, construimos un banco de datos con información diaria sobre 78 países afectados. Calculamos varias medidas relevantes a partir de la información disponible públicamente sobre el número de casos de infectados y muertes para estimar los efectos causales a corto plazo y acumulativos de las políticas de distanciamiento social. Utilizamos un enfoque de time-series cross-sectional matching para emparejar los historiales observables de los países. Los efectos causales (ATT y ATE) se pueden extraer a través de un estimador dif-in-dif. Los resultados muestran que las políticas de distanciamiento social reducen el número agregado de personas contaminadas en 4.832 en media (o 17,5/100 mil), pero solo cuando se adoptan medidas estrictas. Este efecto parece manifestarse desde la tercera semana.
Palabras clave:
COVID-19; respuesta del gobierno; políticas de distanciamiento social
1. INTRODUCTION
On the 30th of January 2020, the Italian Government confirmed its first two imported cases of the novel coronavirus: two Chinese tourists1
1
Retrieved from https://veja.abril.com.br/mundo/italia-confirma-seus-dois-primeiros-casos-do-novo-coronavirus-no-pais/
. It would not take long for this first minor incident to explode into a vicious epidemic. On the 23rd of March, there were around 5476 deaths and near 59138 infected cases. The country would then daily break higher and higher grim records. Compared to other European countries, Italy became a severe case of the coronavirus pandemic. Some attributed this to the perceived slowness of Italian national and local governments’ responses, both in quickly identifying the disease and then in taking swift action to implement prescribed policies, such as closing businesses and locking down cities (Pisano, Sadun & Zanini, 2020Pisano, G. P., Sadun, R., & Zanini, M. (2020, March 27). Lessons from Italy’s Response to Coronavirus. Retrieved from https://hbr.org/2020/03/lessons-from-italys-response-to-coronavirus.
https://hbr.org/2020/03/lessons-from-ita...
), with the emphasis being given to strict social distancing policies.
In a context where vaccines and efficient medical treatment are yet to be found, social distancing policies rose to prominence as more capable of containing contagion and ultimately saving lives. Also, studies have been highlighting the role of leadership in the government response to this crisis (Grint, 2020Grint, K. (2020). Leadership, Management and Command in the time of the Coronavirus. Leadership, 16(3), 314-319.), alongside other variables such as the adjustment of society to the new context (Boin & McConnell, 2007Boin, A., & McConnell, A. (2007). Preparing for critical infrastructure breakdowns: the limits of crisis management and the need for resilience. Journal of contingencies and crisis management, 15(1), 50-59.). However, some heads of government (nationally and locally) have expressed distrust, arguing that the “medicine is worse than the disease”, especially regarding economic effects, despite solid scientific understanding behind them (Tisdall, 2020Tisdall, S. (2020, May 17). Trump, Putin and Bolsonaro have been complacent. Now the pandemic has made them all vulnerable. The Guardian. Retrieved from https://www.theguardian.com/commentisfree/2020/may/17/trump-putin-and-bolsonaro-have-been-complacent-now-the-pandemic-has-made-them-all-vulnerable.
https://www.theguardian.com/commentisfre...
). As in times of crisis, policymakers need to make fast decisions based on little information (Boin, 2019Boin, A. (2019). The Transboundary Crisis: Why we are unprepared and the road ahead. Journal of Contingencies and Crisis Management, 27(1), 94-99.), we believe part of this problem could be dealt with by directly assessing the life-saving effectiveness of social distancing policies. That is why we propose an impact evaluation of these measures on the new Coronavirus spread.
Our main purpose in this paper is to identify the causal effect of social distancing policies on the number of confirmed cases of COVID-19 and on contagion velocity. That is, what is the effect of social distancing policies on the new coronavirus dissemination? To achieve this goal, we construct a novel and detailed dataset with daily information on 78 affected countries. We compute several relevant measures on the number of infected cases and deaths in order to estimate causal effects for short-term and cumulative effects of social distancing policies. Because direct counterfactual comparison is unattainable, we propose a time-series cross-sectional matching approach (Imai, Kim & Wang, 2020Imai, K., Kim, I. S., & Wang, E. (2020, January). Matching Methods for Causal Inference with Time-Series Cross-Sectional Data. Cambridge, MA: Harvard University.). Under well-known assumptions, causal effects (ATTs and ATEs) can be extracted via a dif-in-dif estimator. Our results indicate social distancing policies reduce the aggregated number of contaminated people by 4832 on average or 17.5 people per 100 thousand inhabitants. This effect is larger than the average of contaminated cases (per 100k) of all countries (15.62) and seems to manifest from the third week onwards.
The remainder of this paper is structured as follows: (1) a brief overview of the coronavirus pandemic contagion, (2) exposition of the main argument, (3) data and methods, (4) results and discussion.
2. MAIN ARGUMENT
On a daily basis, government officials formulate public policies. In this context, governments already have limited intervention capacity for informational or mobilization costs reasons (Batista & Domingos, 2017Batista, M., & Domingos, A. (2017). Mais que boas intenções: técnicas quantitativas e qualitativas na avaliação de impacto de políticas públicas. Revista Brasileira de Ciências Sociais, 32(94), 1-24.). In times of crisis, the public policy cycle ends up spinning even faster. In the case of the COVID-19 pandemic, the decision to maintain or replace a program becomes more important: in addition to costing resources, it can cost lives.
Against the backdrop where civil society needs to know the outcome and hold representatives accountable, an impact evaluation can provide robust evidence on programs’ performance and results (Gertler et al., 2011). There is a large body of epidemiologic studies that speak in favor of social distancing measures in viral epidemics (Fong et al., 2020; Glass et al., 2006; Gordis, 2014). According to our data, about 60% of the countries (n = 78) have adopted some kind of social distancing policy. Yet, although the role of scientific evidence on policy making in healthcare can be considered less disputed than in other areas (Davies et al., 1999), recent studies regarding governmental responses to COVID-19 show how political bias and narrative threatens to overcome scientific knowledge. Evidence from the US suggests that states aligned to President Trump took longer to adopt any social distancing measure (Allcott et al., 2020Allcott, H., Boxell, L., Conway, J., Gentzkow, M., Thaler, M. … Yang, D. Y. (2020). Polarization and public health: Partisan differences in social distancing during the Coronavirus pandemic (NBER Working Paper, w26946). Cambridge, MA: National Bureau of Economic Research.). The only medicine for this is scientific evidence.
In this sense, we argue that COVID-19 can be interpreted as an exogenous shock akin to a natural hazard. Contrary to typical focus on emergency responses, the literature on natural hazards tends to stress preparedness and prevention (Kahn, 2005Kahn, M. E. (2005). The death toll from natural disasters: the role of income, geography, and institutions. Review of economics and statistics, 87(2), 271-284.; Neumayer, Plümper & Barthel, 2014Neumayer, E., Plümper, T., & Barthel, F. (2014). The political economy of natural disaster damage. Global Environmental Change, 24, 8-19.). Hazards are destructive events with a relatively high degree of uncommonness and uncertainty. This definition can easily be applied to a pandemic: the incomplete information about the virus lends it high uncertainty, and pandemics are even more sporadic than natural events (e.g. earthquakes). Lastly, no one can deny their life-threatening potential.
Due to their large-scale proportions, hazards can only be truly dealt with by substantial investment in preparation. The problem is that preparedness requires continuous long-term policies to be attained, which creates an intertemporal dilemma. Typically, it is sub-optimally resolved due to sequential sub-investment by several governments resulting in poor preparation, and disasters ensue. For democratically elected rulers, there is an extra disincentive: myopic voters tend to forget about past investments and overvalue decisive emergency responses (Cole, Healy & Werker, 2012Cole, S., Healy, A., & Werker, E. (2012). Do voters demand responsive governments? Evidence from Indian disaster relief. Journal of Development Economics, 97(2), 167-181.; Healy & Malhotra, 2009Healy, A., & Malhotra, N. (2009). Myopic voters and natural disaster policy. American Political Science Review, 103(3), 387-406.). That does not mean swift government action is powerless; it has an important role in contention and ongoing management of the crisis resulting from a hazard.
It is pivotal to understand government emergency responses with an eye on long-run causes. On the other hand, leading scholars in epidemiology and medical sciences are continuously ascertaining that certain policy solutions, especially social distancing, are the best response to the pandemic (Maier & Broockmann, 2020Maier, Benjamin F., and Dirk Brockmann. “Effective containment explains subexponential growth in recent confirmed COVID-19 cases in China”. Science, 368(6492), 742-746 2020.; Matrajt & Leung, 2020Matrajt, L., & Leung, T. (2020). Evaluating the Effectiveness of Social Distancing Interventions to Delay or Flatten the Epidemic Curve of Coronavirus Disease. Emerging Infectious Diseases, 26(8).; Pandey, Subedee, Khanal & Koirala, 2020Pandey, K. R., Subedee, A., Khanal, B., & Koirala, B. (2020). COVID-19 Control Strategies and Intervention Effects in Resource Limited Settings: A Modeling Study. medRxiv. Retrieved from https://www.medrxiv.org/content/10.1101/2020.04.26.20079673v2
https://www.medrxiv.org/content/10.1101/...
; Rafael et al., 2020Rafael, R. D. M. R., N Neto, M., Carvalho, M. M. B., David, H. M. S. L., Acioli, S. ... Araujo Faria, M. G. (2020). Epidemiologia, políticas públicas e pandemia de Covid-19: o que esperar no Brasil?. Revista Enfermagem UERJ, 28, 49570. Retrieved from https://www.e-publicacoes.uerj.br/index.php/enfermagemuerj/article/view/49570
https://www.e-publicacoes.uerj.br/index....
). These policies should be effective due to their curve-flattening properties, which ease the burden on national healthcare systems, turning exponential outbreaks into a more dragged out, gradual process. Mathematical models undergird these policy recommendations, showing that reducing interpersonal contact leads to a massive overtime decrease in infected cases and associated deaths (Ainslie et al., 2020Ainslie, K. E., Walters, C. E., Fu, H., Bhatia, S., Wang, H., Xi, X. ... Cattarino, L. (2020). Evidence of initial success for China exiting COVID-19 social distancing policy after achieving containment. Wellcome Open Research, 81(5). Retrieved from https://wellcomeopenresearch.org/articles/5-81
https://wellcomeopenresearch.org/article...
; Prem et al., 2002Prem, K., Liu, Y., Russell, T. W., Kucharski, A. J., Eggo, R. M., Davies, N., ... Abbott, S. (2020). The effect of control strategies to reduce social mixing on outcomes of the COVID-19 epidemic in Wuhan, China: a modelling study. The Lancet Public Health. Retrieved from https://www.thelancet.com/journals/lanpub/article/PIIS2468-2667(20)30073-6/fulltext
https://www.thelancet.com/journals/lanpu...
). Thus, following scientific evidence, we argue that social distancing policies negatively affect the number of contaminated cases. We also propose that only strict distancing policies (isolation) have observable effects on contagion.
Policies rarely present immediate effects. Hence, we introduce the caveat that the causal effects of interest will take place either cumulatively or after a reasonable amount of time has passed. As we have no inputs as to how much time would need to pass for us to observe causal effects, we remain agnostic about it. In the next section, we describe the nature of our data, its associated mensuration and causality problems, and how we approach them.
3. DATA AND METHODS2 2 For documentation we follow the TIER protocol 4.0. Replication materials and online appendix are publicly retrieved from https://osf.io/qndjh/?view_only=9cdd2e8b8d9048a1b9c2d9064cff55e6
We seek to assess our hypothesis in two ways: by strictly estimating the effect of the main component of social distancing (requirement/obligation to stay at home); and by observing the effect of all restrictive policies jointly. We collected data from 9 different sources, with a total number of 78 countries in our sample, representing all continents. Information on confirmed coronavirus cases and deaths comes from COVID-19 Dashboard by the Center for Systems Science and Engineering (CSSE) at Johns Hopkins University, which are based on official records from each country.
Data on anti-coronavirus policies (independent variable) is available on the Stringency Index of the Oxford COVID-19 Government Response Tracker. They have compiled government responses over 16 items, ranging from financial support to internal movement restrictions. Data are coded as ordinals, with larger numbers meaning greater restrictions. We have transformed these variables as dummies where “1” is equivalent to the most restrictive measure taken for each item. Relevant variables belong to the C group (containment and closure policies that arguably pertain to general social distancing, e.g. closing schools). Variable C6 (obligation to stay at home) is the one of most interest and potentially works as a proxy for the general social distancing response.
We present three measures for our dependent variable: total number of confirmed cases in the country, the velocity of dissemination - the difference in new daily confirmed cases (new cases in-country), and the number of confirmed cases per 100 thousand inhabitants (to deal with nonnormality in the distribution of population sizes). According to the discussion on cross-national case notification differences, it is likely that sub notification is correlated to other covariates. Since we cannot directly correct this problem, we assume covariate control reasonably deals with the issue.
The remainder of the data has been collected as pre-treatment controls, according to the following criteria: potential confounder, potential selection to treatment predictor, and additional predictor of outcome. Controls are: country distance to China, the total number of passengers carried in air transportation, populational density, urban population and elderly population, Gini index, and the quality of the health system. More details can be found in our online appendix.
Data structure presents the following obstacles to causal inference. First, the exposure to the new coronavirus varies from country to country, which limits the maximum emergency policy effectiveness. Second, countries also vary to previous systemic capacity (e.g. healthcare quality, population vulnerability), which could be confounding factors; and the existence of other unknown confounders could bias results.
To circumvent this, we adopt a time-series cross-sectional matching approach (Imai et al., 2020Imai, K., Kim, I. S., & Wang, E. (2020, January). Matching Methods for Causal Inference with Time-Series Cross-Sectional Data. Cambridge, MA: Harvard University.). By compiling data on countries’ pretreatment variables that credibly affect coronavirus severity and exposure potential, we can create balanced treatment and control groups for each possible policy. We assume that comparability regarding observable variables signifies comparability regarding unobservable ones (King, Lucas & Nielsen, 2017King, G., Lucas, C., & Nielsen, R. A. (2017). The balance sample size frontier in matching methods for causal inference. American Journal of Political Science, 61(2), 473-489.). Despite being a strong assumption, we remedy it by coupling matching with panel data. Repeated observations for the same cases allow us to credibly estimate consistent effects. Moreover, panel data aids in controlling for possible long-term causes.
This empirical strategy effectively assesses each unit’s observable pre-treatment history and estimates trends for each specified control variable. Then, treated countries are matched to untreated ones in a one-to-many fashion, where covariate balancing is achieved with a CBPS algorithm (Imai & Ratkovic, 2014Imai, K., Ratkovic, M. (2014). Covariate Balancing Propensity Score. Royal Statistical Society, 76(1), 243-263.). Since each treated unit has more than one assigned control, each unit within a group of controls is assigned a weight based on the propensity score distance measure, with units more similar to the treated unit being assigned greater weights. Weights are additive and sum 1. Then, our approach invokes a parallel trends assumption: since each treated unit is comparable to the historical trend of a weighted combination of all its controls, we assume treated and control units are counterfactuals of one another up to the point where the treatment occurs. Consequently, substantive differences in outcomes can be interpreted as the causal effect of the treatment. Data are updated to 07 of August 2020, but they can be automatically updated via replication file.
The table below displays covariate balance for our main treatment of interest. Entries are the averages of the differences between covariate values for treated and control units, standardized and expressed in standard deviations. As a rule of thumb, the matching approach should approximate differences inferior to 0.2. As can be observed, our approach stays well within this range for some covariates or keeps it very close. Different matching algorithms do not improve balance.
4. RESULTS
Our matching strategy creates a one-to-many matched set. For the C6 variable, we have 9 treated units, which means that from the 78 countries in our sample, 9 adopted an obligation to stay at home policy. Each treated unit is compared to a weighted average of control cases. The mode of control groups is 40 (the matching approach does not use information on all potential controls, attributing weights to units based on the distance measure), which helps to construct better counterfactuals. Controls can repeat between matched sets. Most treated units entered treatment on the first few days of March, indicating a relatively fast response to the coronavirus contagion. Additionally, most countries are either autocracies or democracies with an autocratic past, which lends credence to the argument forwarded by Trein (2020Trein, P. (2020). The Paradox of Prevention: Authoritarian Past and Liberal Democracy in Times of Crisis. SSRN paper. Retrieved from https://papers.ssrn.com/sol3/papers.cfm?abstract_id=3625523
https://papers.ssrn.com/sol3/papers.cfm?...
), that countries with an autocratic status from the late XIX to mid-XX century have higher odds of pursuing strict distancing policies. Covariates are well balanced for matched data given a CBPS (Covariate Balancing Propensity Score) algorithm.
There are three parameters of interest when estimating causal effects for our matching approach: the lag, or how much pre-treatment history to account for, the lead, or how many periods ahead to estimate causal effects, and if effects are assumed to be stable or not. We adopted a greedy approach to defining lag: matching countries for as many pre-treatment periods as possible without loss of covariate balancing. We estimate causal effects in weeks after policy adoption (up to 4 weeks), given that it is highly unlikely that social distancing policies yield immediate results. Lastly, we assume a stable policy change effect. To ensure adequate matching, we included a one-week lag of the dependent variable (relative to policy implementation). More detailed design description can be found in the online appendix. This means that our model considers that after a country adopts a social distancing policy, it keeps it up to the last time period in the dataset. This assumption forbids treated countries to return to being controls even if they no longer adopt the policy.
This assumption is necessary for the following reasons: almost all countries that adopt very strict distancing policies keep them for as long as we estimate causal effects (up to 4 weeks after implementation); and when a country ceases to implement maximum restriction, it rarely shifts to no restriction whatsoever (typically, countries shift from mandatory maximum restriction to social distancing policies). Thus, the “reversal” to control is not really a reversal. It is unlikely that a movement from control to treatment (sustained in the course of weeks) is equivalent to a movement from treatment to partial control3 3 We have conducted analyses for all possible levels of our main independent variable. No effects from other levels of strictness are robustly differentiable from zero, suggesting only truly strict policies adequately deal with contamination rates. Results can be checked in the replication file and online appendix. . To ensure adequate matching, we included a one-week lag of the dependent variable (relative to policy implementation).
Panel Matching matches countries observable histories and then implements a diff-in-diff estimator that yields valid ATTs (assuming that once observable histories are matched, treated and control units have parallel trends). We can also use weighing to recover ATEs for the entire population. We present results in the following order: effects of mandatory obligation to stay at home (C6) and joint effects of all social- distancing -related variables. Other policies’ individual effects, various policy combination effects, and ATEs can be found in the replication file or online appendix.

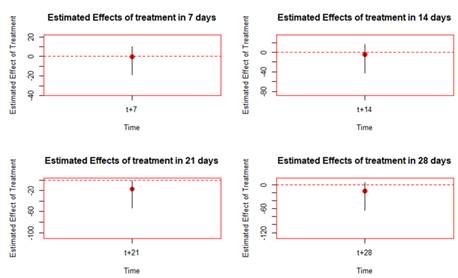
Results show social distancing policies do work by an estimated average of 4832 lives (for confirmed cases). 95% confidence intervals range from 13781 to 996; secondly, the effects of these policies do not seem to be perceptible until the third week and increase to 5526 in the fourth week after policy adoption. Albeit these results may seem modest compared to some countries’ current aggregated numbers, they most likely underestimate true effects in proportion to the prevalence of sub-notification in official data. We have conducted identical analyses for all possible levels variable C6 could possess. We find no evidence of causal effects for more lenient forms of social distancing. As an example, we present the causal effects of adopting “strong recommendation to stay at home”, which would be the second strictest kind of social distancing policy. Confidence intervals always contain 0, regardless of the quantity of interest (ATE or ATT).


Figure 3 shows the same effects as Figure 1, but for a variable that allows better comparability between countries: confirmed cases per 100 thousand inhabitants. We estimate an average effect (ATT) of 17.5 few people contaminated on the 21st day (per 100k). The average number of contaminated people per 100k is 15.62 in our dataset.

Figure 4 shows social distancing effects on the number of new daily cases, i.e. the velocity of contamination. On average, causal effects are perceptible after the second week, with 339 few people contaminated on a daily basis (CI: 899 - 38). Again, these results are subject to the amount of sub notification. Still, they show that aggregated effects show up more slowly because the first contagion velocity is affected. This average reduction is greater than several countries’ daily confirmed cases, suggesting strict social distancing could have arrested the spread of COVID-19 in part of the world.

C6 effects (interpreted here as a proxy for overall strict social distancing policy) are magnified when we estimate the joint effect of all C policies. Effects are perceptible from the very first week, peaking at an average of 16238 lives saved in the fourth week after policy implementation (CI: 60662 - 4978). These results suggest that an encompassing policy approach, including movement restrictions, internal travel, the closing of schools and business, among other related decisions, have sizeable effects, which can be observed relatively early.
To access the robustness of main results, we have also performed a sensitivity analysis. Results indicate causal estimates are robust to the inclusion of weak confounders and intermediate confounders in low confounder prevalence scenarios. A detailed description can be found in the online appendix or replication file.
5. CONCLUSION
Social distancing policies are an effective way of defeating the novel coronavirus pandemic. They start reducing contamination velocity in the second week after implementation, and by the third week aggregated numbers are significantly different between treated and non-treated. Our average estimate in the third week is 4832 lives (or 17.5 per 100k). Although the number may appear small, it is greater than the average number of confirmed cases in the dataset (15.62 per 100k). In our eyes, these results are substantial. With these results, we learned that political leaders that deny the effectiveness of social distancing should pay better attention to what reality says and be held accountable by their constituencies.
In what regards research limitations, two seem more evident: First, mensuration problems, especially in the dependent variable, lower the precision of all our estimates. Research mobilizing precise microdata should be very much welcome to further assess the issue. Second, our chosen design has one important shortcoming: it assumes no spillover effects (albeit being able to deal with carryover). Policy solutions tend to follow dissemination patterns over the world. Because spillover makes policies more likely to be implemented, we believe taking it into account would make causal estimates bigger instead of smaller.
Also, some potentially interesting questions regarding policy efficacy have been left out of this paper. For example, does government response speed matter? Unfortunately, our research design, in maximizing identification, places strict limitations on which form our independent variable can take. When the treatment indicator is a dummy, the counterfactual is more tractable to pose and investigate. In the case of government response speed, the counterfactual is not clear-cut, which would muddle causal analysis.
The new coronavirus pandemic has caused tremendous suffering for populations all over the world and policymakers have faced huge challenges to save lives. More than ever, public policy must be based on robust scientific evidence. We hope to contribute to this with four main recommendations based on our results and some suggestions for further research:
-
Only very strict distancing policies seem to work to credibly differentiate adopters from non-adopters. Political leaders should consider shock-like lockdowns (or similar bundles of policies), instead of lenient approaches of social distancing, as more effective tools to control virus dissemination.
-
As one could expect, effects of stricter social distancing policies are not immediate. Our results show they can take at least three weeks to present an observable effect on contamination. Policymakers should consider this when defining the duration of restrictive policies, alongside other relevant social aspects.
-
Communication with the population can be a key aspect to make citizens understand the need for more rigorous policies during a relatively short time. We suggest researchers test how communication measures can affect the magnitude of stay-at-home policies.
-
The effect of a mandatory stay-at-home policy can be amplified as other social distancing policies (e.g. cancellation of public events and suspension of school activities) are also adopted. This is important to reinforce social distancing and should be taken into consideration by decision-makers.
ACKNOWLEDGEMENTS
We are grateful to the Pernambuco’s Foundation for the Support of Science and Technology (Fundação de Amparo à Ciência e Tecnologia de Pernambuco - FACEPE) for their financial support via the Doctoral Scholarships of Amanda Domingos, Marcus Torres e Matheus Cunha and to the Coordination for the Improvement of Higher Education Personnel (Coordenação de Aperfeiçoamento de Pessoal de Nível Superior - CAPES) for the Doctoral Scholarship of Virginia Rocha. We also thank the reviewers’ comments on the first version of this manuscript, which were extremely valuable to improve our study. Any mistake is our responsibility.
REFERENCES
- Ainslie, K. E., Walters, C. E., Fu, H., Bhatia, S., Wang, H., Xi, X. ... Cattarino, L. (2020). Evidence of initial success for China exiting COVID-19 social distancing policy after achieving containment. Wellcome Open Research, 81(5). Retrieved from https://wellcomeopenresearch.org/articles/5-81
» https://wellcomeopenresearch.org/articles/5-81 - Allcott, H., Boxell, L., Conway, J., Gentzkow, M., Thaler, M. … Yang, D. Y. (2020). Polarization and public health: Partisan differences in social distancing during the Coronavirus pandemic (NBER Working Paper, w26946). Cambridge, MA: National Bureau of Economic Research.
- Batista, M., & Domingos, A. (2017). Mais que boas intenções: técnicas quantitativas e qualitativas na avaliação de impacto de políticas públicas. Revista Brasileira de Ciências Sociais, 32(94), 1-24.
- Boin, A. (2019). The Transboundary Crisis: Why we are unprepared and the road ahead. Journal of Contingencies and Crisis Management, 27(1), 94-99.
- Boin, A., & McConnell, A. (2007). Preparing for critical infrastructure breakdowns: the limits of crisis management and the need for resilience. Journal of contingencies and crisis management, 15(1), 50-59.
- Chen, H., Cohen, P., & Chen, S. (2010). How big is a big odds ratio? Interpreting the magnitudes of odds ratios in epidemiological studies. Communications in Statistics -simulation and Computation, 39(4), 860-864.
- Cole, S., Healy, A., & Werker, E. (2012). Do voters demand responsive governments? Evidence from Indian disaster relief. Journal of Development Economics, 97(2), 167-181.
- Fredrickson, B. L., & Kahneman, D. (1993). Duration neglect in retrospective evaluations of affective episodes. Journal of personality and social psychology, 65(1), 45.
- Gasper, J. T., & Reeves, A. (2011). Make it rain? Retrospection and the attentive electorate in the context of natural disasters. American Journal of Political Science, 55(2), 340-355.
- Grint, K. (2020). Leadership, Management and Command in the time of the Coronavirus. Leadership, 16(3), 314-319.
- Hall, P. A. (2016). Politics as a process structured in space and time. In O. Fioretos, J Lynch & Ad Steinhouse (Eds.), The Oxford Handbook of Historical Institutionalism (pp. 31-50). New York, NY: Oxford University Press.
- Healy, A., & Malhotra, N. (2009). Myopic voters and natural disaster policy. American Political Science Review, 103(3), 387-406.
- Imai, K., Kim, I. S., & Wang, E. (2020, January). Matching Methods for Causal Inference with Time-Series Cross-Sectional Data Cambridge, MA: Harvard University.
- Imai, K., Ratkovic, M. (2014). Covariate Balancing Propensity Score. Royal Statistical Society, 76(1), 243-263.
- Jacobs, A. M. (2016). Policy making for the long term in advanced democracies. Annual Review of Political Science, 19(1), 433-454.
- Kahn, M. E. (2005). The death toll from natural disasters: the role of income, geography, and institutions. Review of economics and statistics, 87(2), 271-284.
- King, G., Lucas, C., & Nielsen, R. A. (2017). The balance sample size frontier in matching methods for causal inference. American Journal of Political Science, 61(2), 473-489.
- Langer, T., Sarin, R., & Weber, M. (2005). The retrospective evaluation of payment sequences: duration neglect and peak-and-end effects. Journal of Economic Behavior & Organization, 58(1), 157-175.
- Liu, W., Kuramoto, S. J., & Stuart, E. A. (2013). An introduction to sensitivity analysis for unobserved confounding in nonexperimental prevention research. Prevention science, 14(6), 570-580.
- Maier, Benjamin F., and Dirk Brockmann. “Effective containment explains subexponential growth in recent confirmed COVID-19 cases in China”. Science, 368(6492), 742-746 2020.
- Matrajt, L., & Leung, T. (2020). Evaluating the Effectiveness of Social Distancing Interventions to Delay or Flatten the Epidemic Curve of Coronavirus Disease. Emerging Infectious Diseases, 26(8).
- Nature. (2020, March 18). The coronavirus pandemic in five powerful charts: From papers published to carbon emissions to confirmed cases, these data reveal an unprecedented viral outbreak and its impacts around the world Retrieved from https://www.nature.com/articles/d41586-020-00758-2
» https://www.nature.com/articles/d41586-020-00758-2 - Neumayer, E., Plümper, T., & Barthel, F. (2014). The political economy of natural disaster damage. Global Environmental Change, 24, 8-19.
- O’kane, C. (2020, April 06). These countries have started flattening the curve. Here’s how long it took them. CBS News Retrieved from https://www.cbsnews.com/news/flatten-curve-coronavirus-countries/
» https://www.cbsnews.com/news/flatten-curve-coronavirus-countries/ - Pandey, K. R., Subedee, A., Khanal, B., & Koirala, B. (2020). COVID-19 Control Strategies and Intervention Effects in Resource Limited Settings: A Modeling Study. medRxiv Retrieved from https://www.medrxiv.org/content/10.1101/2020.04.26.20079673v2
» https://www.medrxiv.org/content/10.1101/2020.04.26.20079673v2 - Pisano, G. P., Sadun, R., & Zanini, M. (2020, March 27). Lessons from Italy’s Response to Coronavirus Retrieved from https://hbr.org/2020/03/lessons-from-italys-response-to-coronavirus
» https://hbr.org/2020/03/lessons-from-italys-response-to-coronavirus - Prem, K., Liu, Y., Russell, T. W., Kucharski, A. J., Eggo, R. M., Davies, N., ... Abbott, S. (2020). The effect of control strategies to reduce social mixing on outcomes of the COVID-19 epidemic in Wuhan, China: a modelling study. The Lancet Public Health Retrieved from https://www.thelancet.com/journals/lanpub/article/PIIS2468-2667(20)30073-6/fulltext
» https://www.thelancet.com/journals/lanpub/article/PIIS2468-2667(20)30073-6/fulltext - Rafael, R. D. M. R., N Neto, M., Carvalho, M. M. B., David, H. M. S. L., Acioli, S. ... Araujo Faria, M. G. (2020). Epidemiologia, políticas públicas e pandemia de Covid-19: o que esperar no Brasil?. Revista Enfermagem UERJ, 28, 49570. Retrieved from https://www.e-publicacoes.uerj.br/index.php/enfermagemuerj/article/view/49570
» https://www.e-publicacoes.uerj.br/index.php/enfermagemuerj/article/view/49570 - Taylor, D. B. (2020, May 12). How the Coronavirus Pandemic Unfolded: a Timeline. The New York Times Retrieved from https://www.nytimes.com/article/coronavirus-timeline.html
» https://www.nytimes.com/article/coronavirus-timeline.html - Tisdall, S. (2020, May 17). Trump, Putin and Bolsonaro have been complacent. Now the pandemic has made them all vulnerable. The Guardian Retrieved from https://www.theguardian.com/commentisfree/2020/may/17/trump-putin-and-bolsonaro-have-been-complacent-now-the-pandemic-has-made-them-all-vulnerable
» https://www.theguardian.com/commentisfree/2020/may/17/trump-putin-and-bolsonaro-have-been-complacent-now-the-pandemic-has-made-them-all-vulnerable - Trein, P. (2020). The Paradox of Prevention: Authoritarian Past and Liberal Democracy in Times of Crisis. SSRN paper Retrieved from https://papers.ssrn.com/sol3/papers.cfm?abstract_id=3625523
» https://papers.ssrn.com/sol3/papers.cfm?abstract_id=3625523 - VanderWeele, T. J., & Arah, O. A. (2011). Unmeasured confounding for general outcomes, treatments, and confounders: bias formulas for sensitivity analysis. Epidemiology, 22(1), 42-52.
- Zaller, J. R. (1992). The nature and origins of mass opinion Cambridge, UK: Cambridge University Press.
-
1
Retrieved from https://veja.abril.com.br/mundo/italia-confirma-seus-dois-primeiros-casos-do-novo-coronavirus-no-pais/
-
2
For documentation we follow the TIER protocol 4.0. Replication materials and online appendix are publicly retrieved from https://osf.io/qndjh/?view_only=9cdd2e8b8d9048a1b9c2d9064cff55e6
-
3
We have conducted analyses for all possible levels of our main independent variable. No effects from other levels of strictness are robustly differentiable from zero, suggesting only truly strict policies adequately deal with contamination rates. Results can be checked in the replication file and online appendix.
-
(Original version)
Publication Dates
-
Publication in this collection
05 Mar 2021 -
Date of issue
Jan-Feb 2021
History
-
Received
01 June 2020 -
Accepted
10 Nov 2020

 Source: Elaborated by the authors.
 Source: Elaborated by the authors.
 Source: Elaborated by the authors.
 Source: Elaborated by the authors.
 Source: Elaborated by the authors.