Abstracts
Currently, sugarcane plays an important global role, particularly with a view to alternative energy sources. Thus, in a sugarcane field of the mill Vale do Paraná S/A Álcool e Açúcar, Rubineia, São Paulo State, managed under two green cane harvest systems (cane trash left on and cane trash removed from the soil), Pearson and spatial correlations between the sugarcane yield (variety RB855035 in the third cut) and soil physical and chemical properties were studied to identify the property best correlated with stalk yield and the best harvest method. For this purpose, two geostatistical grids (121 sampling points on 1.30 ha) were installed on a eutrophic Red Argisol (homogeneous slope of 0.065 m m-1), in 2011, to determine the properties: stalk yield and sugarcane plant population, and soil resistance to penetration, gravimetric moisture, bulk density, and carbon stock, in the layers 0-0.20 and 0.20-0.40 m. The data were analyzed by descriptive, linear correlation and geostatistical analysis. In both treatments, the property stand density was best correlated with sugarcane yield (r = 0.725 in the trash mulching treatment - TM and r = 0.769 in the trash removal treatment - TR). However, in relation to the soil properties, bulk density (0-0.20 m) was best correlated (r = 0.305 in TM, r = 0.211 in TR). Similarly, from the spatial point of view, stand density was the property that best explained the sugarcane yield. However, in the TM treatment the density (0.20-0.40 m) was the only soil property spatially correlated with stalk yield. The carbon stock in the soil of the TM was 11.5 % higher than in the TR treatment. Results of the TM treatment were best, also with regard to soil management and conservation.
sugar and ethanol production; soil management and conservation; environmental sustainability; kriging maps; Saccharum officinarum L.
Atualmente, a cultura da cana-de-açúcar desempenha importante papel no cenário mundial, sobretudo ao aspecto relacionado às fontes energéticas alternativas. Assim, em um talhão de cana-de-açúcar na Usina Vale do Paraná S/A Álcool e Açúcar, Rubineia, SP, manejado sob duas formas de colheita da cana crua, com palhada (COP) e sem palhada (SEP) sobre o solo, foram estudadas as correlações Pearson e espacial entre a produtividade da cana-de-açúcar (variedade RB855035, em seu terceiro corte) e as propriedades físico-químicas do solo, objetivando verificar aquele que possui a melhor correlação com essa produtividade, assim como o melhor método de colheita. Para tanto, foram instaladas duas malhas geoestatísticas (1,30 ha e 121 pontos amostrais cada) em um Argissolo Vermelho eutrófico (declive homogêneo de 0,065 m m-1), no ano de 2011. Os atributos avaliados foram: produtividade de colmos de cana-de-açúcar, população de plantas, resistência do solo à penetração, umidade gravimétrica, densidade e estoque de carbono do solo, nas profundidades de 0-0,20 e 0,20-0,40 m. Realizaram-se as análises descritiva, correlações lineares e geoestatística dos dados. Em ambos os tratamentos, a população de plantas apresentou a melhor correlação de Pearson (r = 0,725** em COP; r = 0,769** em SEP), com a produtividade da cana-de-açúcar. Entretanto, em relação ao solo, a densidade (0-0,20 m) teve a melhor correlação (r = 0,305** em COP; r = 0,211* em SEP). Da mesma forma, do ponto de vista espacial, a população de plantas melhor explicou a produtividade da cana-de-açúcar. Contudo, a densidade (0,20-0,40 m) do tratamento com palhada foi a única propriedade do solo que apresentou correlação espacial com a produtividade de colmos. O estoque de carbono do solo para o tratamento com palhada foi 11,5 % superior ao sem palhada. O tratamento com palhada foi o que possibilitou os melhores resultados, inclusive no que se refere ao manejo e à conservação do solo.
produção sucroalcooleira; manejo e conservação do solo; sustentabilidade ambiental; mapas de krigagem; Saccharum officinarum L
DIVISÃO 3 - USO E MANEJO DO SOLO
COMISSÃO 3.3 - MANEJO E CONSERVAÇÃO DO SOLO E DA ÁGUA
Sugarcane trash management assessed by the interaction of yield with soil properties1 1 Part of the Doctoral Thesis of the first author - PG at Vegetable Production - Universidade Estadual Paulista "Júlio de Mesquita Filho" - Soil, Rural Engineering and Plant Disease Department - UNESP - DEFERS.
Manejo da palhada de cana-de-açúcar avaliado pela interação da produtividade com propriedades do solo
Flávio Carlos DalchiavonI; Morel de Passos e CarvalhoII; Rafael MontanariII; Marcelo AndreottiII; Edjair Augusto Dal BemIII
IFull Professor at the Instituto Federal do Mato Grosso, Campus Campo Novo do Parecis, Department of Agronomy. Rodovia MT 235, km 12, Zona Rural. Mail Box 100. CEP 78360-000 Campo Novo do Parecis (MT), Brazil, E-mail: flavio.dalchiavon@cnp.ifmt.edu.br
IIFull Professor, DEFERS - UNESP. Av. Brasil Centro, 56, Zona Sul. Mail Box 31. CEP 15385-000 Ilha Solteira (SP), Brazil. E-mail: morel@agr.feis.unesp.br, montanari@agr.feis.unesp.br, dreotti@agr.feis.unesp.br
IIIUndergraduate student, DEFERS - UNESP. E-mail: edjairflorestal@hotmail.com
SUMMARY
Currently, sugarcane plays an important global role, particularly with a view to alternative energy sources. Thus, in a sugarcane field of the mill Vale do Paraná S/A Álcool e Açúcar, Rubineia, São Paulo State, managed under two green cane harvest systems (cane trash left on and cane trash removed from the soil), Pearson and spatial correlations between the sugarcane yield (variety RB855035 in the third cut) and soil physical and chemical properties were studied to identify the property best correlated with stalk yield and the best harvest method. For this purpose, two geostatistical grids (121 sampling points on 1.30 ha) were installed on a eutrophic Red Argisol (homogeneous slope of 0.065 m m-1), in 2011, to determine the properties: stalk yield and sugarcane plant population, and soil resistance to penetration, gravimetric moisture, bulk density, and carbon stock, in the layers 0-0.20 and 0.20-0.40 m. The data were analyzed by descriptive, linear correlation and geostatistical analysis. In both treatments, the property stand density was best correlated with sugarcane yield (r = 0.725 in the trash mulching treatment - TM and r = 0.769 in the trash removal treatment - TR). However, in relation to the soil properties, bulk density (0-0.20 m) was best correlated (r = 0.305 in TM, r = 0.211 in TR). Similarly, from the spatial point of view, stand density was the property that best explained the sugarcane yield. However, in the TM treatment the density (0.20-0.40 m) was the only soil property spatially correlated with stalk yield. The carbon stock in the soil of the TM was 11.5 % higher than in the TR treatment. Results of the TM treatment were best, also with regard to soil management and conservation.
Index terms: sugar and ethanol production, soil management and conservation, environmental sustainability, kriging maps, Saccharum officinarum L.
RESUMO
Atualmente, a cultura da cana-de-açúcar desempenha importante papel no cenário mundial, sobretudo ao aspecto relacionado às fontes energéticas alternativas. Assim, em um talhão de cana-de-açúcar na Usina Vale do Paraná S/A Álcool e Açúcar, Rubineia, SP, manejado sob duas formas de colheita da cana crua, com palhada (COP) e sem palhada (SEP) sobre o solo, foram estudadas as correlações Pearson e espacial entre a produtividade da cana-de-açúcar (variedade RB855035, em seu terceiro corte) e as propriedades físico-químicas do solo, objetivando verificar aquele que possui a melhor correlação com essa produtividade, assim como o melhor método de colheita. Para tanto, foram instaladas duas malhas geoestatísticas (1,30 ha e 121 pontos amostrais cada) em um Argissolo Vermelho eutrófico (declive homogêneo de 0,065 m m-1), no ano de 2011. Os atributos avaliados foram: produtividade de colmos de cana-de-açúcar, população de plantas, resistência do solo à penetração, umidade gravimétrica, densidade e estoque de carbono do solo, nas profundidades de 0-0,20 e 0,20-0,40 m. Realizaram-se as análises descritiva, correlações lineares e geoestatística dos dados. Em ambos os tratamentos, a população de plantas apresentou a melhor correlação de Pearson (r = 0,725** em COP; r = 0,769** em SEP), com a produtividade da cana-de-açúcar. Entretanto, em relação ao solo, a densidade (0-0,20 m) teve a melhor correlação (r = 0,305** em COP; r = 0,211* em SEP). Da mesma forma, do ponto de vista espacial, a população de plantas melhor explicou a produtividade da cana-de-açúcar. Contudo, a densidade (0,20-0,40 m) do tratamento com palhada foi a única propriedade do solo que apresentou correlação espacial com a produtividade de colmos. O estoque de carbono do solo para o tratamento com palhada foi 11,5 % superior ao sem palhada. O tratamento com palhada foi o que possibilitou os melhores resultados, inclusive no que se refere ao manejo e à conservação do solo.
Termos de indexação: produção sucroalcooleira, manejo e conservação do solo, sustentabilidade ambiental, mapas de krigagem, Saccharum officinarum L.
INTRODUCTION
In Brazil, the socioeconomic importance of sugarcane (Saccharum officinarum L.) is unquestioned. It represents the main raw material for the production of ethanol motor fuel, apart from the destination for sugar, one of the main export commodities of the country. In the national harvest 2010/11, 623.9 million tons of cane (stalks) were processed. Of this amount, the State of São Paulo accounted for 57.8 %, produced on an area of 4.36 million ha, with an average yield of 83.0 t ha-1 (CONAB, 2011). In several cane-producing countries, it is common to burn the cane fields before the harvest, because burning off the dense leaf biomass (trash) facilitates the manual cutting of the stalks (Luca et al., 2008). This system eliminates practically all of the trash produced in the area. On the other hand, in the harvest system of green (unburnt) cane, the trash is left on the soil surface as mulch. This modifies the environment positively in several aspects, by protecting the soil against erosion, preserving the soil moisture, increasing microbial activity and accumulating organic matter.
In sugarcane-producing areas, soil compaction is a major problem, for hampering root penetration by increased soil density due to a reduction of its volume. This leads to the expulsion of air from the soil pores, affecting the equilibrium in the relationship between soil gases and the water and nutrient availability to plants, limiting crop yields (Montanari et al., 2012). According to Bengough et al. (2001), resistance to penetration, an indicator of the compaction degree, is influenced, among other factors, by the organic carbon content, bulk density and moisture of the soil. Moreover, it can help determine the consequent effect on the root development of sugarcane, which allows the establishment of threshold values of restriction to root growth and decreased yield.
The spatial dependence of georeferenced data is analyzed by geostatistics, to which semivariograms are adjusted representing the distances between field observations in a graph of semivariance. From this a kriging map can be drawn for each soil or plant property, representing the spatial variability of the data. However, in the case of correlations between spatial dependencies of any two properties, modeled by the cross semivariogram, a cokriging map can be constructed of the main property, difficult to measure and of greater interest, by means of the secondary property, which is usually easier to obtain (Molin et al., 2007; Montanari et al., 2010; Dalchiavon et al., 2011, 2012; Dalchiavon & Carvalho, 2012).
Thus, by the geostatistical analysis, the soil variability may indicate management alternatives to minimize its effects on sugarcane yield, as well as enable estimates under certain management practices (Dalchiavon et al., 2011). Technological advances in agriculture have shown the importance of knowing the spatial variation of properties that affect crop yield, to optimize resource utilization and cost reduction. Thus, in a sugarcane field of the mill Valley Paraná S/A Alcohol and Sugar Rubineia - SP (testing two green cane harvest systems - with trash mulching and trash removal from the soil), we studied the correlations (Pearson and spatial) between the sugarcane yield (variety RB855035 in the third cut) and physical and chemical properties of the soil in order to verify that it has the best correlation with yield so that as the best method of harvesting.
MATERIAL AND METHODS
The study was carried out in Rubineia, São Paulo State, Brazil, in a sugarcane field of the sugar mill Vale do Paraná S/A Álcool e Açúcar (20o 17’ 53’’ S and 51o 02’ 23’’ W, on average 348 m asl), with eutrophic Red Argisol (Ultisol), according to the Brazilian system of soil classification (Embrapa, 2006). In the beginning the soil properties (August/2010) in the 0-0.20 and 0.20-0.40 m layers, respectively, were the following: pH (CaCl2) = 4.8 and 5.3; MO = 15 and 11 g dm-3; P (resin) = 5 and 3 mg dm-3; K, Ca, Mg and H+Al = 1.2 and 0.7; 18 and 16; 8 and 6; and 18 and 16 mmolc dm-3; V = 60 and 59 %; and clay, silt and sand contents of 89 and 141; 67 and 81; and 844 and 778 g kg-1, respectively. The climate is humid and tropical megathermal (Aw), with high temperatures, rainy summers and dry winters. Climatic data in the experimental period were: maximum, average and minimum temperature of 26.0; 24.3 and 22.9 oC, respectively, and rainfall 1,365 mm (Figure 1).
To plant sugarcane (variety RB855035) on a pasture area (Brachiaria), the grass had to be desiccated with 1,800 g ha-1 Glyphosate. Soil tilling consisted of heavy disk harrowing (once) and intermediate disk harrowing (twice), in May 2008, after liming with 1.0 t ha-1 limestone and (REL 85 %) plowing with a moldboard plow, to a depth of 0.35 m, and a final level harrowing. At furrowing, the area was fertilized with 500 kg ha-1 of 06-30-24 NPK fertilizer and in the planting furrows, besides the plantlets, 250 g ha-1 active ingredient of Fipronil was applied to control soil pests.
As of planting in June 2008, in a row spacing of 1.50 m, sugarcane was harvested mechanically, green and in stalks. The sugarcane management in the field was based on the management used by the sugar mill Vale do Paraná S/A Álcool e Açúcar. Thus, the ratoon crop was broadcast fertilized with 500 kg ha-1 23-00-15 NPK fertilizer (2009 and 2010). After the second cutting, two treatments were tested (T): T1 = all sugarcane residue (trash) produced in the previous phenological cycle - 2009/2010 left on the ground (trash mulching - TM) and T2 = removal of the trash (TR), to determine the influence of each treatment on the subsequent crop (2010/2011). The x and y axes of the Cartesian coordinate system were defined for the establishment of the experimental grid, using a common optical level. On the y axis, 11 transects were allocated, spaced 13 m apart, each with 11 sampling points spaced 10 m apart, totaling 121 sampling points, with one sample per point in each 13 000 m2 mesh (100 x 130 m), representing one treatment.
Soil and plant properties of individually collected material from each sample point were evaluated. The soil physical properties were: soil resistance to penetration (PR), assessed by impact penetrometer (Stolf); gravimetric moisture (GM), to support the PR data; and bulk density (BD), determined from undisturbed samples collected with a volumetric ring (height 4.05 cm, diameter 5.55 cm). The chemical property soil carbon pool (CP) was assessed; organic C was determined by wet combustion and colorimetry. Soil samples were collected between the plant rows in two layers: 0-0.20 and 0.20-0.40 m. The properties PR (MPa) and GM (kg kg-1) were obtained by the same procedure adopted by Dalchiavon et al. (2011), BD (kg dm-3) as proposed by Montanari et al. (2012) and CP (t ha-1), as described by Novais Filho et al. (2007).
Regarding the plant properties was evaluated for sugarcane stalk yield (YLD) and stand density (STD) in the third cut. The YLD (t ha-1) was obtained by weighing the stalks harvested manually (07/15/2011) in an area of 9 m2 (3 x 3 m), from two 3-m rows, on electronic-digital analytical balance (+/-0.05 kg). The STD, expressed in number of plants per meter, was obtained by counting the stalks harvested in 6 m and computing their average.
For each treatment a descriptive data analysis was performed using SAS Software (Schlotzhaver & Littell, 1997). The hypothesis of data normality was tested with the Shapiro & Wilk (1965) test at 5 %. For comparison between treatments (TM and TR), a F test was performed with the statistical program SISVAR (Ferreira, 2007). Then the Pearson correlation matrix and modeled regressions with Excel® spreadsheet calculations were established. The spatial dependence by the semivariogram, and the maps were calculated using Gamma Design Software 7.0 (GS+, 2004). By the stationary blurring for the property, the data trend was withdrawn by the technique of multiple polynomial regression, presented by Dalchiavon (2010), as well as its fitting criteria. The spatial dependence criteria (SDC) were as proposed by Dalchiavon et al. (2012): SDC < 20 % = spatial variable with very low dependence (VL); 20 % ≤ SDC < 40 % = low dependence (LO); 40 % ≤ SDC < 60 % = average dependence (ME); 60 % ≤ SDC < 80 % = high dependence (HG), and 80 % ≤ SDC < 100 % = very high dependence (VH).
By stationary blurring for any property (PRO), the data trend is extracted by the polynomial regression method, working therefore, with the residual data. These were labeled by # in the tables of semivariogram analysis and cross-validation (#PRO). However, when referred to in the kriging and/or cokriging maps, they were preceded by £ (£PRO). Spatial correlations were established by the technique of cokriging between the properties of interest and with spatial dependence.
RESULTS AND DISCUSSION
The frequency distribution of the plant property data in both treatments was normal (Table 1), tested as significant by the normality test of Shapiro & Wilk (1965), since their values were between 0.174 and 0.449, in agreement with Souza et al. (2008) and Braga (2011). The soil properties with normal frequency distribution were PR2, GM1, GM2, and BD2 (TM) and Pr, Gm and Bd (TR) in both soil layers, similar to the findings Souza et al. (2004), who also observed this frequency distribution for GM, PR and BD (all-capital abbreviations are related to the TM treatment and capital-lowercase abbreviations to TR). For the other soil properties, the undetermined frequency distribution, suggesting data heterogeneity, may be an "inheritance" of the initial tillage, which typically induces heterogeneous conditions.
According to the table 1, the sugarcane yield in TM (YLD) was 94.6 t ha-1, and the yield in TR (YLD) 84.9 t ha-1, both higher than the average in the State of São Paulo in 2011 (83.0 t ha-1) (CONAB, 2011), as well as above the regional averages for third-cut sugarcane (89.2 t ha-1) (Braga, 2011) and 89.5 t ha-1 (Gioia, 2011). This YLD can be the result of the conditions given by the weather during the growing season in the field (Figure 1) and soil fertility (liming and maintenance fertilization), in addition to the final STD - 11.5 plant m-1 (TM) and Std - 10.6 plant m-1 (TR) - considered adequate for the variety under study, with average tillering capacity (Ridesa, 2010).
When any statistical variable has a normal frequency distribution, the most appropriate measure of central tendency to represent is the average. In contrast, if the frequency distribution were undetermined, it would be the median (Montanari et al., 2012). Thus, according to table 1 for the observed values of GM (0.104 - 0.146 kg kg-1), the values of PR (0.925 - 1.904 MPa) are considered low to moderate, respectively, representing no limitation to the crop root development, for which only values above 2 MPa are considered critical (Arshad et al., 1996). Increasing values of PR in the deeper layer (TM and TR) are effects of the subsoil compaction by agricultural machinery for harvesting, fertilization and other crop management practices. However, the BD values (1.551-1.610 kg dm-3) were below the critical limit (Reichert et al., 2007) for the studied soil, i.e., 1.70 kg dm-3. However CP (13.9 - 19.7 t ha-1) was greater in the upper layer, in both grids, as expected, since the main feature of mechanical green harvesting is the gradual increase in organic matter in the surface layer, reflecting the amount and quality of plant residue accumulated over the years. However, these values were lower than those cited by Gioia (2011).
For the plant properties, the F values of analysis of variance indicated no treatment effect (Table 2). It was observed that YLD (TM) was 11.4 % higher than in TR, and STD was 9.5 % higher. This behavior was due to the residues of the previous crop left in the area, increasing the levels of soil organic matter, compared with the initial analysis (August/2010), which is extremely relevant for the soil physical, chemical and biological properties as well as for sugarcane (Mendonza et al., 2000).
In relation to the soil properties, only BD1 was not significantly different between treatments (Table 2). In contrast, other properties (88 %) differed between treatments, indicating that at a higher organic carbon content, the soil will be better structured, retain more moisture, with consequent reduction in PR (as in the case of TM) and develop the sugarcane root system better. This result is extremely important, since it confirms the relevance of leaving the sugarcane trash on the soil, as also reported by Mendonza et al. (2000), who described the benefits of this practice. When comparing data, it was observed that 90 % of the properties were statistically significant by the F test, proving that treatment TM performed best from the point of view of soil conservation for the studied soil properties, the treatment had a direct impact on sugarcane performance, i.e., higher yields resulting in higher profit for the sugarcane growers.
Among the significant correlations (Pearson) of interest in TM were the pairs YLD x STD (r = 0.725**), YLD x GM1 (r = 0.231**) and YLD x BD1 (r = 0.305**), and in TR, YLD x STD (r = 0.769**) and BD1 x YLD (r = 0.211*), demonstrating that the property STD, regardless of the treatment, contributed most to increase YLD, corroborating Braga (2011) and Gioia (2011). These correlations presented direct behavior, indicating that an increase in the values of these properties (cause) results in an increase in YLD (effect), while the opposite is also true. Souza et al. (2008) reported a significant positive linear correlation between YLD and GM1 in an Oxisol.
The equation modeled for YLD x STD was represented by the direct polynomial model (Equation 1), in disagreement with Gioia (2011), who applied an exponential model. The coefficient of correlation showed a high value, considering the high number of observations (r = 0.740 **; n = 121). If the STD varies between 7.9 and 15.8 plant m-1 (Table 1), the YLD estimate would increase from 76.0 to 114.2 t ha-1, respectively. Similarly, when considering the average STD (11.5 plant m-1), the YLD estimate would be 94.8 t ha-1, a value close to the YLD obtained in this study. The equation of YLD x GM1 was explained by the direct exponential model (Equation 2). Thus, the YLD increased from 87.1 to 103.0 t ha-1, when the soil GM1 increased from 0.106 to 0.194 kg kg-1, as an YLD value of 94.0 t ha-1 corresponded to GM1 of 0.146 kg kg-1.
With regard to bulk density, YLD responded linearly to increments in BD1 (Equation 3), from the minimum value of 84.6 (1.256 kg dm-3) to 101.7 t ha-1 (1.738 kg dm-3). The increase in BD1 may have benefited the root-soil contact, explaining the positive correlation. Furthermore, the correlation of YLD with GM1 was significant and positive, suggesting that to a certain level there was a benefit, increasing the BD1 at water saturation, and therefore the plant nutrient uptake from the soil solution was probably improved, as also mentioned by Hill et al. (1985) and Pacheco & Cantalice (2011). These authors stated that one of the beneficial effects of soil compaction can be attributed to increased water availability to the crop in drier periods, due to a higher soil contact with the roots, resulting from the lower macropore/micropore ratio.
YLD = 22.6 STD(0.587**) (r = 0.740**; n = 121) (1)
YLD = 71.1 e(GM1x1.91**) (r = 0.235**; n = 121) (2)
YLD = 40.0 + 35.5** BD1 (r = 0.305**; n = 121) (3)
On the other hand, Std x Yld was represented by a quadratic polynomial model (Equation 4), in agreement with Braga (2011). The maximum was established at 15.2 plant m-1. Determining the ideal Std is an extremely important agricultural aspect, in view of the close relationship with increases in stalk yield. To Bd1, Yld responded linearly (Equation 5). Thus, the Yld values ranged from 79.6 (Bd1 = 1.357 kg dm-3) to 90.2 t ha-1 (Bd1 = 1.743 kg dm-3).
Yld = -25.4 + 16.2 Std - 0.533 Std² (r² = 0.626**; n = 121)(4)
Yld = 42.1 + 27.6* Bd1 (r = 0.211*; n = 121) (5)
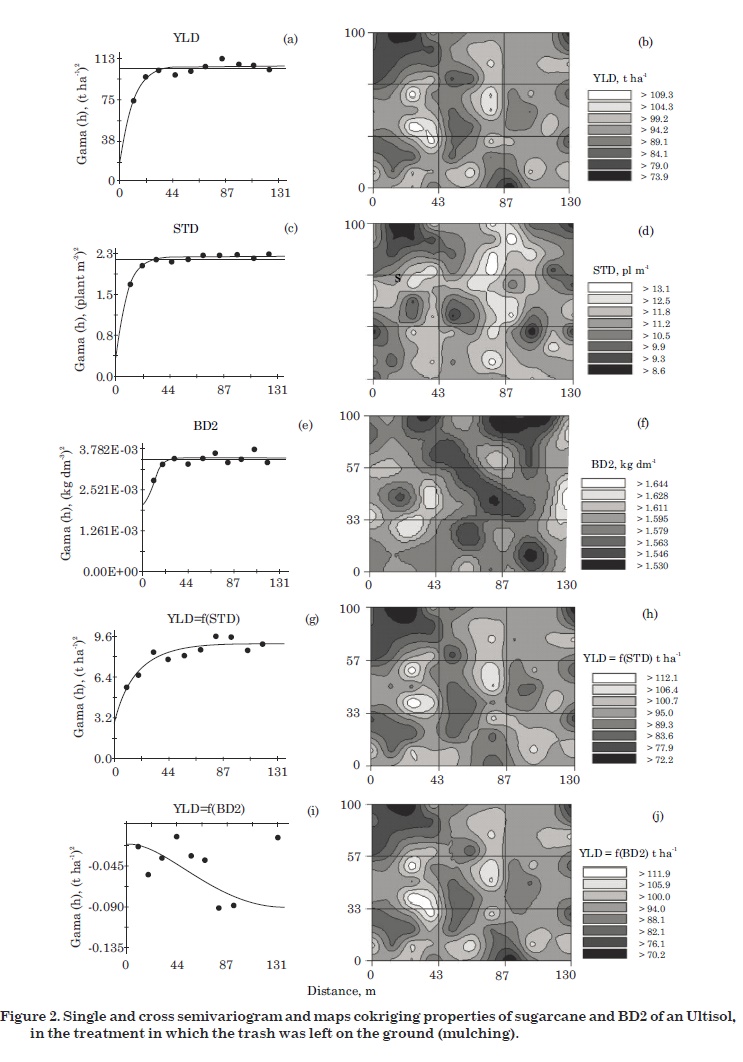
The parameters of the single and cross-semivariograms and cross-validation of the properties with spatial dependence are shown in table 3. The single semivariograms, analyzed by the respective spatial correlation coefficients (r2), were between 0.979 (#Yld) and 0.680 (#CP2) and the geostatistical range was between 59.0 (#Yld) and 22.0 m (PR1 and BD2) and the angular coefficients (b) of the cross-validation between 1.000 (#Yld) and 0.384 (BD2). The property with best semivariogram fitting, #Yld (spherical model), had a range 59.0 m and SDC (60.5 %) higher (Table 3, Figure 3a), while YLD fitted to an exponential mo<a href="../img/a27tab03.jpg">Table 3</a>del (Table 3, Figure 2a), a range of 30.9 m and very high SDC (88.2 %), similarly to Gioia (2011). The Gaussian model was adjusted for BD2 (Table 3, Figure 2e), with a range of 22.0 m and average SDC (40.3 %), in contrast to the exponential model adjusted by Souza et al. (2010). In both treatments, STD adjusted to the exponential model, in agreement with Braga (2011).
Figure 2b (TM) shows the highest values of YLD (94.2 to 109.3 t ha-1) in the North-South, East-West (along the central transverse lines) and in the Southeast and Northeast directions. In the other regions, the values were lower (73.9 to 89.1 t ha-1), indicating patches with extremely varied yield, associated with the spatial variability of soil, corroborating observations of Molin & Mascarin (2007), Molin et al. (2007), Oliveira et al. (2009), Dalchiavon et al. (2011), and Dalchiavon & Carvalho (2012), who mapped crop yield and concluded that the spatial variability in the maps was high.
For the regions with highest YLD (Figure 2b), direct similarities with the STD map were observed (Figure 2d), with values between 11.2 and 13.1 plant m-1, whereas in the Northwest region, as well as at some isolated points darker patches of the map, STD values were the lowest (8.6 - 10.5 plant m-1) and YLD smallest. Regarding BD2 (Figure 2f), the opposite trend was observed in the YLD map (Figure 2b), where regions with lower BD2 (1.530 - 1.579 kg dm-3) were related to higher YLD values. In contrast, regions with high BD2 (1.595 - 1.644 kg dm-3) were related to lower YLD. This comparison indicated the presence of compaction of the subsurface soil (0.20-0.40 m), suggesting that the soil should be decompacted to raise the sugarcane yield.
In the TR treatment, the highest £Yld (87.5 - 100.2 t ha-1) occurred in the directions North-West and South-Southeast (Figure 3b). In the other regions the £Yld was lower (71.0 - 83.5 t ha-1). For the larger regions Yld (Figure 3b) direct relationships with the £Std map were also observed (Figure 3d), which, in turn, was between 10.7 and 12.9 plant m-1, whereas in the other areas, £Std was lowest (7.9 - 10.0 plant m-1) and consequently £Yld as well.
In the cokriging for YLD = f(STD), YLD = f(BD2) and #Yld = f (# Std), the R2 values ranged from 0.871 to 0.327, and b of the cross-validations from 0.665 to 0.571 (Table 3, Figures 2 and 3). Therefore, the best fitting (TM), was the cokriging YLD = f(STD), with results comparable to Braga (2011). This cokriging fit a direct exponential semivariogram model (Table 3, Figure 2g), whose range of spatial dependence was 56.4 m and SDC high (67.0 %). Thus, it was found that the 84.5 % spatial variability of YLD was explained by the spatial variability of STD. Therefore, at locations where STD is 11.2 - 13.1 plant m-1, YLD will be expected to be 95.0 - 112.1 t ha-1 (Figure 2d,h). On the other hand, at sites where STD is 8.6 - 10.5 plant m-1, YLD will be 72.2 - 89.3 t ha-1.
For cokriging YLD = f(BD2), the inverse Gaussian semivariogram was adjusted (Table 3, Figure 2i), differing from the spherical model inverse observed by Montanari et al. (2012) who studied the dry matter yield of forage intercropping in relation to BD of an Oxisol (0.20-0.30 m layer). The cokriging mentioned indicated that in regions where BD2 increases, YLD will be reduced, the opposite also being true. The geostatistical range was 122.8 m with high SDC (76.7 %). Thus, in regions where BD2 is 1.595 - 1.644 kg dm-3, YLD will be 70.2 - 88.1 t ha-1 (Figure 2f,j). However, where BD2 is 1.530 - 1.579 kg dm-3, YLD will be 94.0 - 111.9 t ha-1.
To the TR treatment, the cokriging #Yld = f(#Std) with a direct spherical adjustment (Table 3, Figure 3e) had a range of 45.5 m and an average SDC (57.5 %), where 87.1 % of the spatial variability of #Yld was explained by spatial variability of #Std. Thus, in regions where #Std is 10.7 - 12.9 plant m-1, Yld will be 87.9 - 103.6 t ha-1 (Figure 3d,f), and where #Std is 7.9 - 10.0 plant m-1, Yld will be 67.0 - 82.7 t ha-1. Given the above, in order to increase the sugarcane yield (variety RB855035), Std should be more than 11 plant m-1 while BD (0.20-0.40 m) should be less than 1.579 kg dm-3.
CONCLUSIONS
1. In both treatments, stand density was the property with the best positive correlation with sugarcane yield. Of the soil properties, bulk density (0-0.20 m) had the highest positive correlation with yield;
2. Form the spatial point of view, stand density was the property that best explained the sugarcane yield. However, bulk density (0.20-0.40 m) in the trash mulching treatment was the only soil property spatially correlated with cane yield;
3. The maintenance of sugarcane trash on the soil surface increased the sugarcane yield and soil organic carbon, representing an important practice from the point of view of sustainable management and soil conservation.
ACKNOWLEDGEMENTS
The authors thank the Foundation for Research Support of the State of São Paulo (FAPESP) for providing a PhD scholarship to the first author, the sugar mill Usina Vale do Paraná S/A Álcool e Açúcar, for the support and opportunity to conduct this research and the Centro de Energia Nuclear na Agricultura for the assistance with the analyses of dry matter carbon.
LITERATURE CITED
ARSHAD, M.A.; LOWERY, B. & GROSSMAN, B. Physical tests for monitoring soil quality. In: DORAN, J.W. & JONES, A.J., eds. Methods for assessing soil quality. Madison, Soil Science Society of America, 1996. p.123-141 (SSSA Special publication, 49)
BENGOUGH, A.G.; CAMPBELL, D.J. & O’ SULLIVAN, M.F. Penetrometer techniques in relation to soil compaction and root growth. In: SMITH, K.A. & MULLINS, C.E., eds. Soil and environmental analysis: Physical methods. 2nd ed. New York, Marcel Dekker, 2001. p.377-403.
BRAGA, J.A. Inter-relações da produtividade de cana-de-açúcar com atributos físico-químicos de um Argissolo Vermelho eutrófico do noroeste Paulista. Ilha Solteira, Universidade Estadual Paulista, 2011. 87p. (Dissertação de Mestrado)
COMPANHIA NACIONAL DE ABASTECIMENTO - CONAB. Acompanhamento da safra brasileira: Cana-de-açúcar. Terceiro Levantamento, dezembro/2011. Brasília, 2011. 20p.
DALCHIAVON, F.C. Aspectos da produtividade do arroz de terras altas irrigado com atributos químicos do solo sob plantio direto. Ilha Solteira, Universidade Estadual Paulista, 2010. 113p. (Dissertação de Mestrado)
DALCHIAVON, F.C.; CARVALHO, M.P.; ANDREOTTI, M. & MONTANARI, R. Variabilidade espacial de atributos da fertilidade de um Latossolo Vermelho distroférrico sob Sistema Plantio Direto. R. Ci. Agron., 43:453-461, 2012.
DALCHIAVON, F.C. & CARVALHO, M.P. Correlação linear e espacial dos componentes de produção e produtividade da soja. Semina: Ci. Agron., 33:541-552, 2012.
DALCHIAVON, F.C.; CARVALHO, M.P.: NOGUEIRA, D.C.; ROMANO, D.; ABRANTES, F.L.; ASSIS, J.T. & OLIVEIRA, M.S. Produtividade da soja e resistência mecânica à penetração do solo sob sistema plantio direto no cerrado brasileiro. Pesq. Agropec. Trop., 41:8-19, 2011.
EMPRESA BRASILEIRA DE PESQUISA AGROPECUÁRIA - EMBRAPA. Sistema brasileiro de classificação de solos. 2.ed. Rio de Janeiro, 2006. 306p.
FERREIRA, D.F. SISVAR: Sistema de análise de variância para dados balanceados, versão 5.1 Build 72. Lavras, DEX/UFLA, 2007.
GIOIA, M.T. Produtividade e qualidade da cana soca correlacionadas com atributos físico-químicos de um Argissolo Vermelho distrófico do noroeste Paulista. Ilha Solteira, Universidade Estadual Paulista, 2011. 127p. (Dissertação de Mestrado)
GS+: Geostatistics for environmental sciences. 7.ed. Plainwell, Gamma Desing Software, 2004. 159p.
HILL, R.L.; HORTON, R. & CRUSE, M.R. Tillage effects on soil water retention and pore size distribution of two Mollisols. Soil Sci. Soc. Am. J., 49:1264-1270, 1985.
LUCA, E.F.; FELLER, C.; CERRI, C.C.; BARTHÈS, B.; CHAPLOT, V.; CAMPOS, D.C. & MANECHINI, C. Avaliação de atributos físicos e estoques de carbono e nitrogênio em solos com queima e sem queima de canavial. R. Bras. Ci. Solo, 32:789-800, 2008.
MENDONZA, H.N.S.; LIMA, E.; ANJOS, L.H.C.; SILVA, L.A.; CEDDIA, M.B. & ANTUNES, M.V.M. Propriedades químicas e biológicas de solo de tabuleiro cultivado com cana-de-açúcar com e sem queima da palhada. R. Bras. Ci. Solo, 24:201-207, 2000.
MOLIN, J.P. & MASCARIN, L.S. Colheita de citros e obtenção de dados para mapeamento da produtividade. Eng. Agríc., 27:259-266, 2007.
MOLIN, J.P.; VIEIRA JUNIOR, P.A.; DOURADO NETO, D.; FAULIN, G.C. & MASCARIN, L. Variação espacial na produtividade de milho safrinha devido aos macronutrientes e à população de plantas. R. Bras. Milho Sorgo, 6:309-324, 2007
MONTANARI, R.; CARVALHO, M.P.; ANDREOTTI, M.; DALCHIAVON, F.C.; LOVERA, L.H. & HONORATO, M.A.O. Aspectos da produtividade do feijão correlacionados com atributo físicos do solo sob elevado nível tecnológico de manejo. R. Bras. Ci. Solo, 34:1811-1822, 2010.
MONTANARI, R.; ZAMBIANCO, E.C.; CORRÊA, A.R.; PELLIN, D.M.P.; CARVALHO, M.P. & DALCHIAVON, F.C. Atributos físicos de um Latossolo Vermelho correlacionados linear e espacialmente com a consorciação de guandu com milheto. R. Ceres, 59:407-410, 2012.
NOVAIS FILHO, J.P.; SELVA, E.C.; COUTO, E.G.; LEHMANN, J.; JOHNSON, M.S. & RIHA, S. Distribuição espacial de carbono em solo sob floresta primária na Amazônia Meridional. R. Árvore, 31:83-92, 2007.
OLIVEIRA, P.C.G.; FARIAS, P.R.S.; LIMA; H.V.; FERNANDES, A.R.; OLIVEIRA, F.A. & PITA, J.D. Variabilidade espacial de propriedades químicas do solo e da produtividade de citros na Amazônia Oriental. R. Bras. Eng. Agríc. Amb., 13:708-715, 2009.
PACHECO, E.P. & CANTALICE, J.R.B. Compressibilidade, resistência à penetração e intervalo hídrico ótimo de um Argissolo Amarelo cultivado com cana-de-açúcar nos tabuleiros costeiros de Alagoas. R. Bras. Ci. Solo, 35:403-415, 2011.
REDE INTERUNIVERSITÁRIA PARA O DESENVOLVIMENTO DO SETOR SUCROALCOOLEIRO - RIDESA. Catálogo nacional de variedades "RB" de cana-de-açúcar. Curitiba, 2010. 136p.
REICHERT, J.M.; SUZUKI, L.E.A. & REINERT, D.J. Compactação do solo em sistemas agropecuários e florestais: Identificação, efeitos, limites críticos e mitigação. In: CERETTA, C.A.; SILVA, L.S. & REICHERT, J.M., eds. Tópicos em ciência do solo. Viçosa, MG, Sociedade Brasileira de Ciência do Solo, 2007. v.5. p.49-134.
SCHLOTZHAVER, S.D. & LITTELL, R.C. SAS system for elementary statistical analysis. 2.ed. Cary, 1997. 441p
SHAPIRO, S.S. & WILK, M.B. An analysis of variance test for normality: Complete samples. Biometrika, 52:591-611, 1965.
SOUZA, Z.M.; MARQUES JÚNIOR, J. & PEREIRA, G.T. Geoestatística e atributos do solo em áreas cultivadas com cana-de-açúcar. Ci. Rural, 40:48-56, 2010.
SOUZA, Z.M.; MARQUES JÚNIOR, J. & PEREIRA, G.T. Variabilidade espacial de atributos físicos do solo em diferentes formas do relevo sob cultivo de cana-de-açúcar. R. Bras. Ci. Solo, 28:937-944, 2004
SOUZA, Z.M.; CERRI, D.G.P.; MAGALHÃES, P.G. & CAMPOS, M.C.C. Correlação dos atributos físicos e químicos do solo com a produtividade de cana-de-açúcar. R. Biol. Ci. Terra, 8:183-190, 2008.
Received for publication on August 8, 2012 and approved on August 20, 2013.
- ARSHAD, M.A.; LOWERY, B. & GROSSMAN, B. Physical tests for monitoring soil quality. In: DORAN, J.W. & JONES, A.J., eds. Methods for assessing soil quality. Madison, Soil Science Society of America, 1996. p.123-141 (SSSA Special publication,
- BRAGA, J.A. Inter-relações da produtividade de cana-de-açúcar com atributos físico-químicos de um Argissolo Vermelho eutrófico do noroeste Paulista. Ilha Solteira, Universidade Estadual Paulista, 2011. 87p.
- COMPANHIA NACIONAL DE ABASTECIMENTO - CONAB. Acompanhamento da safra brasileira: Cana-de-açúcar. Terceiro Levantamento, dezembro/2011. Brasília, 2011. 20p.
- DALCHIAVON, F.C. Aspectos da produtividade do arroz de terras altas irrigado com atributos químicos do solo sob plantio direto. Ilha Solteira, Universidade Estadual Paulista, 2010. 113p.
- DALCHIAVON, F.C.; CARVALHO, M.P.; ANDREOTTI, M. & MONTANARI, R. Variabilidade espacial de atributos da fertilidade de um Latossolo Vermelho distroférrico sob Sistema Plantio Direto. R. Ci. Agron., 43:453-461, 2012.
- DALCHIAVON, F.C. & CARVALHO, M.P. Correlação linear e espacial dos componentes de produção e produtividade da soja. Semina: Ci. Agron., 33:541-552, 2012.
- DALCHIAVON, F.C.; CARVALHO, M.P.: NOGUEIRA, D.C.; ROMANO, D.; ABRANTES, F.L.; ASSIS, J.T. & OLIVEIRA, M.S. Produtividade da soja e resistência mecânica à penetração do solo sob sistema plantio direto no cerrado brasileiro. Pesq. Agropec. Trop., 41:8-19, 2011.
- EMPRESA BRASILEIRA DE PESQUISA AGROPECUÁRIA - EMBRAPA. Sistema brasileiro de classificação de solos. 2.ed. Rio de Janeiro, 2006. 306p.
- FERREIRA, D.F. SISVAR: Sistema de análise de variância para dados balanceados, versão 5.1 Build 72. Lavras, DEX/UFLA, 2007.
- GIOIA, M.T. Produtividade e qualidade da cana soca correlacionadas com atributos físico-químicos de um Argissolo Vermelho distrófico do noroeste Paulista. Ilha Solteira, Universidade Estadual Paulista, 2011. 127p.
- GS+: Geostatistics for environmental sciences. 7.ed. Plainwell, Gamma Desing Software, 2004. 159p.
- HILL, R.L.; HORTON, R. & CRUSE, M.R. Tillage effects on soil water retention and pore size distribution of two Mollisols. Soil Sci. Soc. Am. J., 49:1264-1270, 1985.
- LUCA, E.F.; FELLER, C.; CERRI, C.C.; BARTHÈS, B.; CHAPLOT, V.; CAMPOS, D.C. & MANECHINI, C. Avaliação de atributos físicos e estoques de carbono e nitrogênio em solos com queima e sem queima de canavial. R. Bras. Ci. Solo, 32:789-800, 2008.
- MENDONZA, H.N.S.; LIMA, E.; ANJOS, L.H.C.; SILVA, L.A.; CEDDIA, M.B. & ANTUNES, M.V.M. Propriedades químicas e biológicas de solo de tabuleiro cultivado com cana-de-açúcar com e sem queima da palhada. R. Bras. Ci. Solo, 24:201-207, 2000.
- MOLIN, J.P. & MASCARIN, L.S. Colheita de citros e obtenção de dados para mapeamento da produtividade. Eng. Agríc., 27:259-266, 2007.
- MOLIN, J.P.; VIEIRA JUNIOR, P.A.; DOURADO NETO, D.; FAULIN, G.C. & MASCARIN, L. Variação espacial na produtividade de milho safrinha devido aos macronutrientes e à população de plantas. R. Bras. Milho Sorgo, 6:309-324, 2007
- MONTANARI, R.; CARVALHO, M.P.; ANDREOTTI, M.; DALCHIAVON, F.C.; LOVERA, L.H. & HONORATO, M.A.O. Aspectos da produtividade do feijão correlacionados com atributo físicos do solo sob elevado nível tecnológico de manejo. R. Bras. Ci. Solo, 34:1811-1822, 2010.
- MONTANARI, R.; ZAMBIANCO, E.C.; CORRÊA, A.R.; PELLIN, D.M.P.; CARVALHO, M.P. & DALCHIAVON, F.C. Atributos físicos de um Latossolo Vermelho correlacionados linear e espacialmente com a consorciação de guandu com milheto. R. Ceres, 59:407-410, 2012.
- NOVAIS FILHO, J.P.; SELVA, E.C.; COUTO, E.G.; LEHMANN, J.; JOHNSON, M.S. & RIHA, S. Distribuição espacial de carbono em solo sob floresta primária na Amazônia Meridional. R. Árvore, 31:83-92, 2007.
- OLIVEIRA, P.C.G.; FARIAS, P.R.S.; LIMA; H.V.; FERNANDES, A.R.; OLIVEIRA, F.A. & PITA, J.D. Variabilidade espacial de propriedades químicas do solo e da produtividade de citros na Amazônia Oriental. R. Bras. Eng. Agríc. Amb., 13:708-715, 2009.
- PACHECO, E.P. & CANTALICE, J.R.B. Compressibilidade, resistência à penetração e intervalo hídrico ótimo de um Argissolo Amarelo cultivado com cana-de-açúcar nos tabuleiros costeiros de Alagoas. R. Bras. Ci. Solo, 35:403-415, 2011.
- REDE INTERUNIVERSITÁRIA PARA O DESENVOLVIMENTO DO SETOR SUCROALCOOLEIRO - RIDESA. Catálogo nacional de variedades "RB" de cana-de-açúcar. Curitiba, 2010. 136p.
- REICHERT, J.M.; SUZUKI, L.E.A. & REINERT, D.J. Compactação do solo em sistemas agropecuários e florestais: Identificação, efeitos, limites críticos e mitigação. In: CERETTA, C.A.; SILVA, L.S. & REICHERT, J.M., eds. Tópicos em ciência do solo. Viçosa, MG, Sociedade Brasileira de Ciência do Solo, 2007. v.5. p.49-134.
- SCHLOTZHAVER, S.D. & LITTELL, R.C. SAS system for elementary statistical analysis. 2.ed. Cary, 1997. 441p
- SHAPIRO, S.S. & WILK, M.B. An analysis of variance test for normality: Complete samples. Biometrika, 52:591-611, 1965.
- SOUZA, Z.M.; MARQUES JÚNIOR, J. & PEREIRA, G.T. Geoestatística e atributos do solo em áreas cultivadas com cana-de-açúcar. Ci. Rural, 40:48-56, 2010.
- SOUZA, Z.M.; MARQUES JÚNIOR, J. & PEREIRA, G.T. Variabilidade espacial de atributos físicos do solo em diferentes formas do relevo sob cultivo de cana-de-açúcar. R. Bras. Ci. Solo, 28:937-944, 2004
- SOUZA, Z.M.; CERRI, D.G.P.; MAGALHÃES, P.G. & CAMPOS, M.C.C. Correlação dos atributos físicos e químicos do solo com a produtividade de cana-de-açúcar. R. Biol. Ci. Terra, 8:183-190, 2008.
Publication Dates
-
Publication in this collection
06 Feb 2014 -
Date of issue
Dec 2013
History
-
Received
08 Aug 2012 -
Accepted
20 Aug 2013