
ABSTRACT
Reservoirs are the primary source of water supply in the semiarid region of Pernambuco state, Brazil, because of the constant water scarcity affecting this region. Knowledge of the amount of water available is essential for the effective management of water resources. The volume of water stored in the reservoirs is calculated using the depth-area-volume relationship. However, in most reservoirs in the semiarid region, this relationship is currently out of date. Therefore, the objective of this study was to explore the potential and limitations of the application of the ISODATA unsupervised classification method to calculate the depth-area-volume relationships of reservoirs in the semiarid region of Pernambuco, Brazil. The application of the ISODATA method was evaluated in three reservoirs in the state of Pernambuco, i.e., Poço da Cruz, Barra do Juá, and Jucazinho. The results were compared with the updated curves of reservoirs obtained from bathymetry and recent LiDAR surveys. The ISODATA method presented satisfactory results for the three reservoirs analyzed. The mean absolute error of the volume in Poço da Cruz and Barra do Juá was lower than 1% of the maximum capacity. The use of the ISODATA method meant that the surface area underestimation tendency in the Poço da Cruz reservoir was less than when spectral indices were used.
Key words:
ISODATA; remote sensing; water resources management; water supply
RESUMO
Os reservatórios são a principal fonte de abastecimento de água na região semiárida do Estado de Pernambuco, Brasil, devido à constante escassez de água que impacta essa região. O conhecimento da quantidade de água disponível é extremamente importante para uma gestão eficaz dos recursos hídricos. O cálculo do volume de água armazenado nos reservatórios é feito com as curvas cota-área-volume. Porém, na maioria dos reservatórios localizados no semiárido, essa relação está desatualizada. Nesse sentido, o objetivo deste estudo foi explorar o potencial e as limitações da aplicação do método ISODATA de classificação não supervisionada para calcular as relações cota-área-volume de reservatórios localizados na região semiárida do Estado de Pernambuco, Brasil. A aplicação do método ISODATA foi avaliada em três reservatórios no Estado de Pernambuco, Poço da Cruz, Barra do Juá e Jucazinho. Os resultados foram comparados com curvas atualizadas dos reservatórios obtidas recentemente a partir de levantamento batimétrico e técnica LiDAR. O método ISODATA apresentou resultados satisfatórios para os três reservatórios analisados. O erro médio absoluto do volume em Poço da Cruz e Barra do Juá foi inferior a 1% da capacidade máxima. A tendência de subestimação da área superficial diminuiu no reservatório de Poço da Cruz usando o método ISODATA em comparação com o uso de índices espectrais.
Palavras-chave:
ISODATA; sensoriamento remoto; gestão de recursos hídricos; suprimento de água
HIGHLIGHTS:
The unsupervised ISODATA method successfully estimated the water surface area of the reser-voirs.
The error of the estimated lake volume was comparable to other methods using satellite ima-gery.
Underestimation of the surface area was less than that obtained with a calculation based on spectral indices.
Introduction
The need for the construction of reservoirs in Northeast Brazil occurred because of the climate and geological characteristics of the region, which resulted in intermittent rivers and scarce groundwater (Malveira et al., 2012Malveira, V. T. C.; Araújo, J. C. de; Güntner, A. Hydrological impact of a high-density reservoir network in semiarid Northeastern Brazil. Journal of Hydrologic Engineering, v.17, p.109-117, 2012. https://doi.org/10.1061/(ASCE)HE.1943-5584.0000404
https://doi.org/10.1061/(ASCE)HE.1943-55...
; Toledo et al., 2014Toledo, C. E.; Araújo, J. C. de; Toledo, C. L. A. The use of remote-sensing techniques to monitor dense reservoir networks in the Brazilian semiarid region. International Journal of Remote Sensing , v.35, p.3683-3699, 2014. https://doi.org/10.1080/01431161.2014.915593
https://doi.org/10.1080/01431161.2014.91...
). To perform their role satisfactorily, reservoirs must be monitored as accurately as possible. This exercise is particularly important in semiarid regions, where reservoirs are the main source of water. Accurate information about volume storage in the reservoir is essential for proper water allocation (Nascimento & Ribeiro Neto, 2017Nascimento, V. F.; Ribeiro Neto, A. Characterization of reservoirs for water supply in Northeast Brazil using high resolution remote sensing. Revista Brasileira de Recursos Hídricos, v.22, p.1-9, 2017. https://doi.org/10.1590/2318-0331.0217170060
https://doi.org/10.1590/2318-0331.021717...
).
Such data are calculated with curves that relate water level to surface area and storage volume, also called the depth-area-volume relationship, and, in Portuguese, “cota-area-volume” (CAV). Despite federal institutions’ efforts to update bathymetries, water resource management institutions still use data from the time of construction of the reservoirs (Collischon & Clarke, 2016Collischonn, B.; Clarke, R. T. Estimation and uncertainty of remote-sensing-based Depth-Area-Volume (DAV) relationships. Brazilian Journal of Water Resources, v.22, p.719-727, 2016. https://doi.org/10.1590/2318-0331.011616022
https://doi.org/10.1590/2318-0331.011616...
).
Remote sensing products can be used to calculate depth-area-volume curves and reduce the cost of topo-bathymetric surveys. Satellite images are able to detect water bodies and, using spectral indices and classification algorithms, calculate their extent. The extent of water can also be useful for characterizing the geometry of lakes in combination with satellite altimetry (Arsen et al., 2014Arsen, A.; Crétaux, J. F.; Berge-Nguyen, M.; Del Rio, R. A. Remote sensing-derived bathymetry of Lake Poopó. Remote Sensing, v.6, p.407-420, 2014. https://doi.org/10.3390/rs6010407
https://doi.org/10.3390/rs6010407...
; Baup et al., 2014Baup, F.; Frappart, F.; Maubant, J. Combining high-resolution satellite images and altimetry to estimate the volume of small lakes. Hydrology and Earth System Sciences, v.18, p.2007-2020, 2014. https://doi.org/10.5194/hess-18-2007-2014
https://doi.org/10.5194/hess-18-2007-201...
) and in situ water levels (Collischon & Clarke, 2016Collischonn, B.; Clarke, R. T. Estimation and uncertainty of remote-sensing-based Depth-Area-Volume (DAV) relationships. Brazilian Journal of Water Resources, v.22, p.719-727, 2016. https://doi.org/10.1590/2318-0331.011616022
https://doi.org/10.1590/2318-0331.011616...
). Other approaches have been tested in Northeast Brazil using a combination of satellite imagery and field surveys (Lopes & Araújo, 2019Lopes, J. W. B.; Araújo, J. C. de. Simplified method for the assessment of siltation in semiarid reservoirs using satellite imagery. Water, v.11, p.1-18, 2019. https://doi.org/10.3390/w11050998
https://doi.org/10.3390/w11050998...
), digital elevation models derived from synthetic aperture radar (SAR) images (Zhang et al., 2016Zhang, S.; Foerster, S.; Medeiros, P.; Araújo, J. C. de; Motagh, M.; Waske, B. Bathymetric survey of water reservoirs in north-eastern Brazil based on TanDEM-X satellite data. Science of the Total Environment, v.571, p.575-593, 2016. https://doi.org/10.1016/j.scitotenv.2016.07.024
https://doi.org/10.1016/j.scitotenv.2016...
), and supervised classification of maximum likelihood (Toledo et al., 2014Toledo, C. E.; Araújo, J. C. de; Toledo, C. L. A. The use of remote-sensing techniques to monitor dense reservoir networks in the Brazilian semiarid region. International Journal of Remote Sensing , v.35, p.3683-3699, 2014. https://doi.org/10.1080/01431161.2014.915593
https://doi.org/10.1080/01431161.2014.91...
).
The objective of this study was to explore the potential and limitations of the application of the ISODATA unsupervised classification method to calculate depth-area-volume relationships of reservoirs in the semiarid region of Pernambuco state, Brazil.
Material and Methods
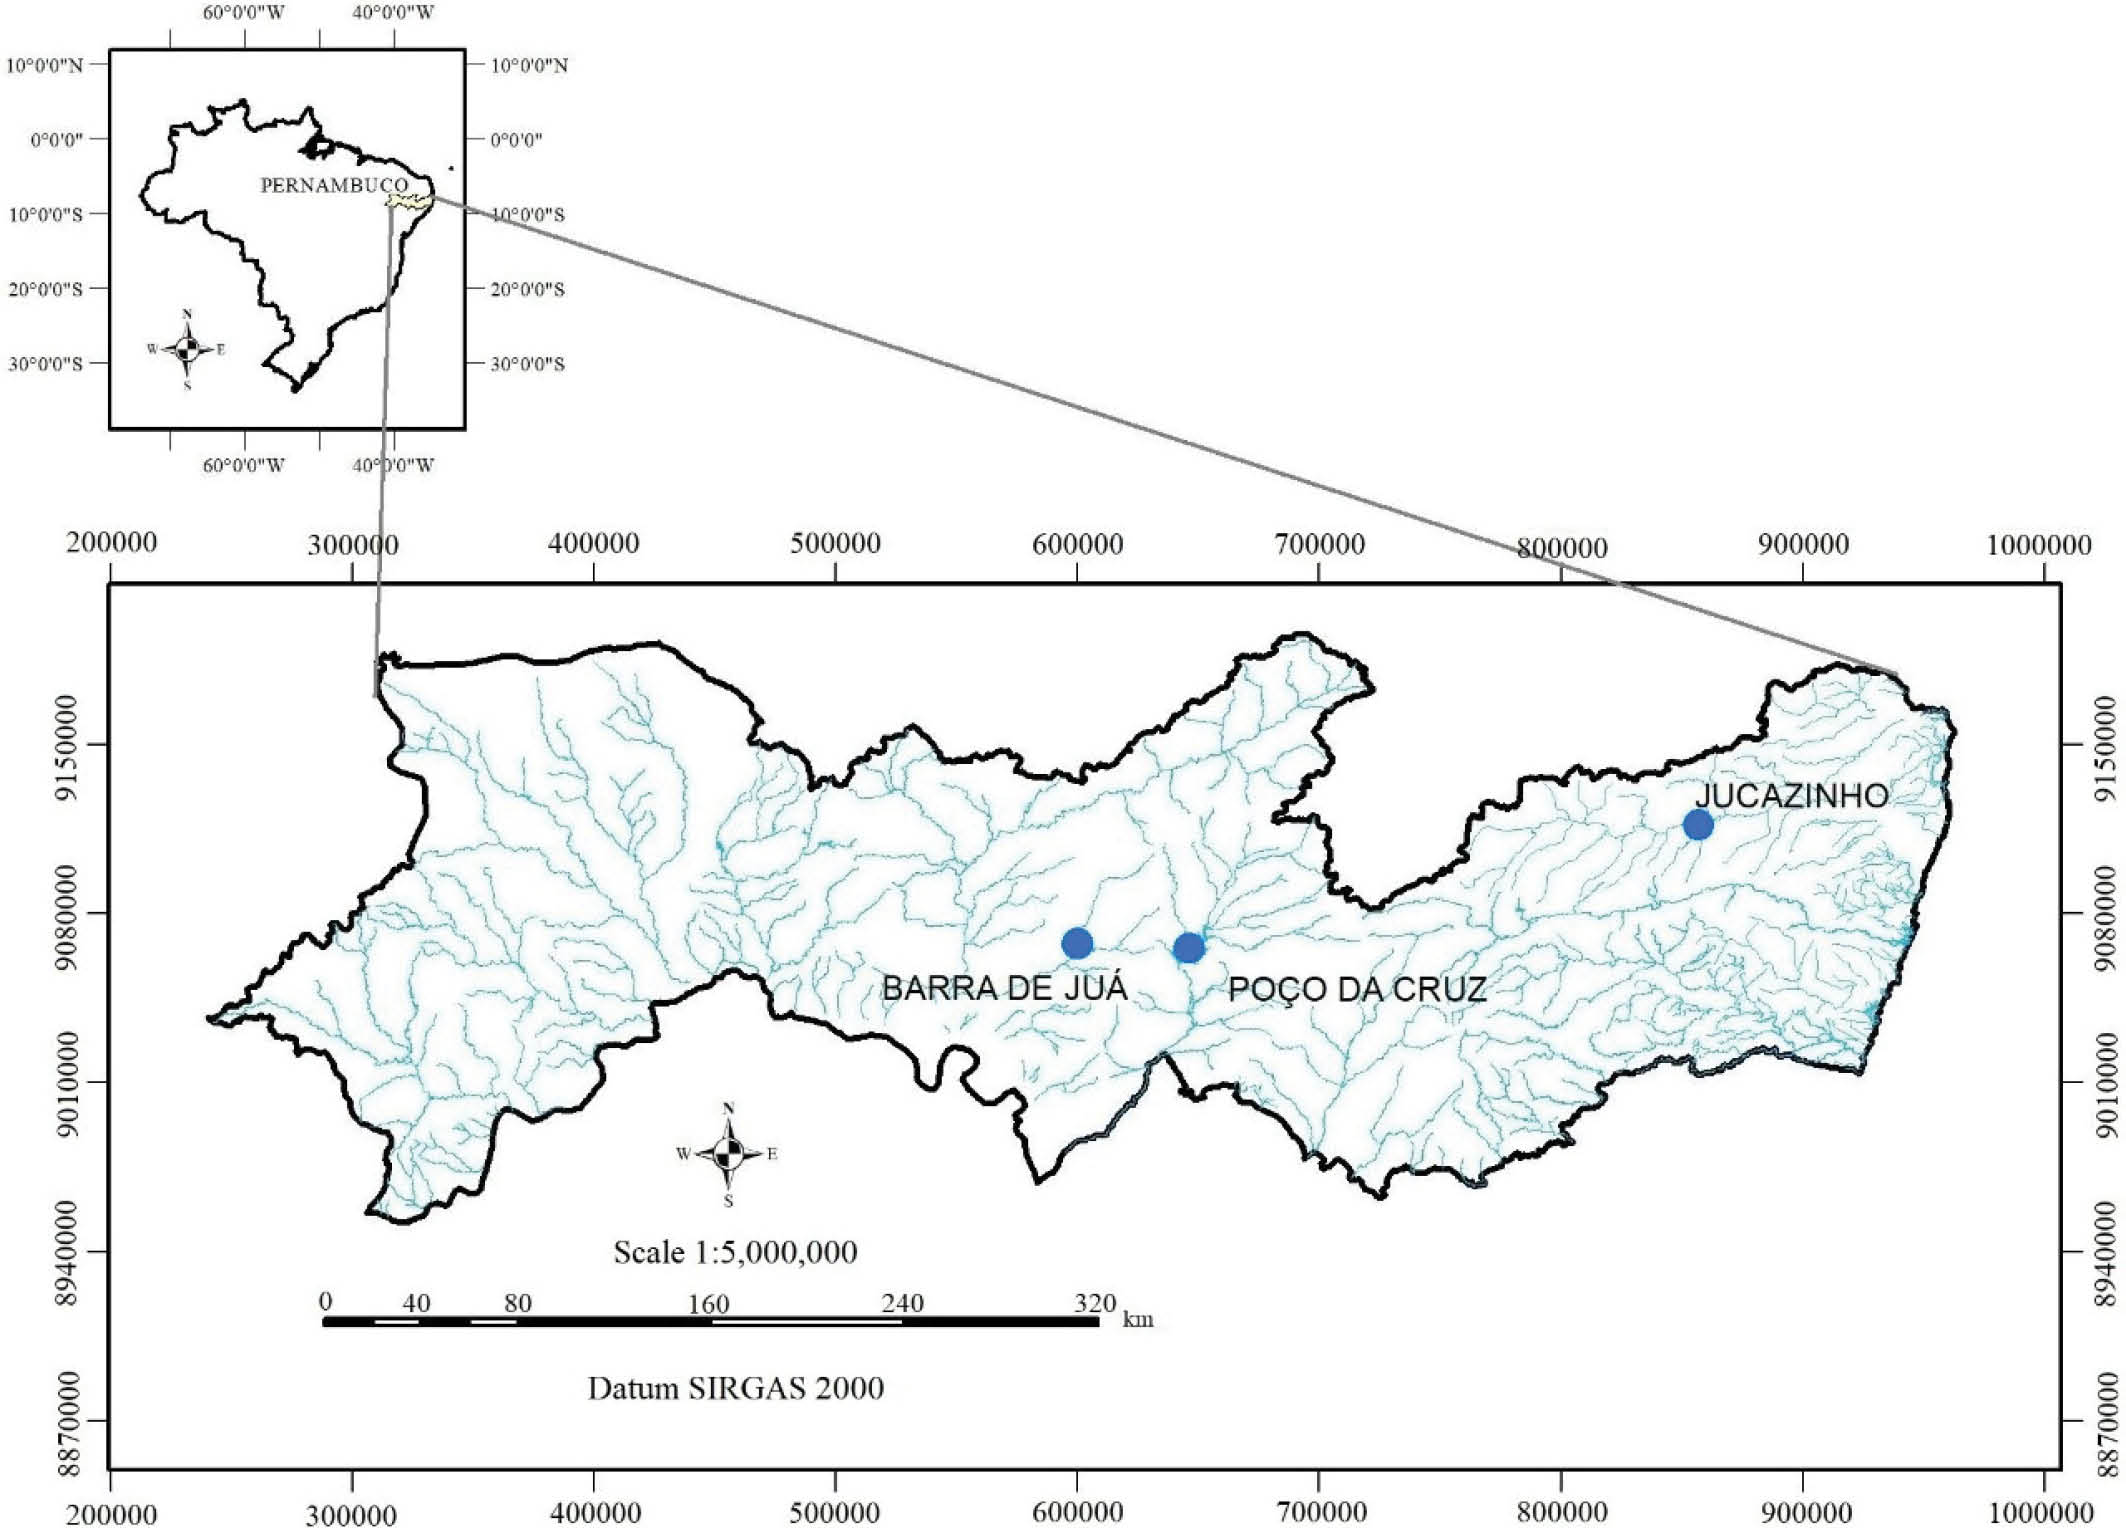
Three reservoirs were selected to apply the method of image classification and calculation of the CAV. Poço da Cruz (Moxotó River), Jucazinho (Capibaribe River), and Barra do Juá (Riacho do Navio) are located in the state of Pernambuco, Northeast Brazil (Figure 1). All of them are in a semiarid region, where the temperature varies between 20.1 and 29.9 °C (Jucazinho), 23.2 and 28.6 °C (Poço da Cruz and Barra do Juá), the annual precipitation is between 450 and 600 mm, and annual total evaporation greater than 1600 mm. These values were obtained from stations at the National Institute of Meteorology (INMET) and the National Water Agency (ANA).

Location of the reservoirs Poço da Cruz, Jucazinho, and Barra do Juá in the state of Pernambuco, Brazil
The main characteristics of these reservoirs are listed in Table 1. The drainage area and precipitation were obtained from the ANA’s National Water Resources Information System. The rain gauges were Surubim (735158), Inajá (837038), and Floresta (838021). Total evaporation was obtained from the INMET weather stations Floresta (82887) and Surubim (82797). The precipitation and total evaporation information for each reservoir correspond to the values of the nearest station. The maximum surface area and capacity were obtained from CAVs.
To calculate the depth-area-volume curves, in situ (bathymetry and water level) and remote sensing (satellite image and LiDAR products) data were required, as described in detail below.
An important step in water-extent determination is the validation of the results obtained using satellite imagery. In this study, the surface area and volume were compared to CAVs generated using a digital terrain model (DTM) calculated from bathymetric and LiDAR surveys. The DTM, which represents the topography of the Poço da Cruz and Jucazinho reservoirs, was generated after the integration of the aerophotogrammetric survey of the non-water part, and the bathymetric survey of the inundated area carried out by the Agência Nacional de Águas (here called DTMANA).
The survey was supported by the implantation of geodetic networks of altimetric and planimetric references connected to the Brazilian Geodetic System (SGB), and the LiDAR technique was used for the non-water terrain survey. The final result had a density of 2 points m2 in a 3D representation with the planimetric and altimetric references, defined as SIRGAS2000/UTM and the reference ellipsoid GRS80, respectively. The bathymetry was accomplished with an echosounder using a single beam for shallow water and a multibeam for deep water. The coordinate information of the altimetric and planimetric geodetic networks was used in the unification of LiDAR plus bathymetry reference systems.
Three-Dimensional Pernambuco (PE3D) was a project of the Government of Pernambuco state, which resulted in a database of DTM and orthophotos of high-resolution using LiDAR technique (here called DTMPE3D). The survey was carried out between March 2014 and December 2016, and the final product had the following characteristics: a scale of 1:5000, a spatial resolution of 1 m, and an altimetric accuracy of 25 cm, covering the entire territory of the state (Nascimento & Ribeiro Neto, 2017Nascimento, V. F.; Ribeiro Neto, A. Characterization of reservoirs for water supply in Northeast Brazil using high resolution remote sensing. Revista Brasileira de Recursos Hídricos, v.22, p.1-9, 2017. https://doi.org/10.1590/2318-0331.0217170060
https://doi.org/10.1590/2318-0331.021717...
). The PE3D is another data source for calculating the bathymetry and CAVs of reservoirs in Pernambuco state. This is possible in cases where the reservoir was empty on the date of the measurement, as demonstrated by Nascimento & Ribeiro Neto (2017). The Barra do Juá reservoir is one of these cases, allowing the updating of its bathymetry.
The water level in the reservoirs was monitored daily by the Agência Pernambucana de Água e Clima (APAC). The altimetric reference of the stations was obtained based on DTMANA and DTMPE3D.
The selection of the images was based on the following criteria: representation of the range of water levels observed in the reservoirs, cloud-free images, period covering approximately 15 years, and availability of in situ water level on the day of the satellite pass. Images from Landsat-5 and -8 were selected and downloaded using the Google Earth Engine (Gorelick et al., 2017Gorelick, N.; Hancher, M.; Dixon, M.; Ilyushchenko, S.; Thaub, D.; Moore, R. Google Earth Engine: Planetary-scale geospatial analysis for everyone. Remote Sensing of Environment, v.202, p.18-27, 2017. https://doi.org/10.1016/j.rse.2017.06.031
https://doi.org/10.1016/j.rse.2017.06.03...
). The process was carried out using JavaScript language with a cloud cover criterion of less than 10% and a mask of the reservoirs.
The images were obtained from the collection Tier 1 TOA reflectance because corrections had been applied to these images (Li et al., 2013Li, W.; Du, Z.; Ling, F.; Zhou, D.; Wang, H.; Gui, Y.; Sun, B.; Zhang, X. A comparison of land surface water mapping using the normalized difference water index from TM, ETM+ and ALI. Remote Sensing , v.5, p.5530-5549, 2013. https://doi.org/10.3390/rs5115530
https://doi.org/10.3390/rs5115530...
). The CAV curves were calculated using 31 images from Poço da Cruz (13 Landsat-5 and 18 Landsat-8), 17 images from Barra do Juá (6 Landsat-5 and 11 Landsat-8), and four images from Jucazinho (two Landsat-5 and two Landsat-8). The small number of images for the Jucazinho reservoir was due to the high cloud incidence in the region.
ISODATA applies the concept of minimum distance to classify the images based on the spectral signatures of the pixel and the average of the class, associating the pixel with the class with the lowest spectral difference (Memarsadeghi et al., 2007Memarsadeghi, N.; Mount, D.; Netanyahu, N.; Le Moigne, J. A fast implementation of the ISODATA clustering algorithm. International Journal of Computational Geometry & Applications. v.17, p.71-103, 2007. https://doi.org/10.1142/S0218195907002252
https://doi.org/10.1142/S021819590700225...
). First, the method defines a vector of arbitrary classes with N centers of spectral averages and assigns each pixel to the class with the nearest spectral average. After allocating all the pixels, a new spectral average is generated for the classes, and then the pixels are reallocated again in the classes with the nearest spectral average. This process is repeated iteratively until the allocation converges. This unsupervised method was chosen to overcome the problem associated with the definition of threshold values in applications using water indices.
An RGB composition was created with bands 2, 4, and 5 from Landsat-5 and bands 3, 5, and 6 from Landsat-8. In both satellites, these bands correspond to green, near-infrared, and shortwave infrared, respectively. They are the same bands as those used in the Normalized Difference Water Index (NDWI) and the Modified NDWI (MNDWI) and have good performance in distinguishing the presence of water.
The System for Automated Geoscientific Analysis (SAGA) was used to apply the ISODATA method. The input parameters were: i) the maximum number of iterations, ii) the initial number of classes, iii) the maximum number of classes, and iv) the minimum number of pixels in one class. The centers of the initial classes were defined randomly using the value of parameter ii. Then, the image was classified for the first time, and later the classes with the number of pixels lower than the parameter iv were removed (added to other classes), adjusting the number of classes limited by the maximum value adopted in parameter iii. In addition, during the process, classes with spectral proximity between them could be merged into one class.
The definition of the parameters followed the standard values suggested by the SAGA (the modification of these values did not significantly alter the classification). The values are 20 for the maximum number of iterations, 16 for the maximum number of classes, and five for the minimum number of pixels in a class. The initial number of classes was the most sensitive parameter, directly influencing the final number of classes. The values were determined for each classification, always aiming at the greatest number of classes possible. The greater the number of classes, the easier it is to aggregate pixels in homogeneous groups because ISODATA classifies all pixels of the image.
To calculate the surface area, power-law regression was used with the auxiliary parameter h0 (Eq. 1), applied to several reservoirs in the Northeast (Collischonn & Clarke, 2016Collischonn, B.; Clarke, R. T. Estimation and uncertainty of remote-sensing-based Depth-Area-Volume (DAV) relationships. Brazilian Journal of Water Resources, v.22, p.719-727, 2016. https://doi.org/10.1590/2318-0331.011616022
https://doi.org/10.1590/2318-0331.011616...
).
where:
A - surface area;
h - water level;
h0 - auxiliary parameter; and,
a, b - coefficients of the power law.
The incremental volume between two consecutive images was calculated as a truncated pyramid (Abileah et al., 2011Abileah, R.; Vignudelli, S.; Scozzari, A. A completely remote sensing approach to monitoring reservoirs water volume. Fifteenth International Water Technology Conference, v.1, p.63-77, 2011.).
where:
Vn+1 - incremental volume between surface areas An+1 and An; and,
hn+1 and hn - water level corresponding to the surface areas An+1 and An.
The total volume is calculated by summing the successive values of ∆V based on Eq. 2:
where:
Vn+1 - cumulative volume between water level n+1 and the bottom of the reservoir; and,
Vn - cumulative volume between the water level n and the bottom of the reservoir.
The depth-area-volume relationship calculated after applying Eqs. 1 and 2, based on satellite imagery, is called CAVSI. The CAVs calculated with DTMANA and DTMPE3D are the reference for comparison and are referred to as CAVREF. The surface area and volume of both CAVs were assessed using the mean absolute error (MAE), as shown in Eq. 4:
where:
i - elements of the CAV;
n - number of elements of the CAV;
E - area or volume estimated using the CAVSI; and,
M - area or volume measured using the CAVREF.
The flowchart presented in Figure 2 summarizes the methodology.

Results and Discussion
Figure 3 presents the steps of the classification process for a Landsat-5 image in the Barra do Juá reservoir. The color composition with bands 4, 5, and 2 for the Landsat-5 image (Figure 3A) was used in the ISODATA classification method (Figure 3B). The pixels representing water were grouped into two classes (Figure 3C), which were aggregated to represent the class water (Figure 3D).

Color composition with the bands 4, 5 and 2 for Landsat-5 image (A), classes identified after application of the ISODATA method (B), two classes identified as water (C) and class water after aggregation to calculate the water extent (D)
The value of the pixels is sensitive to water depth, amount of chlorophyll, and suspended solids in water, which influences the classification, especially in composition with bands from the near-infrared (Elmi, 2019Elmi, O. Dynamic water masks from optical satellite imagery. Stuttgart: University of Stuttgart, 2019. 183p. Doctoral Thesis). Because of this interference, the pixels of water can be erroneously classified as non-water, affecting the surface area estimate. For this reason, more than one class was classified as water, which was later grouped into one class.
Figure 4A presents the relationship between water level and surface area, and water level and stored volume (Figure 4B) in the Poço da Cruz reservoir (CAVREF calculated with DTMANA and CAVSI). As can be seen in Figures 4A and B, the interval between 425 and 430 m has no information on the volume calculated with the image. This situation occurred because of the lack of water level data. Nevertheless, the number of values obtained from the images was sufficient to establish the depth-area-volume relationship.

Depth-area (A) and depth-volume (B) curves from bathymetry and satellite imageries in the Poço da Cruz reservoir
The comparison of the surface area calculated with satellite images and given by the CAVREF showed a trend of underestimation, especially at high water levels (Figure 4A). At the maximum water level of 435.00 m, the underestimate was 3.98% (56.34 km2 for CAVREF and 54.09 km2 for CAVSI). When the volume was calculated using Eqs. 2 and 3, there was an attenuation of the underestimation. For the maximum water level, the accumulated volume estimated with the images was 3.08% lower (483.72 hm3 for the CAVREF and 468.82 hm3 for the CAVSI).
There was a different pattern in the area estimated at low and high water levels. Until 420.00 m, the area was overestimated, while above this level, the volume was underestimated. This is consistent with other studies, such as Collischonn & Clarke (2016Collischonn, B.; Clarke, R. T. Estimation and uncertainty of remote-sensing-based Depth-Area-Volume (DAV) relationships. Brazilian Journal of Water Resources, v.22, p.719-727, 2016. https://doi.org/10.1590/2318-0331.011616022
https://doi.org/10.1590/2318-0331.011616...
), who attribute this characteristic to the spatial resolution of the images. As the water extent decreases, the error increases. The mean absolute error was 0.84 km2 for the surface area and 4.52 hm3 for the volume.
The CAVREF for comparison with CAVSI in Barra do Juá was obtained using DTMPE3D. The altimetric reference of the in-situ station is different from the altimetric reference of the DTMPE3D. The technical information of the dam informs the elevation of the spillway, which can also be identified on the DTMPE3D. The difference between these elevations is the factor that must be added to the water level measurement at the station to have the same reference as the DTMPE3D. The depth-area-volume relationships are shown in Figures 5A and B.

Depth-area (A) and depth-volume (B) curves from the PE3D’s Digital Terrain Model (DTMPE3D) and satellite imageries in the Barra do Juá reservoir
Few images were available during the drought 2012-2017, especially in the first years of this period. In just one image during low water (November 10, 2017), there was also water level measurement. The variation of the water level was between 395.05 and 403.53 m. The differences in the maximum water level (405.3 m) were 13.64% for the surface area (13.96 km2 for the CAVREF and 12.06 km2 for the CAVSI) and 3.44% for the volume (59.52 hm3 for the CAVREF and 57.47 hm3 for the CAVSI). The MAE was 0.39 km2 for the surface area and 0.43 hm3 for the volume.
Figures 4 and 5 show the values of the coefficients in Eq. 1, the coefficient of determination, and the 95% confidence intervals for the depth-volume curves (CAVREF and CAVSI). The application of the Student’s t-test with the samples of volume (CAVSI and CAVREF) showed that the null hypothesis could not be rejected (H0: µ1 - µ2 = 0) in both reservoirs.
Despite the small number of images, the result in the Jucazinho reservoir covered 80% of its capacity (from 14.90 to 178.57 hm3 in the CAVREF). Four pairs of values are not enough to establish a depth-area-volume relationship but could be useful to test the ISODATA method for the water extent calculation. For this reason, it is not presented in Figure 6 the coefficients of Eq. 1, and confidence intervals.

Depth-area curve from the ANA’s Digital Terrain Model (DTMANA) and satellite imageries in the Jucazinho reservoir
Like the other reservoirs analyzed, the surface area calculated with the satellite images was underestimated. The four processed surface areas had values lower than the CAVREF, which confirms the results obtained in Poço da Cruz and Barra do Juá. The MAE calculated for the surface area was 0.13 km2.
There are two main difficulties with the application of images to achieve the objectives of this study. The period between the oldest and newest images cannot be too long. Reservoirs are susceptible to sedimentation over time, which alters their geometry and CAVs. Ideally, the period should not be longer than 15 years. In addition, the presence of clouds in the images can affect classification (also mentioned in Toledo et al., 2014Toledo, C. E.; Araújo, J. C. de; Toledo, C. L. A. The use of remote-sensing techniques to monitor dense reservoir networks in the Brazilian semiarid region. International Journal of Remote Sensing , v.35, p.3683-3699, 2014. https://doi.org/10.1080/01431161.2014.915593
https://doi.org/10.1080/01431161.2014.91...
). This requirement can affect the use of optical images near the coast, where the presence of clouds is almost constant.
In addition to remote sensing products, water level data are indispensable for the calculation of CAVs. Despite advances in technology for monitoring and improving investments, there are still long periods for which water level data is missing. Sometimes, there is an image of good quality, but it is not possible to use it because there is no information on the water level.
On the other hand, the results encourage the application of the ISODATA method for the calculation of CAVs in other reservoirs in the Northeast semiarid region. Unsupervised methods such as ISODATA do not need to determine the threshold to classify water, as verified in applications using spectral indices (NDVI, NDWI, MNDWI, among others) (Arsen et al., 2014Arsen, A.; Crétaux, J. F.; Berge-Nguyen, M.; Del Rio, R. A. Remote sensing-derived bathymetry of Lake Poopó. Remote Sensing, v.6, p.407-420, 2014. https://doi.org/10.3390/rs6010407
https://doi.org/10.3390/rs6010407...
, Feyisa et al., 2014Feyisa, G. L.; Meilby, H.; Fensholt, R.; Proud, S. R. Automated Water Extraction Index: A new technique for surface water mapping using Landsat imagery. Remote Sensing of Environment, v.140, p.23-35, 2014. https://doi.org/10.1016/j.rse.2013.08.029
https://doi.org/10.1016/j.rse.2013.08.02...
, Schwatke et al., 2019Schwatke, C.; Scherer, D.; Dettmering, D. Automated extraction of consistent time-variable water surfaces of lakes and reservoirs based on Landsat and Sentinel-2. Remote Sensing . v.11, p.1-35, 2019. https://doi.org/10.3390/rs11091010
https://doi.org/10.3390/rs11091010...
). The results obtained with the ISODATA in the Poço da Cruz reservoir, for example, were better than the application of NDWI carried out by Costa (2019Costa, F. A. da. Sensoriamento Remoto Aplicado ao Monitoramento de Reservatório no Semiárido do Nordeste: Poço da Cruz (Pernambuco). Recife: UFPE, 2019. 109p. Dissertação Mestrado) and had a reduced tendency to underestimate the surface area. The underestimation tendency was also observed in the calculation of a simplified bathymetry using satellite imagery in the Pentecoste reservoir (state of Ceará) (Lopes & Araújo, 2019Lopes, J. W. B.; Araújo, J. C. de. Simplified method for the assessment of siltation in semiarid reservoirs using satellite imagery. Water, v.11, p.1-18, 2019. https://doi.org/10.3390/w11050998
https://doi.org/10.3390/w11050998...
). This topic should be investigated in more detail to minimize the effects of the underestimation of the surface area calculation.
High-resolution DTMs can be considered an accurate source of data for use as a reference in validating image-based methods. In this study, the DTMPE3D from Nascimento & Ribeiro Neto (2017Nascimento, V. F.; Ribeiro Neto, A. Characterization of reservoirs for water supply in Northeast Brazil using high resolution remote sensing. Revista Brasileira de Recursos Hídricos, v.22, p.1-9, 2017. https://doi.org/10.1590/2318-0331.0217170060
https://doi.org/10.1590/2318-0331.021717...
) proved to be useful for validation of the results in the Barra do Juá reservoir. The DTM obtained using TanDEM-X (Zhang et al., 2016Zhang, S.; Foerster, S.; Medeiros, P.; Araújo, J. C. de; Motagh, M.; Waske, B. Bathymetric survey of water reservoirs in north-eastern Brazil based on TanDEM-X satellite data. Science of the Total Environment, v.571, p.575-593, 2016. https://doi.org/10.1016/j.scitotenv.2016.07.024
https://doi.org/10.1016/j.scitotenv.2016...
) can also be considered for this purpose.
The CAVREF for Poço da Cruz and Barra do Juá remained within the 95% confidence interval of the CAVSI. The same result was achieved by Collischonn & Clarke (2016Collischonn, B.; Clarke, R. T. Estimation and uncertainty of remote-sensing-based Depth-Area-Volume (DAV) relationships. Brazilian Journal of Water Resources, v.22, p.719-727, 2016. https://doi.org/10.1590/2318-0331.011616022
https://doi.org/10.1590/2318-0331.011616...
) in the Boqueirão reservoir, State of Paraíba, Brazil. The volume error was comparable to other studies that estimated the lake volume using satellite images, as reported by Baup et al. (2014Baup, F.; Frappart, F.; Maubant, J. Combining high-resolution satellite images and altimetry to estimate the volume of small lakes. Hydrology and Earth System Sciences, v.18, p.2007-2020, 2014. https://doi.org/10.5194/hess-18-2007-2014
https://doi.org/10.5194/hess-18-2007-201...
) (error of 7.4%) and Asfaw et al. (2020Asfaw, W.; Haile, A.T; Rientjes, T. Combining multisource satellite data to estimate storage variation of a lake in the Rift Valley Basin, Ethiopia. International Journal of Applied Earth Observation Geoinformation, v.89, p.1-13, 2020. https://doi.org/10.1016/j.jag.2020.102095
https://doi.org/10.1016/j.jag.2020.10209...
) (error of 2.9%). The mean absolute error of volume was 0.94 and 0.71% of the maximum capacity in Poço da Cruz and Barra do Juá, respectively. It is recommended that the ISODATA method should be applied to small reservoirs (Pereira et al., 2019Pereira, B.; Medeiros, P.; Francke, T.; Ramalho, G.; Foerster, S.; Araújo, J. C. de. Assessment of the geometry and volumes of small surface water reservoirs by remote sensing in a semi-arid region with high reservoir density. Hydrological Sciences Journal, v.64, p.66-79, 2019. https://doi.org/10.1080/02626667.2019.1566727
https://doi.org/10.1080/02626667.2019.15...
) and macrophyte-covered reservoirs (Zhang et al., 2018Zhang, S.; Foerster, S.; Medeiros, P.; Araújo, J. C. de; Waske, B. Effective water surface mapping in macrophyte-covered reservoirs in NE Brazil based on TerraSAR-X time series. International Journal of Applied Earth Observation Geoinformation , v.69, p.41-45, 2018. https://doi.org/10.1016/j.jag.2018.02.014
https://doi.org/10.1016/j.jag.2018.02.01...
) to test it under different conditions in the Northeast semiarid region.
Conclusions
-
The ISODATA method presented satisfactory results for the three reservoirs analyzed. The mean absolute error of volume in Poço da Cruz and Barra do Juá was lower than 1% of the maximum capacity.
-
The ISODATA method had a decreased tendency to underestimate the surface area in the Poço da Cruz reservoir compared to the use of spectral indices.
Acknowledgments
This paper is a contribution of the Brazilian Network on Global Climate Change Research (Rede CLIMA) and the Universidade Federal de Pernambuco (grant Propesqi nº 07/2020). The Fundação de Amparo à Ciência e Tecnologia do Estado de Pernambuco (FACEPE) granted a scholarship for the first author.
Literature Cited
- Abileah, R.; Vignudelli, S.; Scozzari, A. A completely remote sensing approach to monitoring reservoirs water volume. Fifteenth International Water Technology Conference, v.1, p.63-77, 2011.
- Arsen, A.; Crétaux, J. F.; Berge-Nguyen, M.; Del Rio, R. A. Remote sensing-derived bathymetry of Lake Poopó. Remote Sensing, v.6, p.407-420, 2014. https://doi.org/10.3390/rs6010407
» https://doi.org/10.3390/rs6010407 - Asfaw, W.; Haile, A.T; Rientjes, T. Combining multisource satellite data to estimate storage variation of a lake in the Rift Valley Basin, Ethiopia. International Journal of Applied Earth Observation Geoinformation, v.89, p.1-13, 2020. https://doi.org/10.1016/j.jag.2020.102095
» https://doi.org/10.1016/j.jag.2020.102095 - Baup, F.; Frappart, F.; Maubant, J. Combining high-resolution satellite images and altimetry to estimate the volume of small lakes. Hydrology and Earth System Sciences, v.18, p.2007-2020, 2014. https://doi.org/10.5194/hess-18-2007-2014
» https://doi.org/10.5194/hess-18-2007-2014 - Collischonn, B.; Clarke, R. T. Estimation and uncertainty of remote-sensing-based Depth-Area-Volume (DAV) relationships. Brazilian Journal of Water Resources, v.22, p.719-727, 2016. https://doi.org/10.1590/2318-0331.011616022
» https://doi.org/10.1590/2318-0331.011616022 - Costa, F. A. da. Sensoriamento Remoto Aplicado ao Monitoramento de Reservatório no Semiárido do Nordeste: Poço da Cruz (Pernambuco). Recife: UFPE, 2019. 109p. Dissertação Mestrado
- Elmi, O. Dynamic water masks from optical satellite imagery. Stuttgart: University of Stuttgart, 2019. 183p. Doctoral Thesis
- Feyisa, G. L.; Meilby, H.; Fensholt, R.; Proud, S. R. Automated Water Extraction Index: A new technique for surface water mapping using Landsat imagery. Remote Sensing of Environment, v.140, p.23-35, 2014. https://doi.org/10.1016/j.rse.2013.08.029
» https://doi.org/10.1016/j.rse.2013.08.029 - Gorelick, N.; Hancher, M.; Dixon, M.; Ilyushchenko, S.; Thaub, D.; Moore, R. Google Earth Engine: Planetary-scale geospatial analysis for everyone. Remote Sensing of Environment, v.202, p.18-27, 2017. https://doi.org/10.1016/j.rse.2017.06.031
» https://doi.org/10.1016/j.rse.2017.06.031 - Li, W.; Du, Z.; Ling, F.; Zhou, D.; Wang, H.; Gui, Y.; Sun, B.; Zhang, X. A comparison of land surface water mapping using the normalized difference water index from TM, ETM+ and ALI. Remote Sensing , v.5, p.5530-5549, 2013. https://doi.org/10.3390/rs5115530
» https://doi.org/10.3390/rs5115530 - Lopes, J. W. B.; Araújo, J. C. de. Simplified method for the assessment of siltation in semiarid reservoirs using satellite imagery. Water, v.11, p.1-18, 2019. https://doi.org/10.3390/w11050998
» https://doi.org/10.3390/w11050998 - Malveira, V. T. C.; Araújo, J. C. de; Güntner, A. Hydrological impact of a high-density reservoir network in semiarid Northeastern Brazil. Journal of Hydrologic Engineering, v.17, p.109-117, 2012. https://doi.org/10.1061/(ASCE)HE.1943-5584.0000404
» https://doi.org/10.1061/(ASCE)HE.1943-5584.0000404 - Memarsadeghi, N.; Mount, D.; Netanyahu, N.; Le Moigne, J. A fast implementation of the ISODATA clustering algorithm. International Journal of Computational Geometry & Applications. v.17, p.71-103, 2007. https://doi.org/10.1142/S0218195907002252
» https://doi.org/10.1142/S0218195907002252 - Nascimento, V. F.; Ribeiro Neto, A. Characterization of reservoirs for water supply in Northeast Brazil using high resolution remote sensing. Revista Brasileira de Recursos Hídricos, v.22, p.1-9, 2017. https://doi.org/10.1590/2318-0331.0217170060
» https://doi.org/10.1590/2318-0331.0217170060 - Pereira, B.; Medeiros, P.; Francke, T.; Ramalho, G.; Foerster, S.; Araújo, J. C. de. Assessment of the geometry and volumes of small surface water reservoirs by remote sensing in a semi-arid region with high reservoir density. Hydrological Sciences Journal, v.64, p.66-79, 2019. https://doi.org/10.1080/02626667.2019.1566727
» https://doi.org/10.1080/02626667.2019.1566727 - Schwatke, C.; Scherer, D.; Dettmering, D. Automated extraction of consistent time-variable water surfaces of lakes and reservoirs based on Landsat and Sentinel-2. Remote Sensing . v.11, p.1-35, 2019. https://doi.org/10.3390/rs11091010
» https://doi.org/10.3390/rs11091010 - Toledo, C. E.; Araújo, J. C. de; Toledo, C. L. A. The use of remote-sensing techniques to monitor dense reservoir networks in the Brazilian semiarid region. International Journal of Remote Sensing , v.35, p.3683-3699, 2014. https://doi.org/10.1080/01431161.2014.915593
» https://doi.org/10.1080/01431161.2014.915593 - Zhang, S.; Foerster, S.; Medeiros, P.; Araújo, J. C. de; Motagh, M.; Waske, B. Bathymetric survey of water reservoirs in north-eastern Brazil based on TanDEM-X satellite data. Science of the Total Environment, v.571, p.575-593, 2016. https://doi.org/10.1016/j.scitotenv.2016.07.024
» https://doi.org/10.1016/j.scitotenv.2016.07.024 - Zhang, S.; Foerster, S.; Medeiros, P.; Araújo, J. C. de; Waske, B. Effective water surface mapping in macrophyte-covered reservoirs in NE Brazil based on TerraSAR-X time series. International Journal of Applied Earth Observation Geoinformation , v.69, p.41-45, 2018. https://doi.org/10.1016/j.jag.2018.02.014
» https://doi.org/10.1016/j.jag.2018.02.014
-
1 Research developed at Poço da Cruz, Jucazinho and Barra do Juá, PE, Brazil
Edited by
Publication Dates
-
Publication in this collection
05 Nov 2021 -
Date of issue
Jan 2022
History
-
Received
11 Feb 2021 -
Accepted
04 July 2021 -
Published
11 Aug 2021


 CAVREF - CAV of reference; CAVSI - Fitted curve using satellite imagery; CV - Coefficient of variation; CI - 95% confidence interval
 CAVREF - CAV of reference; CAVSI - Fitted curve using satellite imagery; CV - Coefficient of variation; CI - 95% confidence interval
 CAVREF - CAV of reference