Abstract
A total of 139 batches of Chrysanthemum samples were randomly divided into calibration set (92 batches) and prediction set (47 batches). The near infrared diffuses reflectance spectra of Chrysanthemum varieties were preprocessed by a first order derivative (D1) and autoscaling, and a modelwas built using partial least squares analysis. In this study, three Chrysanthemum varieties were identified, the accuracy rates in calibration sets of Dabaiju, Huju, and Xiaobaiju are 97.60, 96.65, and 94.70%, respectively; And 95.16, 86.11, and 93.46% accuracy rate in prediction sets was obtained. The research results demonstrate that the qualitative analysis can be conducted by machine learning combined with Near-Infrared Spectroscopy, which provides a new method for rapid and non-invasive identification of Chrysanthemum varieties.
Chrysanthemum morifolium; Near infrared spectroscopy; Rapid detection
Introduction
The use of various Chrysanthemum species in medicine derives from the use of the plant's capitulum for expelling wind and heat, calming a hyperactive liver, and to improve vision acuity; also it is consumed as an edible plant. Chrysanthemum species as herbs have a long history of cultivation throughout China, culturing high quality ones and different varieties, such as Chuju, Boju, Hangju, and Gongju (The Pharmacopoeia Comittee of People's Republic of China, 2010). Hangju has three varieties: Dabaiju, Huju and Xiaobaiju. which are cultured in Macheng City, Tongxiang City and Yancheng City respectively. These varieties differ in quality, chemical composition, functions, and application (Jing et al., 2007). Therefore, Chrysanthemum varieties in demand precise identification the market for their reasonable and correct application as geoherbs.
Currently, the identification of the Chrysanthemum medicinal constituents depends on the observation of properties, chemical composition (Dong et al., 2007) and molecular biology (Yang et al., 2006). However, these methods have inevitable limitations, such as being difficult in promotion, difficult analysis, long time for processing, and expensiveness (Huang et al., 2009). Therefore, it is essential to develop an efficient, rapid, and comprehensive method to detect specific Chrysanthemum varieties at low cost.
Near infrared spectroscopy (NIR) uses the electromagnetic spectrum ranging from the visible range and mid-infrared spectral region and its spectral range is 4,000-12,500 cm-1, which is primarily the frequency multiplication and combination frequency absorption of hydrogen-containing radicals like C-H, N-H, and O-H. By scanning samples using NIR, the information about the samples can be obtained, including the chemical composition, physical and chemical properties, and even biological properties (Rodriguez-Saona et al., 2004). Along with the computational identification techniques, stoichiometry, and pattern recognition technology; NIR can rapidly, efficiently and properly analyze samples with easy processing without reagent use or contamination and multi-component detection, so it can be extensively applied in many fields, including Traditional Chinese Medicine (TCM), with good results (Hua et al., 2003; Woo et al., 2005; Chen et al., 2008; Han et al., 2009; Yan et al., 2011; Leng et al., 2013). In recent years, due to the development of computer technology and chemometric analysis softwares; especially in-depth research and wide application of stoichiometry, NIR has become one of the most eye catching spectroscopic technologies.
In this research three varieties of Chrysanthemum were studied, analyzed the NIR data of Chrysanthemum samples, classified accuracy rate as an evaluation parameter, and established a disaggregated model of discriminant partial least squares to obtain a classification algorithm.
Materials and methods
Apparatus
A WQF-400N FT-NIR analyzer (Beijing Rayleigh Analytical Instrument Corporation) was used to collect near-infrared spectrum, and a lead sulfide (PbS) probe was selected to diffuse reflect loading attachments.
Sample collection and preparation
Dabaiju samples were collected at Futianhe town from Macheng city of Hubei Province; Huju samples were collected at Shimen town, Tongxiang city of Zhejiang Province; Xiaobaiju samples were collected from Yanmar town, Yancheng city of Jiangsu province. From October 31 to December 31, 2011, 139 batches of samples were regularly harvested. They were identified as Chrysanthemum morifolium Ramat (Asteraceae), authenticated by Prof. Dequn Wang of Anhui College of TCM.
From Dabaiju variety 51 samples were used, 34 were randomly selected as calibration set and 17 for the prediction set. From Huju variety, 51 samples were used, 34 were randomly selected as calibration set and 17 for the prediction set. From Xiaobaiju variety, 37 samples were used, 24 were randomly selected as calibration set and 13 for the prediction set. All samples were air dried, powdered and sieved using a 40 mesh.
Collect NIR data
Data was recorded at room temperature of 20ºC with relative humidity of 45%, the scanned area was 10,000-3,500 cm-1, corrections were performed a total of 32 scans, with a resolution factor of 4 cm-1, and light source was 10 W/6 V halogen tungsten lamp with air in the background. The samples were tested three times and the spectral data taken was the average value of three-time sampling.
Spectral data preprocessing
The methods taken for preprocessing are a standard normal variable transformation, a multiplicative scatter correction to get a first derivative (D1), and second derivative (D2). By comparing the four preprocessing methods on grain sizes, processing environment, and the machine's noise, the best preprocessing method would be obtained.
Partial least squares discriminant analysis modeling
Partial least squares discriminant analysis (PLS-DA) is a regression method based on characteristic variables. As a stable discriminant statistical analysis method, its use fits the situation with many variable numbers and multicollinearity, few samples of observation, and interference noise.
Spectra preprocessing and PLS-DA were carried out using a PLS toolbox 5.0 (American Eigenvector).
Results
Spectra preprocessing
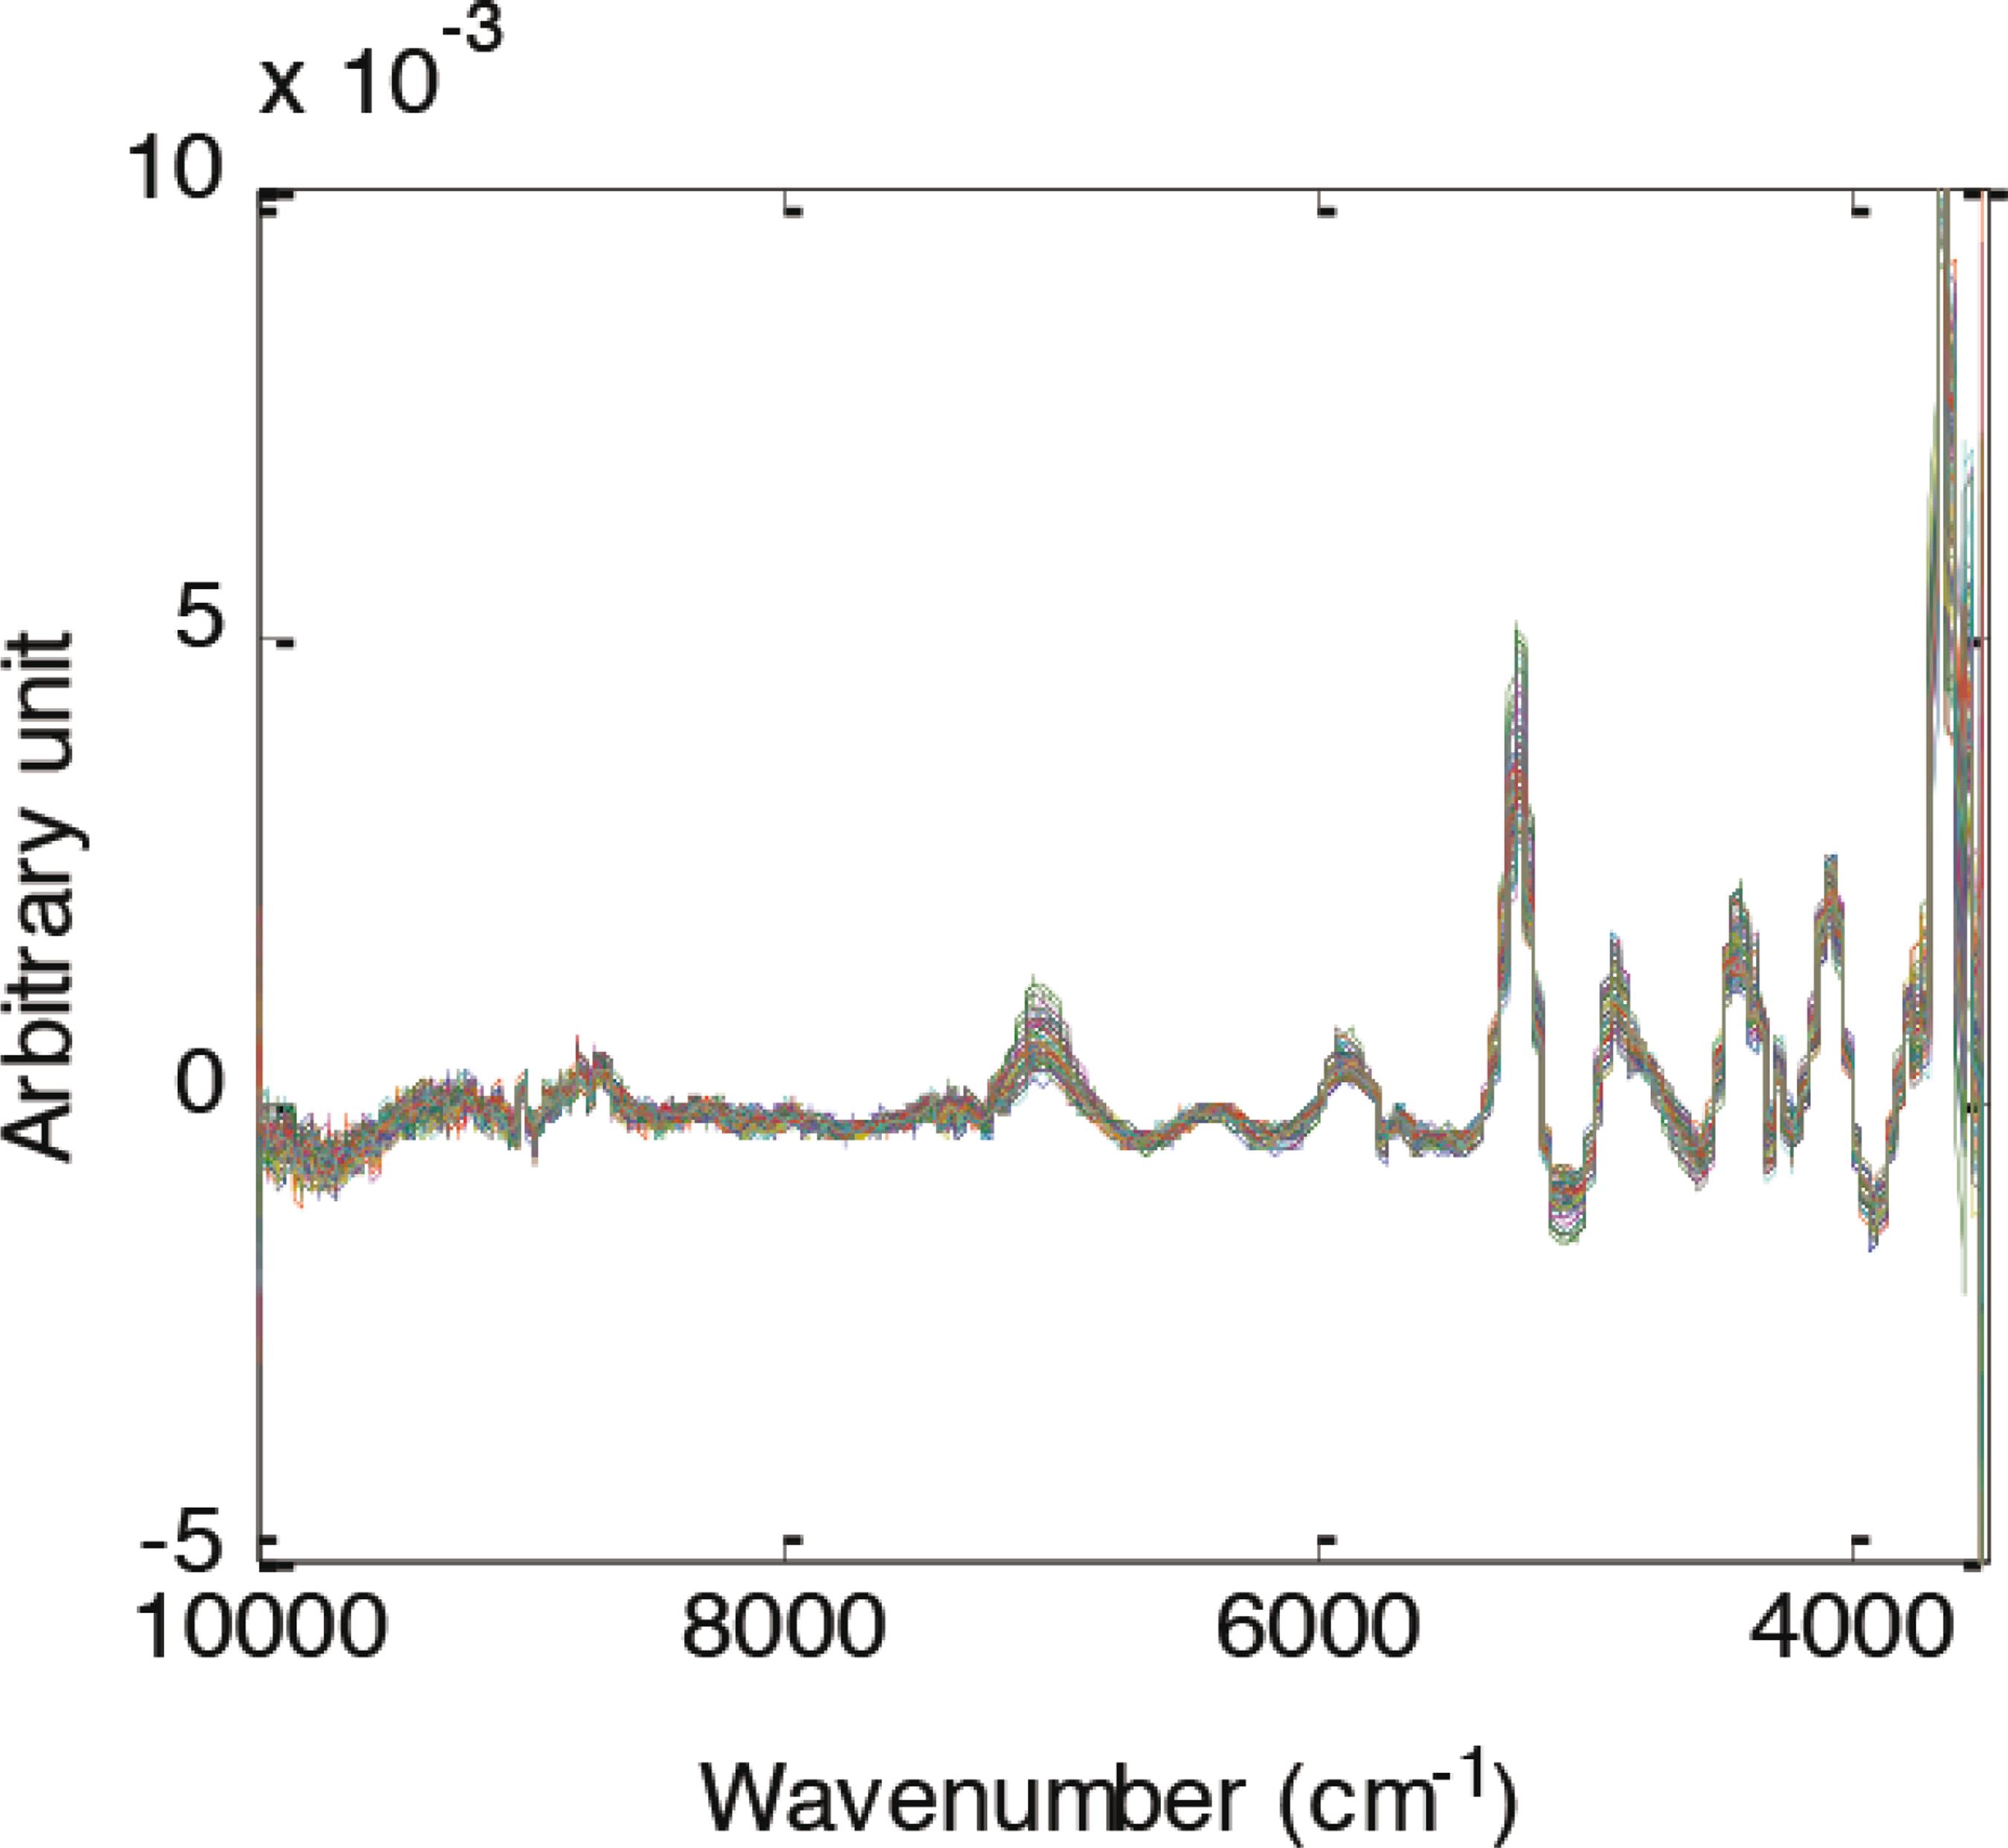
The original spectra collected (Fig. 1), contains the information related to the sample composition and the noise signals produced by different factors. The noise signals would interfere with spectrum information, which is, sometimes, even serious, and thus influences the calibration model and the prediction of unknown samples compositions and properties. Hence, spectra preprocessing mainly aims at filtering spectral noise, data screening, optimization of spectral range and eliminating influence of other factors over obtained data, so as to lay the foundation of further establishment of calibration model and the precise prediction of unknown samples.
The original spectra were preprocessed using D1, D2, standard normal variate (SNV), and multiplicative scatter correction (MSC), and calibration set was established using PLS-DA model, while prediction set was used for testing the preciseness of the model. The results demonstrate that D1 + autoscale is the best parameter combination, achieving 100% predictive accuracy in calibration (leave-one-out cross-validation) and prediction set. The spectra preprocessed by D1 + autoscale are seen in Fig. 2. Comparing Figs. 1 and 2, the preprocessed spectra have many additional peaks in all bands, highlighting the spectral information.
PLS-DA modeling
In order to determine class attribution, the array should be able to describe the samples of specific categories. Generally, a critical value is set to determine the attribution. Fig. 3 is the PCA distribution of the three Chrysanthemum varieties. From the figures, factors distribute disorderly, which are not sufficient to distinguish the three varieties. More LV (latent variable) values are needed.
In PLS-DA analysis, spectral data are alternated to get LV scores. A low LV score reflects the information hidden in the original spectra as to achieve dimensionality reduction.
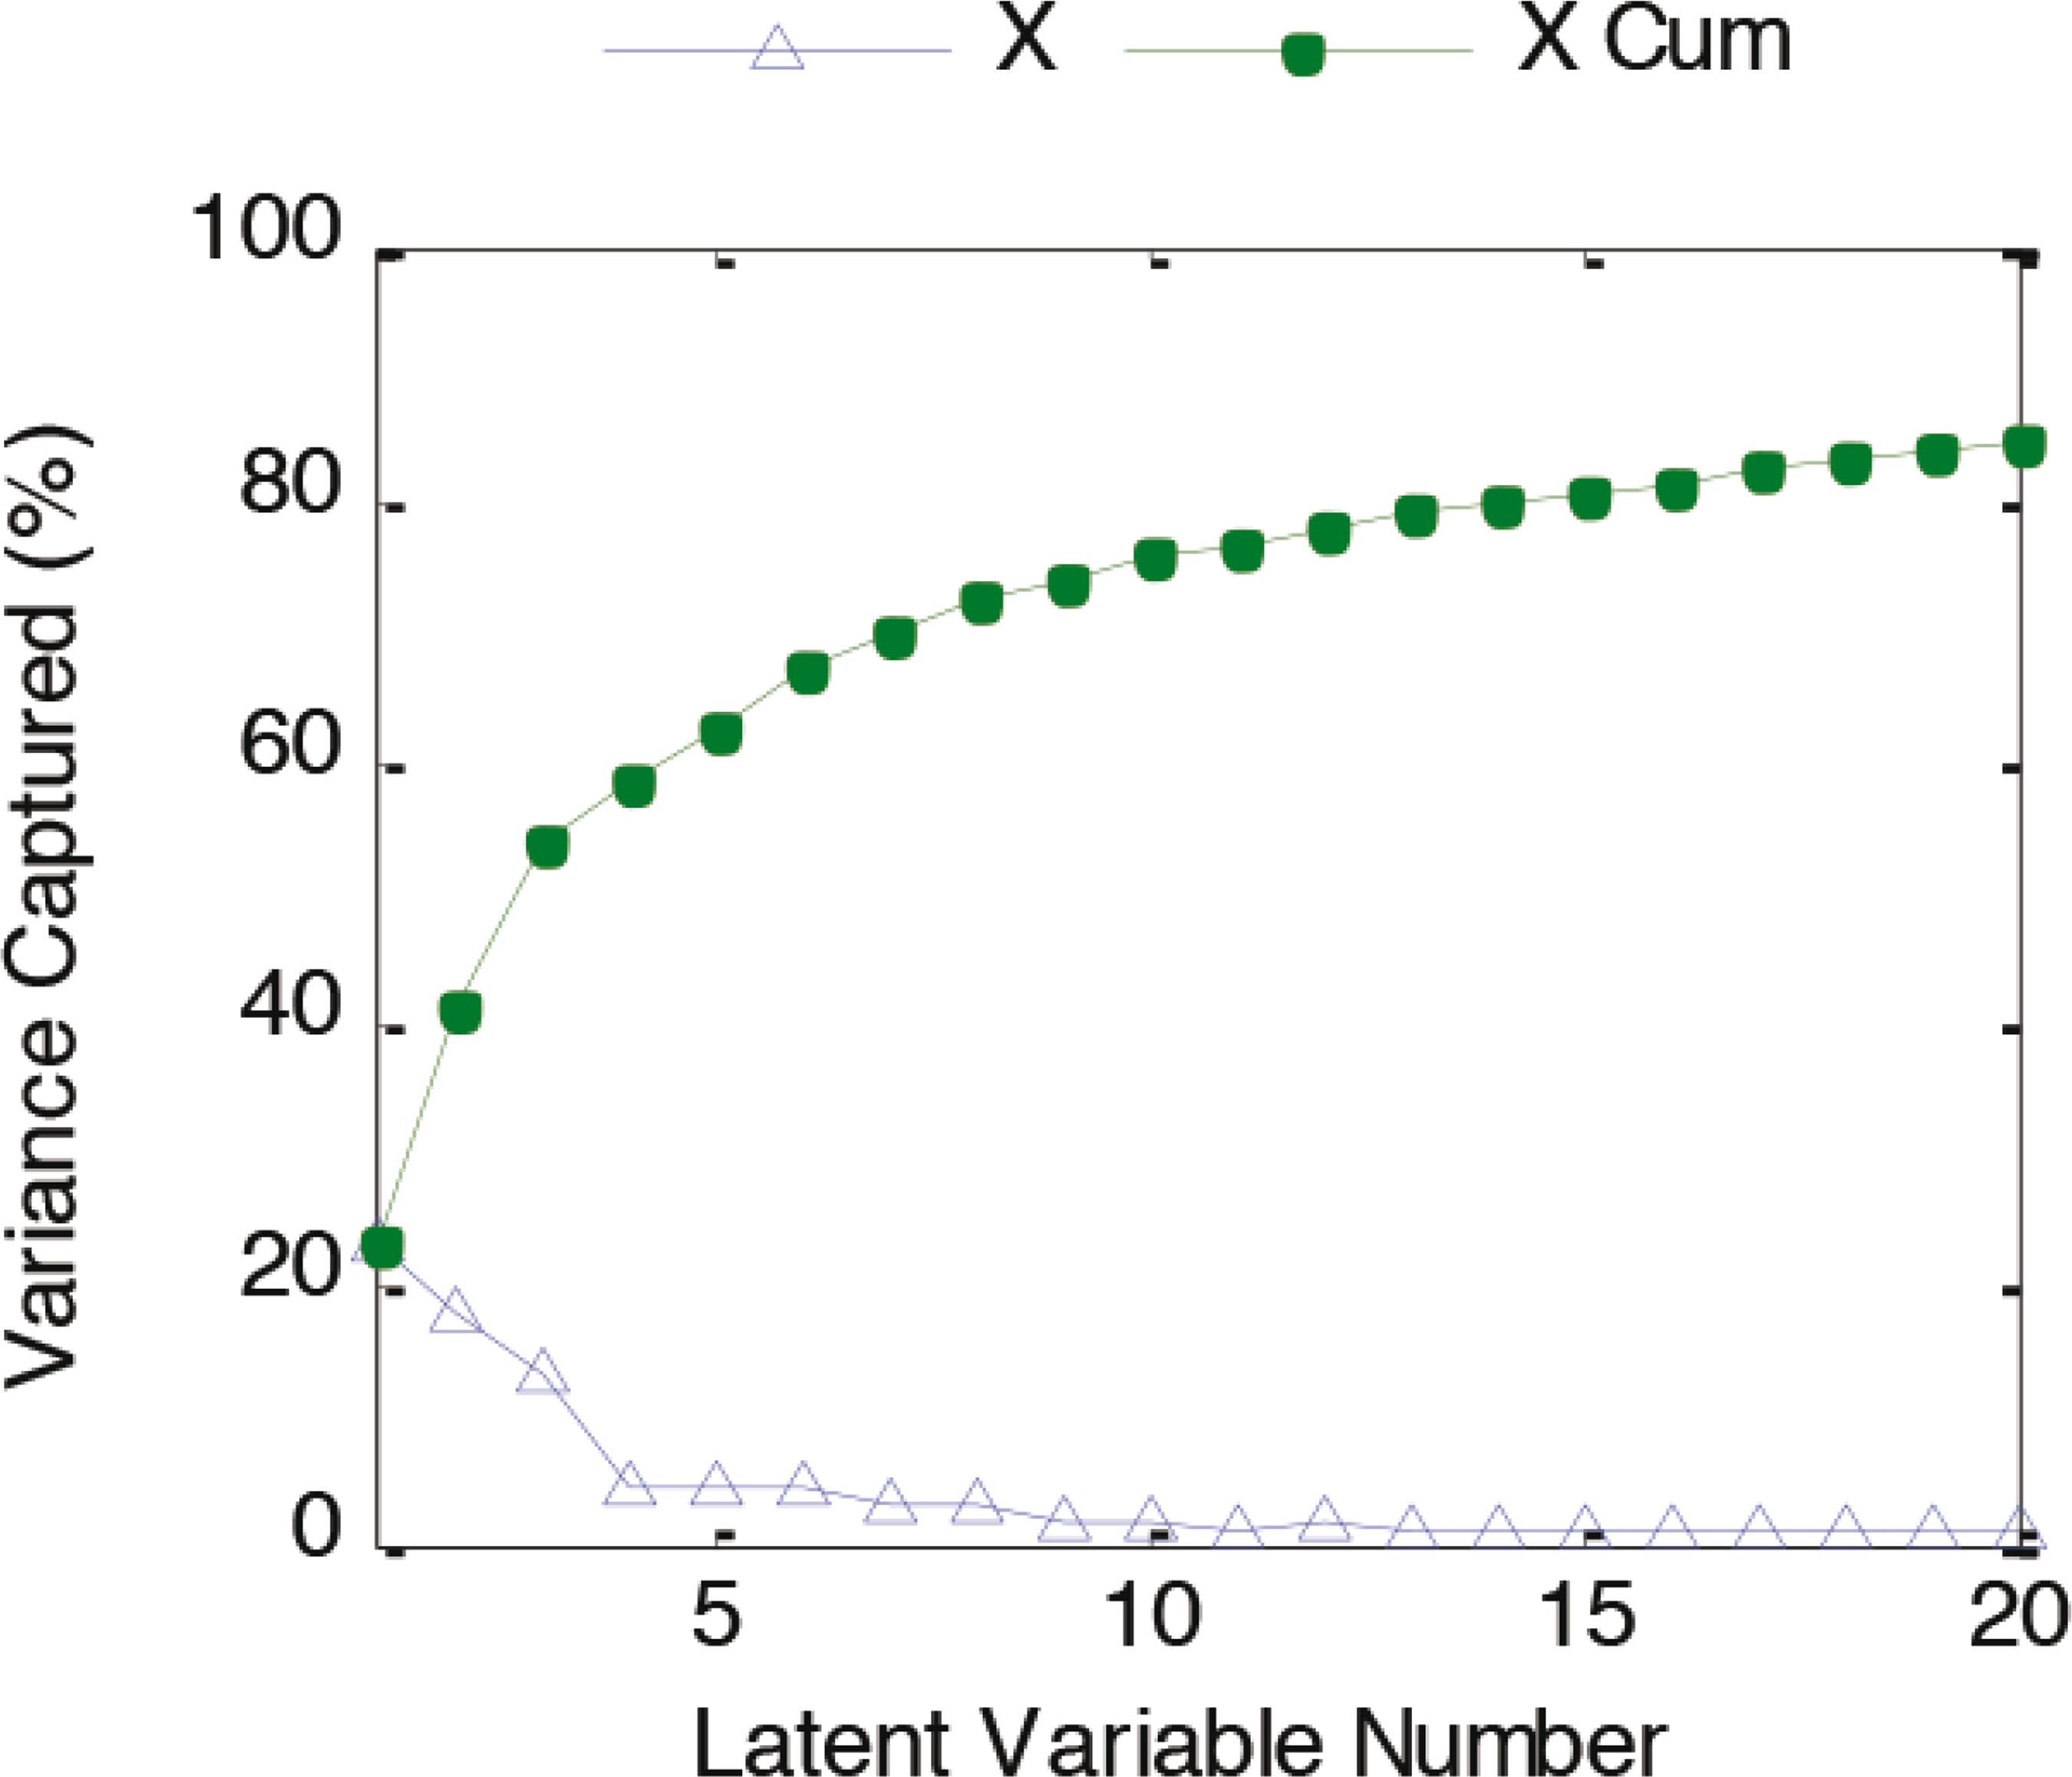
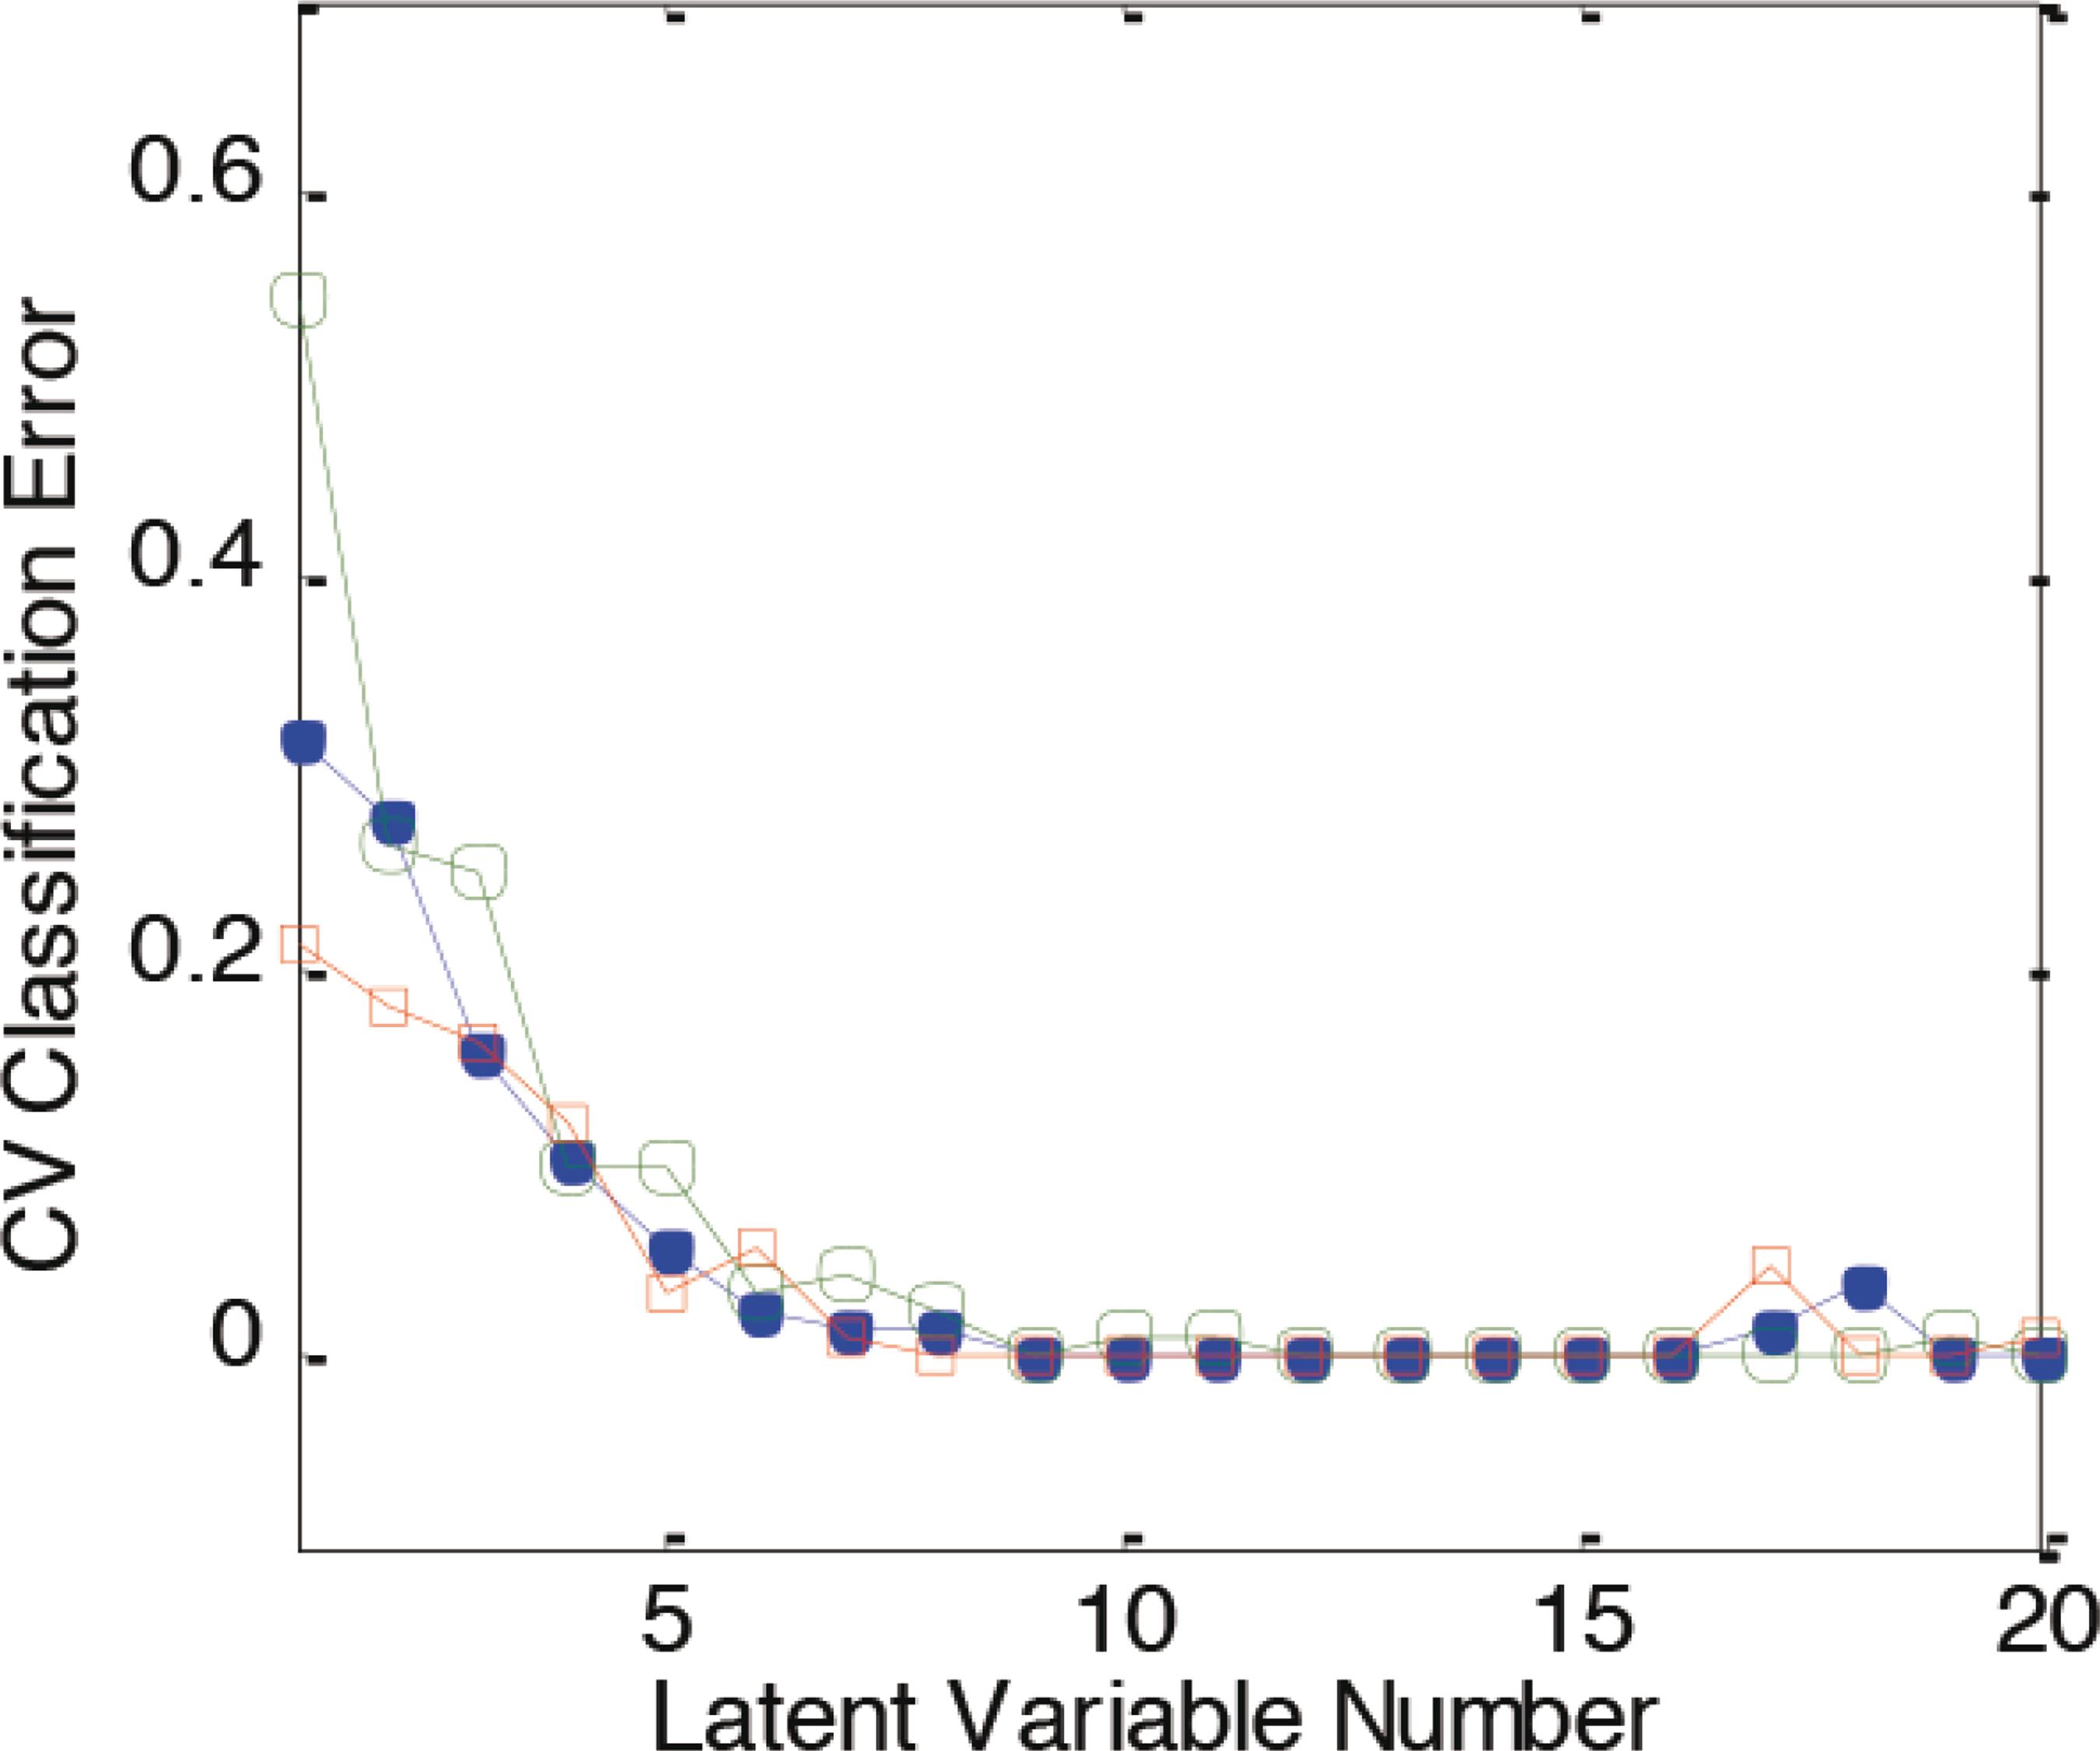
The cumulative contribution rate of LV of the tested spectra is shown in Fig. 4. The first four LV scores contribute a lot, while 5-9 LV contribute less. Nine LV are adopted to establish when the optimal accuracy is obtained. As it is shown in Fig. 5, the error rate of model prediction decreases along with the increase of LV number. When 9 LV are used, the average category error is the lowest. It means that when the principal component selection is 9, correction and prediction sets reach the best accuracy, and classification accuracy is best. If 9 LV are shown in advance, the information of the Chrysanthemum varieties is reflected.
Different wavenumbers affect the LV scores greatly, and this determination is crucial for assessment of the Chrysanthemum variety, it is also beneficial for understanding the mechanism of the discriminant model. The relation of variable importance on PLS projection (VIP) scores of origin and wavenumbers are shown in Fig. 6. As shown in the figure, information is in the 100-600 interval. The VIP scores wavenumber of Huju (Y2) differs from other Chrysanthemum varieties mostly. Especially, VIP score in the 100-300 and 800-850 intervals is higher than that of others. The VIP scores of Daibaiju (Y1) and Xiaobaiju (Y3) varieties differ from Huju in high VIP score wavenumber of 400-600.
The different VIP scores may be the basis of the model's distinguishing origins, it may be due to the different scores at diverse wavenumber that are caused by the different molecular groups' vibrations, including the varied varieties and quantity. These demonstrate that origins affect the chemical compositions of Chrysanthemum to some degree.
As shown in Fig. 9, the receiver operating characteristic (ROC) curve area shows a 100% sensitivity reach. The data manifest that the accuracy rates of Dabaiju, Huju, and Xiaobaiju calibration sets are 97.60%, 96.65%, and 94.70%, respectively; and the accuracy rate in prediction sets 95.16%, 86.11%, and 93.46%, respectively.
Discussion
In this study, identification of the three Chrysanthemum varieties, the accuracy rates of Dabaiju, Huju, and Xiaobaiju calibration sets are 97.60%, 96.65%, and 94.70%, respectively; while the accuracy rates of calibration sets are 95.16%, 86.11%, and 93.46%. These data manifest that nonlinear classification model has high classification accuracy.
The results demonstrate that a qualitative analysis can be conducted by machine learning combined with NIR, which provides a new means for rapid identification of Chrysanthemum specific varieties. Successive Chrysanthemum identification requires suitable data processing and classification methods. A nonlinear classifier, by means of principal components least squares support vector machine, achieves complexity and effectiveness, which proves useful for research. With infrared spectrum fingerprint resistance and pattern recognition, Chrysanthemum samples can be rapidly clustered classified. This method is convenient, rapid and accurate, being suitable for the rapid identification of a large number of samples, which is reliable and practical to some degree. It will provide scientific theoretical basis for the identification of materials' authenticity and quality of genuine medicinal materials, and it has broad application prospects. This study just conducts the identification research on the four best Chrysanthemum. In the future, different mathematic models will be employed to establish pattern recognition databases of all Chrysanthemum species and varieties for medicine, as to distinguish the modes of Chrysanthemum for medicine, providing new ideas and methods for TCM identification modernization.
-
Authors' contributionsChen did the sample collection and writing of the article, Yan's carried out the data analysis, and Han did experimental design.
Acknowledgments
This work has been financially supported by the special protection of biological diversity of department environmental protection of China (NO.30901972).
REFERENCES
- Chen, Y., Xie, M.Y., Yan, Y., Zhu, S.B., Nie, S.P., Li, C., 2008. Discrimination of Ganoderma lucidum according to geographical origin with near infrared diffuse reflectance spectroscopy and pattern recognition techniques. Anal. Chim. Acta 618, 121-130.
- Dong, L., Wang, J., Deng, C., Shen, X., 2007. Gas chromatography-mass spectrometry following pressurized hot water extraction and solid-phase microextraction for quantification of eucalyptol, camphor, and borneol in Chrysanthemum flowers. J. Sep. Sci. 30, 86-89.
- Han, B.X., Chen, N.F., Yao, Y., 2009. Discrimination of Radix Pseudostellariae according to geographical origin by FTNIR spectroscopy and supervised pattern recognition. Pharmacogn. Mag. 20, 279-286.
- Hua, R., Sun, S.Q., Zhou, Q., Noda, I., Wang, B.Q., 2003. Discrimination of Fritillary according to geographical origin with Fourier transform infrared spectroscopy and two-dimensional correlation IR spectroscopy. J. Pharm. Biomed. Anal. 33, 199-209.
- Huang, Q.Q., Pan, R.L., Wei, J.H., Wu, Y.W., Zhang, L.D., 2009. Determination of baicalin and total flavonoids in Radix scutellariae by near infrared diffuse reflectance spectroscopy. Spectrosc. Spect. Anal. 29, 2425-2428.
- Jing, D.L., Liu, W., Xing, Z.X., Xu, Y., 2007. A comparative quality analysis of Chrysanthemum morifolium from five different production areas. Chin. J; Mod. Appl. Pharm. 24, 467-469.
- Leng, H.Q., Guo, Y.D., Liu, W., Zhang, T., Deng, L., Shen, Z.Q., 2013. Determination of chlorogenic acid, rutin, scopoletin and total polyphenol in tobacco by Fourier Transform Near Infrared Spectroscopy. Spectrosc. Spec. Anal. 33, 2363-2366.
- Rodriguez-Saona, L.E., Khambaty, F.M., Fry, F.S., Dubois, J., Calvey, E.M., 2004. Detection and identification of bacteria in a juice matrix with Fourier transform-near infrared spectroscopy and multivariate analysis. J. Food Prot. 67, 2555-2559.
- The Pharmacopoeia Comittee of People's Republic of China 2010. Chinese Pharmacopoeia. Beijing.
- Woo, Y.A., Kim, H.J., Ze, K.R., Chung, H., 2005. Near-infrared (NIR) spectroscopy for the non-destructive and fast determination of geographical origin of Angelicae gigantis Radix. J. Pharm. Biomed. Anal. 36, 955-959.
- Yan, H., Han, B.X., Wu, Q.Y., Jiang, M.Z., Gui, Z.Z., 2011. Rapid detection of Rosa laevigata polysaccharide content by near-infrared spectroscopy. Spectrochim. Acta A. Mol. Biomol. Spectrosc. 79, 179-184.
- Yang, W., Glover, B.J., Rao, G.Y., Yang, J., 2006. Molecular evidence for multiple polyploidization and lineage recombination in the Chrysanthemum indicum polyploidy complex (Asteraceae). New Phytol. 171, 875-86.
Publication Dates
-
Publication in this collection
Jan-Feb 2014
History
-
Received
28 Nov 2013 -
Accepted
18 Feb 2014