ABSTRACT
The objective of this study was to investigate the usefulness of HbA1C as a test in monitoring the long-term glycemic control during the perinatal period in minks with the tendency to obesity. On the scanbrown mink farm, screening research on one-year-old females showing predilections to obesity was conducted. In the first year of the experiment, 120 females were assessed using body condition score (BCS) system. The two groups that differed significantly in body weight were selected based on the BCS system and then two treatment groups of 30 females were formed: BCS II (lean) and BCS IV (thick). The groups were subjected to tests during the two years of the experiment. The biological material was urine and blood taken from vena safena five times a year. In whole blood, the level of glycosylated hemoglobin A1C was determined by ion exchange chromatography with chromatographic-spectrophotometric test (BioSystems S.A. company). Plasma glucose level was determined using Cormay reagents and BS 130 apparatus. The level of glucose in urine was also determined using diagnostic Medi-Test Combi 10 VET strips. The results were statistically analyzed using the SAS Enterprise Guide 5.1. The descriptive statistics and the analysis of one-way variance (ANOVA) were used. Statistically significant differences were analyzed by Tukey test at the significance level α = 0.05. Glycosuria was found in females in all studied stages of the production cycle. In both BCS II and BCS IV, hyperglycemia was observed in late lactation and decreased after weaning. Average concentrations of HbA1C reached values from 3.64 to 5.17%. HbA1C is a useful test for monitoring glycemic control that is why the presented research should be continued due to the lack of reference values in case of HbA1C in minks, which can contribute to making the diagnosis and help in confirmation or exclusion of diabetes.
Key Words:
body condition score; glucose; glycosylated hemoglobin; Neovison vison
Introduction
Research worldwide shows that the problem of overweight and obesity in animals affects 45% of the population, of which approximately 35% of animals are obese and 10% have advanced obesity. Both states, being widespread in the animal world, violate animal welfare (Shearer, 2010Shearer, P. 2010. Literature review - canine, feline and human overweight and obesity. Bark - Banfield Applied Research and Knowledge team. p.1-8.). The main cause of that situation is the positive energy balance, induced by eating too much food in relation to the physiological needs of the body. Obesity has been identified as a risk factor for development of diabetes in both cats and dogs (Rand et al., 2004Rand, J. S.; Fleeman, L. M.; Farrow, H. A.; Appleton, D. J. and Lederer, R. 2004. Canine and feline diabetes mellitus: Nature or nurture? Journal of Nutrition 134:2072S-2080S.). Major abnormalities found in feline diabetes include impaired insulin secretion, peripheral insulin resistance, and increased basal hepatic glucose production (Behrend, 2002Behrend, E. N. 2002. Diabetes mellitus: an update on oral hypoglycemic agents and monitoring agents. Veterinary Medicine 97:743-751.). This phenomenon is conducive to genetic predispositions and environmental factors, including insufficient or no physical activity and improper diet.
American mink, Neovison vison, during its life in the wild is a very active animal. Unfortunately, through domestication, it is placed in cages and gets food in the amount that often exceedes the metabolic needs (Clausen et al., 1992Clausen, T. N.; Olesen, R.; Hansen, O. and Wamberg, S. 1992. Nursing sickness in lactating mink (Mustela vison). I. Epidemiological and pathological observations. Canadian Journal of Veterinary Research 56:89-94.; Hynes and Rouvinen-Watt, 2007aHynes, A. M. J. and Rouvinen-Watt, K. 2007a. Monitoring blood glucose levels in female mink during the reproductive cycle: 1. Prevention of hyperglycemia during the nursing period. The Canadian Journal of Veterinary Research 71:241-248.; Rouvinen-Watt, 2008Rouvinen-Watt, K. 2008. Recent progress in research program activities. Fur Animal Research 16:196-198.). The feeding of mink in Poland is based on high-energy feeds in a large amount of energy from fat. This is a condition for obtaining high-quality pelt and better reproduction features (Lagerkvist et al., 1993Lagerkvist, G.; Johansson, K. and Lundeheim, N. 1993. Selection for litter size, body weight, and pelt quality in mink (Mustela vison): experimental design and direct response of each trait. Journal of Animal Science 71:3261-3272.. Bis-Wencel et al., 2006Bis-Wencel, H.; Nordryn-Płotnicki, Z.; Saba, L.; Zoń, A.; Kopczewski, A. and Sroka, A. 2006. Wpływ konserwantów na obraz histopatologiczny narządów wewnętrznych norek. Medycyna Weterynaryjna 62:70-73.). Properly balanced nutrition, high standard of feed hygiene, and proper management with emphasis on the body condition score (BCS) have an impact on animal welfare and reduce predisposition to metabolic disorders and losses related to reproduction (Finley et al., 2012Finley, G.; Mason, G.; Pajor, E.; Rouvinen-Watt, K. and Rankin, K. 2012. Code of practice for the care and handling of mink: review of scientific research on priority issues. National Farm Animal Care Council, Lacombe, AB, Canada.).
The study by Fink and Børsting (2002)Fink, R. and Børsting, C. F. 2002. Quantitative glucose metabolism in lactating mink (Mustela vison) - effects of dietary levels of protein, fat and carbohydrates. Acta Agriculturae Scandinavica, Section A, Animal Science 52:34-42. confirmed that both excess and lack of body fat in feeding minks can cause the accumulation of fat in cells that metabolize glucose, causing insulin resistance and break in the peripheral glucose circulation. In animals with clear insulin resistance, the ability to stimulate the translocation of the GLUT-4 glucose transporter in the blood is impaired, which causes binding of glucose by the peripheral cells, for instance muscle and fat cells (Clausen et al., 1996Clausen, T. N.; Wamberg, S. and Hansen, O. 1996. Incidence of nursing sickness and biochemical observations in lactating mink with and without dietary salt supplementation. Canadian Journal of Veterinary Research 60:271-276.). Glucose is the primary and one of the most important compounds in the metabolism of carbohydrates. The amount of carbohydrates taking part in the overall energy balance is almost two times higher than in the case of proteins and fats taken together (Berestov, 1989Berestov, V. 1989. Carbohydrates. p.64-65. In: Haematology and clinical chemistry of fur animals. 1st ed. Brandt, A., ed. Scientifur, Jyvväskylä, Finland.). The increase of glucose concentration, hyperglycemia, is one of the symptoms of diabetes.
In everyday laboratory practice, glucometers or routine analytical methods are used in glucose determination. These measurements are simple to make, but unfortunately, this type of measurements determine the momentary metabolic state and blood glucose. Much better results in determining the glucose level and in monitoring the treatment of hyperglycemia or diabetes gives the measurement of glycated hemoglobin A1C. The rate of formation of glucose and hemoglobin connection, which is named as HbA1C, is determined by the concentration of glucose in the blood and the duration of hyperglycemia. This process is called non-enzymatic glycosylation – glycation. Glycated hemoglobin in erythrocytes easily attaches glucose to the molecule of the N-terminal amino acids. The higher the level of glucose in the blood, the more glucose is attached to hemoglobin and more forms of glycated hemoglobin are formed.
The average lifetime of erythrocytes gives the ability to control this period with a number of indicators, including glycosylated hemoglobin. The HbA1C level allows to determine the level of blood glucose over a longer period of time. This is possible due to the combination of glucose with hemoglobin which is durable. State associated with diabetes is the pre-diabetes stage which occurs when blood glucose levels are higher than reference values, but not high enough to diagnose diabetes. People with the prediabetes and type II diabetes often do not show symptoms of the disease and may not know they are sick (Manjunatha Goud et al., 2011Manjunatha Goud, B. K.; Sarsina Devi, O.; Bhavna, N.; Shivashanker, S.; Sathisha, T. G. and Devaki, R. N. 2011. An overview of diabetes mellitus with emphasis on biochemical and clinical management. International Journal of Pharmaceutical Sciences Review and Research 8:96-100.). There is a lack of research concerning the HbA1C as a retrospective indicator of glycemic control in minks.
The objective of this study was to investigate the usefulness of HbA1C as a test in monitoring the long-term glycemic control during perinatal period in minks with tendency to obesity.
Material and Methods
On the scanbrown mink farm, screening research on one-year-old female minks showing predilections to obesity was conducted. In the first year of the experiment, 120 females were assessed using body condition score (BCS) system (Hynes et al., 2004Hynes, A. M. J.; Rouvinen-Watt, K. and Armstrong D. 2004. Body condition and glycemic control in mink females during reproduction and lactation. Scientifur 28:79-86.). The two groups that differed significantly in body weight were selected based on the BCS system and then two treatment groups of 30 females were formed: BCS II – lean and BCS IV – thick. The groups were subjected to tests during the two years of the experiment. Animals were fed twice a day, while the access to tap water was provided ad libitum. The feeding dose was established and was presented in the form of the table (Table 1). Fodder was supplemented with vitamin-mineral premix in doses covering the full requirements of these components. The preservative (sodium metabisulfite) and the antioxidant (Rendox) were also added. These preparations were added to raw meat and fish stored in the refrigerator. Feed of plant origin only complemented the diet. The share of meat and fish feed did not exceed 70%. The rest of the doses consisted of cereal used in fur animal nutrition (Sławoń, 1986Sławoń, J. 1986. Żywienie lisów i norek. PWRiL, Warszawa.). The control of hygienic condition of feed based on microbiological and parasitological examination was carried out after the feed preparation and after 20 days of storage. Minks were under constant veterinary supervision throughout the whole experimental period.
Blood was collected five times for tests during the first year of the study: in January (preparation for reproduction), April (pregnancy), May (middle of lactation), and June (late lactation and weaning). The tests were repeated in the second year of the experiment. The biological material was urine and blood. The blood was taken from vena saphena in a closed system with K2EDTA tubes. Blood was collected in the morning, before feeding the animals, according to the decision of the ethics committee for this experiment (NR 33/2016). In whole blood, the level of glycosylated hemoglobin A1C was determined by ion exchange chromatography with chromatographicspectrophotometric test (BioSystems S.A. company). Determination was made not later than 6 h after blood collection. After the hemolysate preparation and removal of the labile fraction, hemoglobin was retained on the cation exchange resin. Hemoglobin A1C was subjected to specific elution after rinsing fractions of A1a+b hemoglobin and was determined quantitatively in the direct photometric measurement 415 nm. Detection limit was determined below 4.1% and the limit of linearity over 19.0%. Plasma glucose level was determined using Cormay reagents and BS 130 apparatus.
Upon handling, voluntarily voided urine was collected from the females and samples were tested for urine parameters including glucose, using diagnostic Medi-Test Combi 10 VET strips.
The results were statistically analyzed using the statistical program SAS (Statistical Analysis System, version 5.1). The descriptive statistics and the analysis of one-way variance (ANOVA) was used. Statistically significant differences were analyzed by Tukey test at the significance level α = 0.05. The characteristics such as BCS and the stage of the experiment were examined. The threshold for providing the relationships between features was assumed as 0.3. To determine the interdependence of the traits studied, the Pearson correlation coefficient was calculated for BCS II and BCS IV.
Results
The results of microbiological and parasitological studies indicated the proper state of the feed administered during the experiment. The maximum allowable number of bacteria was less than 6 mln/g of feed. The peroxide fat content was 12.14 mcq/kg and 28.50 mcq/kg, respectively, at 12 h and 20 days after feed preparation (Gugołek, 2011Gugołek, A. 2011. Zalecenia żywieniowe i wartość pokarmowa pasz. Zwierzęta futerkowe. Instytut Fizjologii i Żywienia Zwierząt, Jabłonna. p.68-69.).
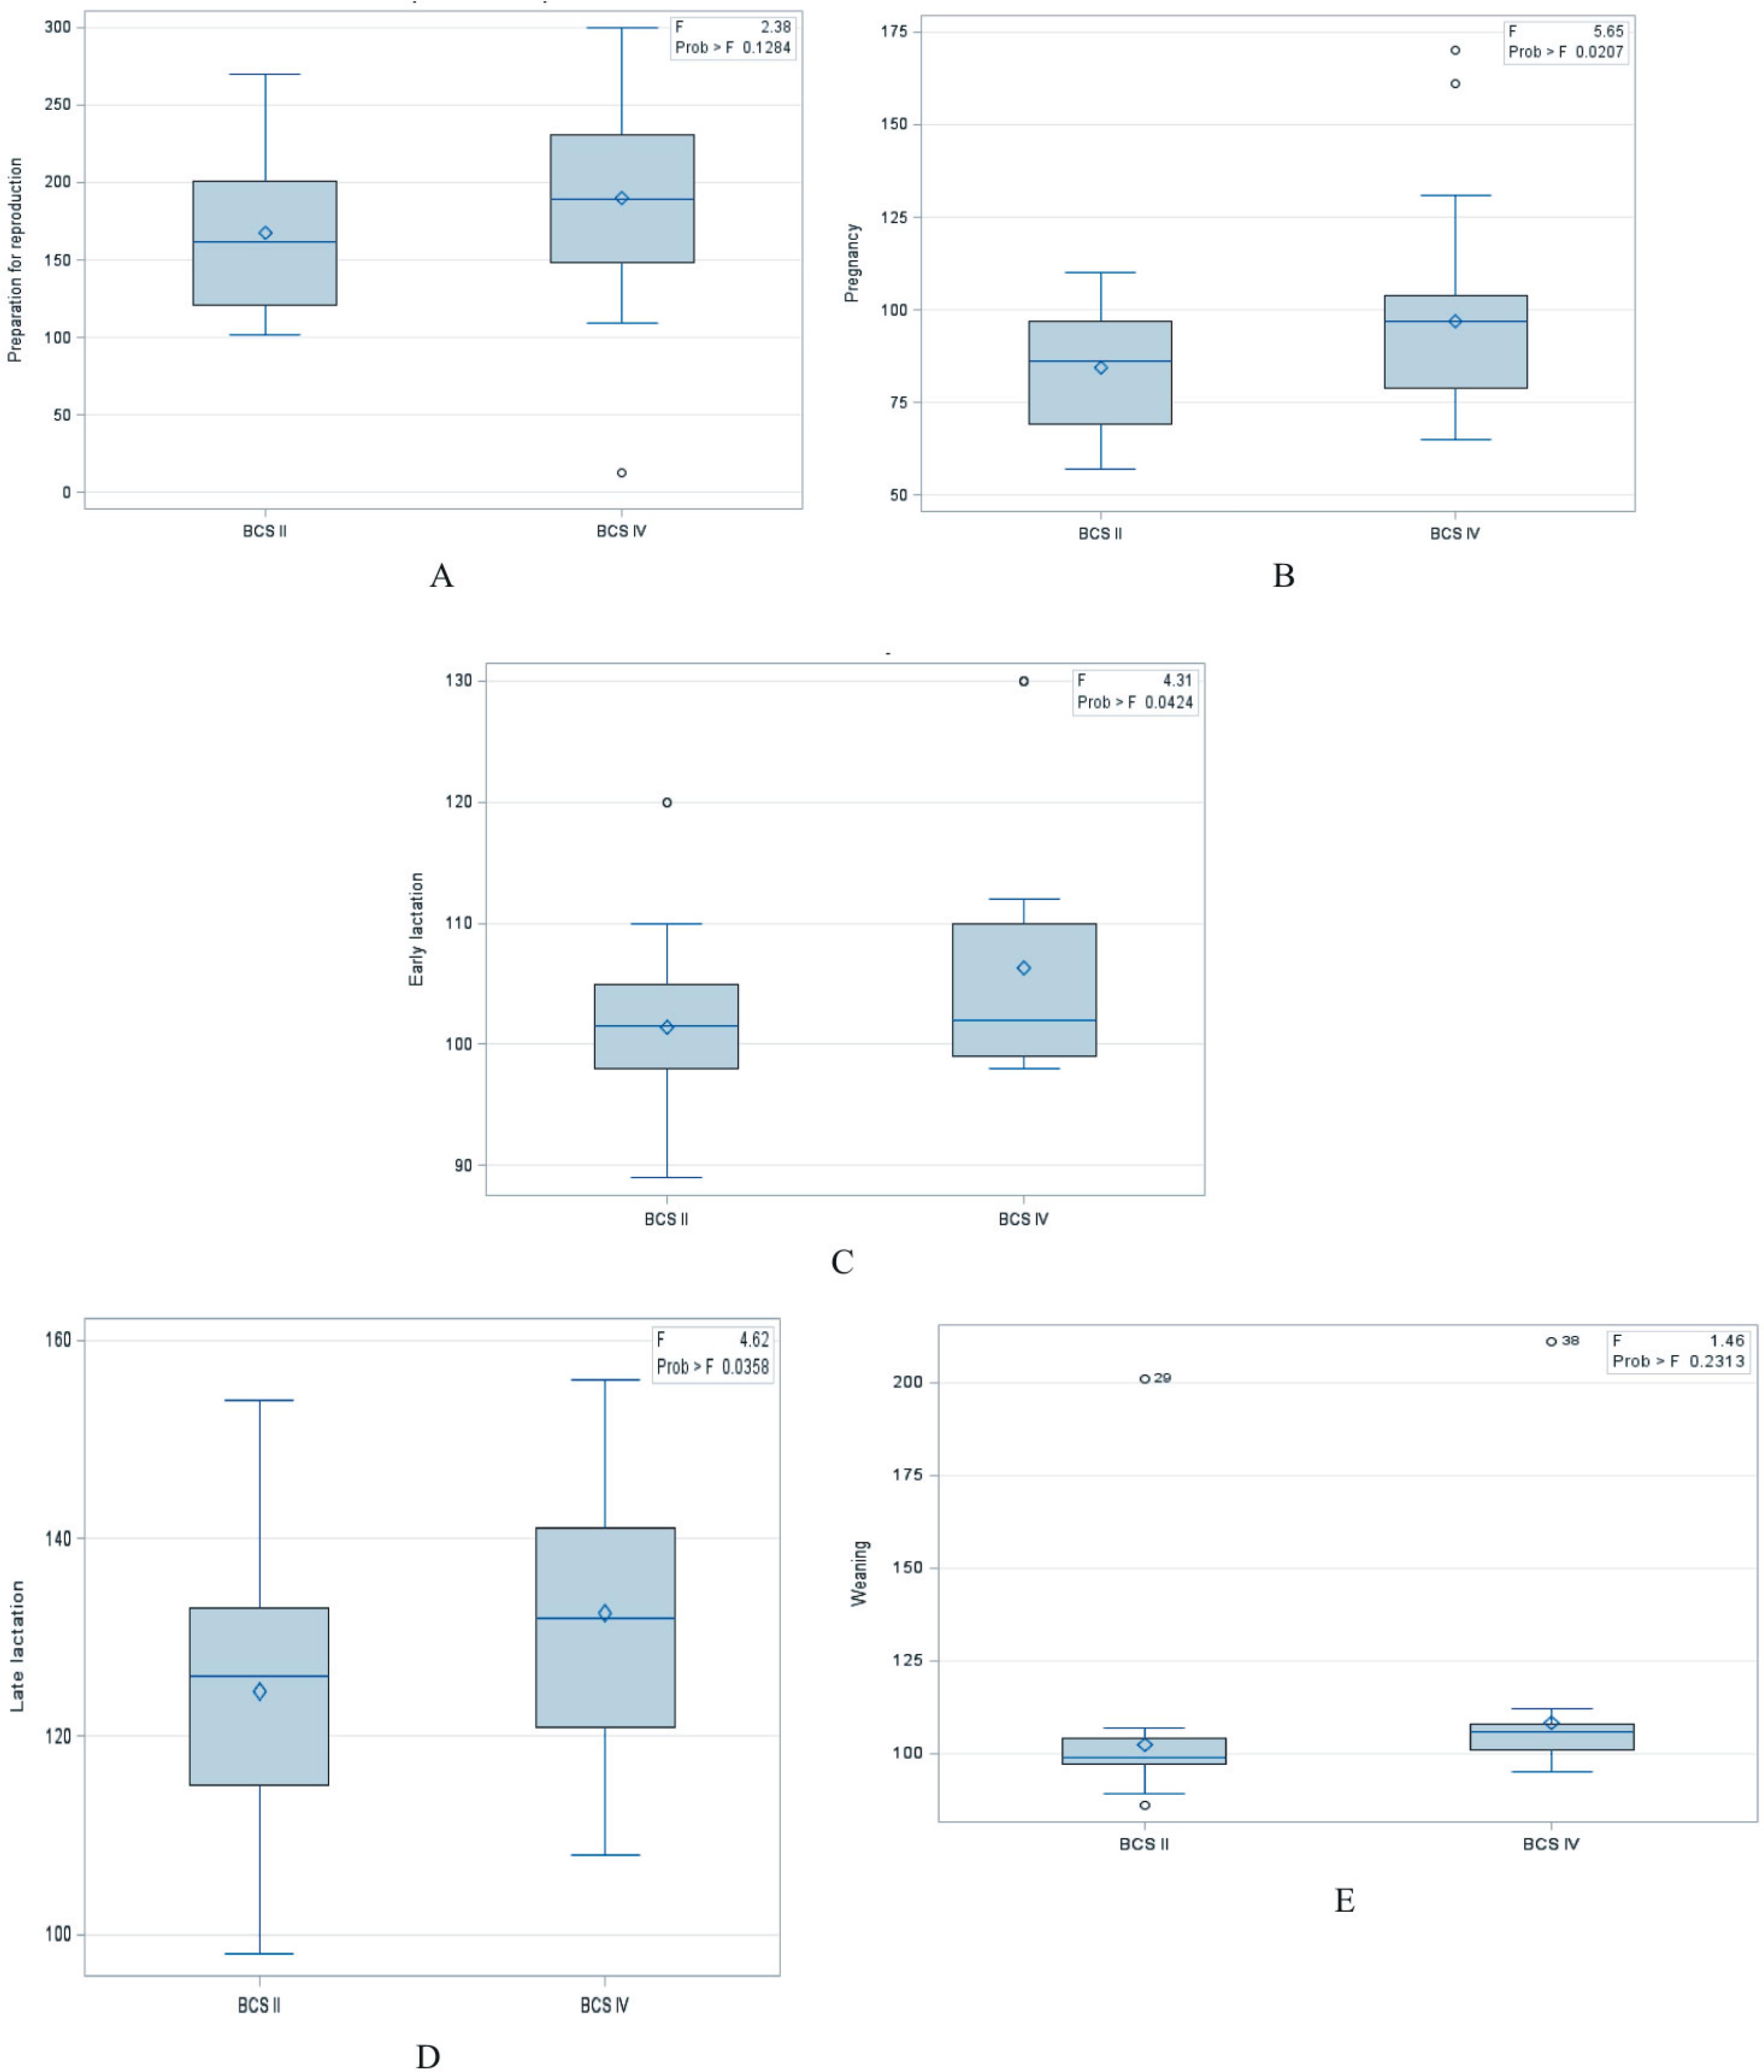
Through the BCS system, minks were classified into four groups known as BCS I: very thin, with body weight of 713.6±10.9 g; BCS II: lean, with body weight 922.3±15.6 g; BCS III: ideal, weighing 1121.9±7.3 g; and BCS IV: thick, with body weight 1315±12.1 g. Significant differences (P<0.001) were observed between body weight in BCS II and IV groups. Average values of glucose in the urine of the two groups varied within a wide range from 84.40 to 190.37 mg dL−1 (Table 2) and were characterized by large inter-individual variability (Figure 1A).
Average values and standard deviations (SD) of concentration of glucose in the urine (mg dL−1) and plasma (mg dL−1) of minks (n = 30) over a period of reproduction
Mean values of glucose (Glu; mg dL−1) in urine of BCS II and BCS IV minks (n = 30) during the perinatal period.
BCS - body condition score.
BCS II: lean, with 922.3±15.6 g of body weight; BCS IV: thick, with 1315±12.1 g of body weight.
Glycosuria was found in females in all studied stages of the production cycle and was comparable between two years of experiment and two studied BCS groups. The average level of glucose in the urine in our study was the highest during the period of preparation for reproduction and was significantly different from the results obtained in other periods in both BCS groups (Table 2 and Figure 1B). The lowest levels of glucose in the urine were noted during the period of pregnancy in both conditioning groups. In the late lactation, the average level of glucose in the urine was higher than in the pregnancy, early lactation, and weaning. Statistically significant differences were found between females of the BCS II and BCS IV, respectively, in the pregnancy (P = 0.0207), early lactation (P = 0.0424), and late lactation (P = 0.0358) (Table 3 and Figure 2). In weaning, the levels of glucose in urine and in plasma decreased in both BCS groups and were not statistically different in relation to pregnancy and early lactation.
Comparison between mean levels of glucose in urine and plasma between groups BCS II and BCS IV over the reproductive period of minks (n = 30)
Mean values of glucose (Glu; mg dL−1) in urine of BCS II and BCS IV minks (n = 30) during the perinatal period.
BCS - body condition score.
BCS II: lean, with 922.3±15.6 g of body weight; BCS IV: thick, with 1315±12.1 g of body weight.
The analysis of relationships between the levels of glucose in urine in group BCS II, revealed a positive correlation between the preparation for reproduction and late lactation (0.3786; P<0.0001) (Table 4). The same trend was observed in relation to glycemia.
Correlations for glucose in urine of groups BCS II and IV at various stages of the perinatal period of minks (n = 30)
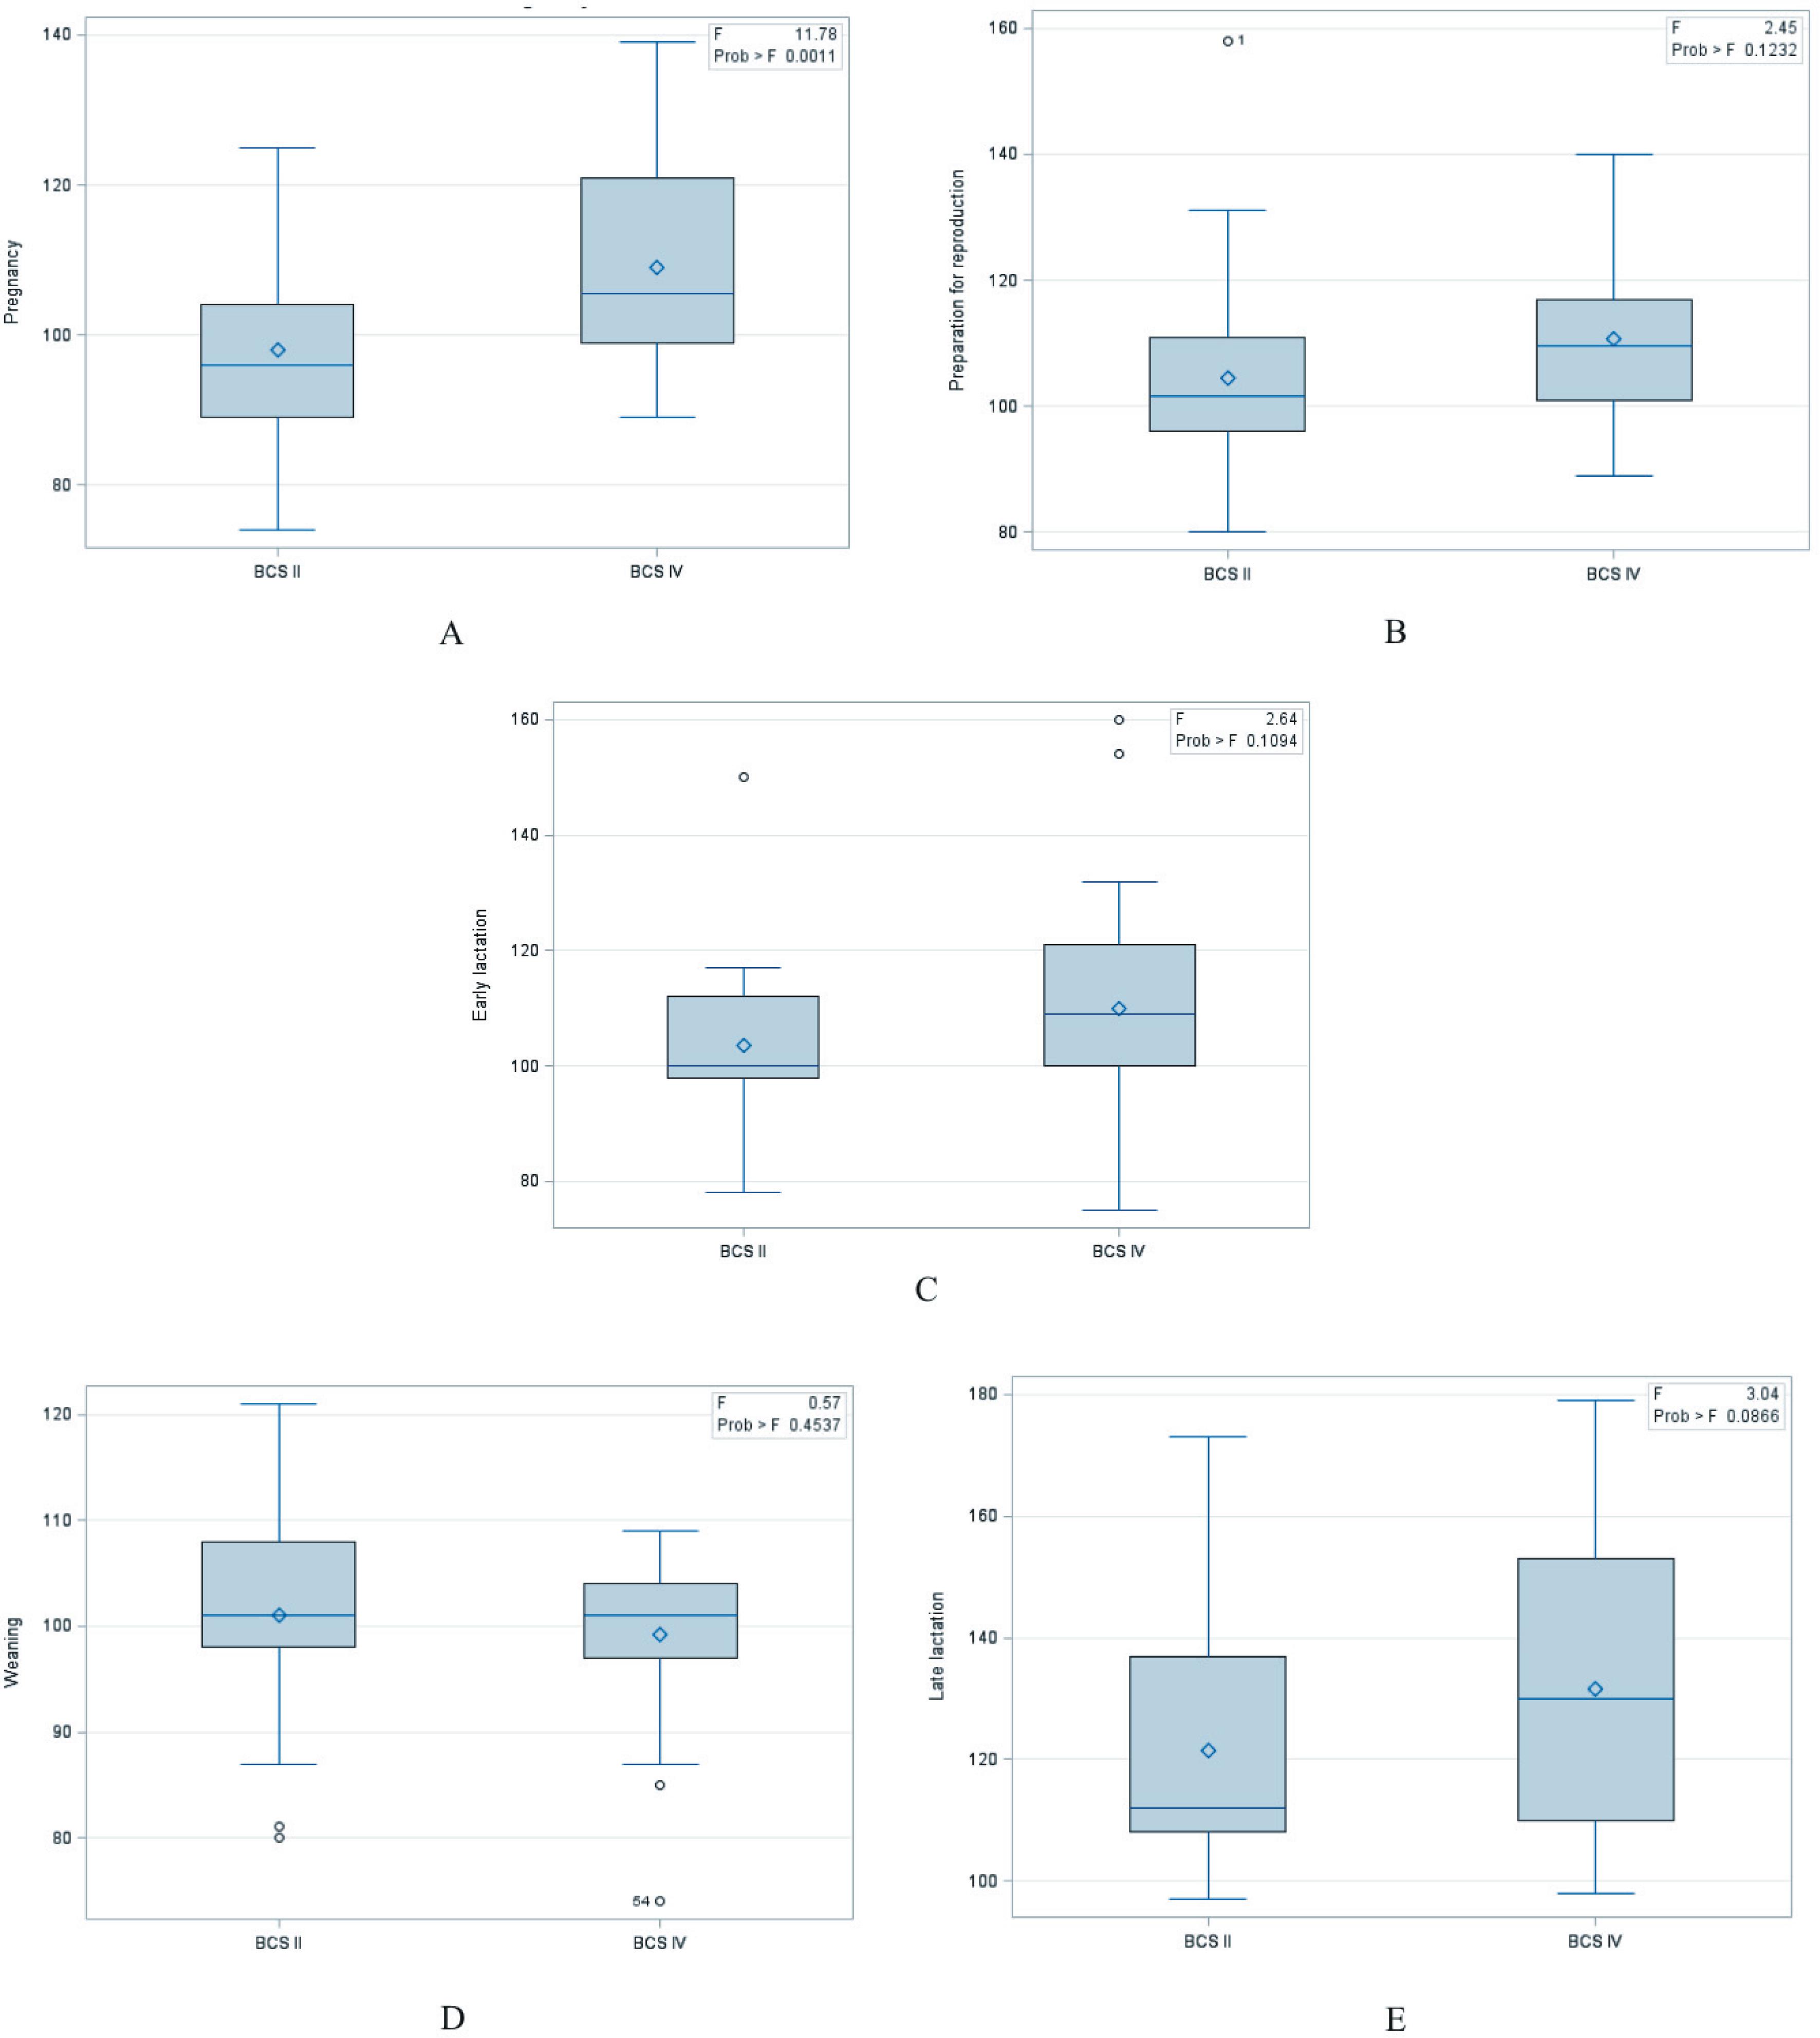
Average values of glucose in plasma varied within a wide range from 98.00 to 131.57 mg dL−1 (Table 2) and were characterized by large inter-individual variability (Figure 3). In the perinatal period, significant differences were observed in plasma glucose levels for all groups during the late lactation. The mean plasma glucose level in all minks was the highest in late lactation and differed significantly from other periods. Statistically significant differences were found in relation to females of the BCS II and BCS IV, in the pregnancy (P = 0.0011) (Table 3 and Figure 4). In the group BCS II, plasma glucose level in the preparation for reproduction period was significantly positively correlated with the period of late lactation (0.3950; P = 0.0007) and positively correlated with the early lactation period (0.3087; P = 0.7982) (Table 5).
Mean values of glucose (Glu; mg dL−1) in plasma of BCS II and BCS IV minks (n = 30) during the perinatal period.
BCS - body condition score.
BCS II: lean, with 922.3±15.6 g of body weight; BCS IV: thick, with 1315±12.1 g of body weight.
Mean values of blood glucose (Glu; mg dL−1) in plasma of BCS II and BCS IV minks (n = 30) during the perinatal period.
BCS - body condition score.
BCS II: lean, with 922.3±15.6 g of body weight; BCS IV: thick, with 1315±12.1 g of body weight.
Correlations for glucose in plasma of groups BCS II and IV at various stages of the perinatal period of minks (n = 30)
Average concentrations of HbA1C reached values from 3.64 to 5.17%. The mean values of HbA1C distribution differed significantly between the groups BCS II and BCS IV in preparation for reproduction (0.0012) and late lactation (0.0048) (Table 6). In BCS II over the perinatal period, the lowest levels were noted in preparation for reproduction and weaning. They were not statistically significant, but differed from pregnancy, early lactation, and late lactation. In BCS IV, concentrations of HbA1C increased in pregnancy and early lactation in relation to preparation for reproduction, but were not statistically significant in those first three periods. In late lactation, there was a statistically significant decrease compared with earlier periods (Table 6). In BCS II, a negative correlation was noted between the preparation for reproduction and pregnancy (−0.3500; P = 0.5790) while a strongly positive correlation was observed between early lactation and late lactation (0.3860; P<0.0001). A positive correlation between preparation for reproduction and pregnancy (0.3027; P = 0.2853) and with weaning (0.5368; P = 0.3891) and strongly significant positive correlation between preparation for reproduction and early lactation (0.3514; P = 0.0164) were also noted for BCS IV (Table 7).
Average values and standard deviations (mean±SD) of glycated hemoglobin HbA1C (%) over the reproductive period of minks (n = 30)
Discussion
Within pregnancy, complexed endocrine-metabolic adaptation processes, which include impaired insulin sensitivity, increased β-cell response, increased blood glucose levels, as well as changes in the levels of circulating free fatty acids, triglycerides, cholesterol, and phospholipids, occur. The changes mentioned above are not seen as a pathological condition, but as the essential process of adaptation of the maternal organism to energy demands of fetus, delivery, and lactation. Insulin resistance develops during the second and third trimesters of pregnancy and it is this state that makes pregnancy a diabetogenic condition. Despite this, only 3 to 5% of women develop gestational diabetes. The glucose homeostasis is usually restored soon after the delivery or at the cessation of lactation (Di Cianni et al., 2003Di Cianni, G.; Miccoli, R.; Volpe, L.; Lencioni, C. and Del Prato, S. 2003. Intermediate metabolism in normal pregnancy and in gestational diabetes. Diabetes/Metabolism Research and Reviews 19:259-270.).
Our results indicate that a great number of females in perinatal period, particularly thick (BCS IV), showed glycosuria. Hynes et al. (2004)Hynes, A. M. J.; Rouvinen-Watt, K. and Armstrong D. 2004. Body condition and glycemic control in mink females during reproduction and lactation. Scientifur 28:79-86. also observed glucosuria in mink dams at all stages of the reproductive cycle. Detected values were either 50 or 150 mg dL−1. However, throughout reproduction and lactation, urine glucose values between 50 and 500 mg dL−1 were detected in the black-type females, but the sugar in urine appeared more frequently in brown-type females. Hynes and Rouvinen-Watt (2007b)Hynes, A. M. J. and Rouvinen-Watt, K. 2007b. Monitoring blood glucose levels in female mink during the reproductive cycle: 2. Effects of short-term fish oil, chromium picolinate, and acetylsalicylic acid supplementation during late lactation. The Canadian Journal of Veterinary Research 71:249-255., in another research, observed mean blood glucose values in females during four to six weeks of lactation, at 3.8±0.8 to 9.9±0.8 mmol L−1. The mink dams were classified by the blood glucose concentrations as normoglycemic (concentration < 5.5 mmol l−1) or hyperglycemic (concentration ≥ 5.5 mmol L−1). Wamberg et al. (1992)Wamberg, S.; Clausen, T. N.; Olesen, C. R. and Hansen, O. 1992. Nursing Sickness in lactating mink (Mustela vison). II. Pathophysiology and changes in body fluid composition. Canadian Journal of Veterinary Research 56:95-101., in their study, found average blood glucose levels for healthy lactating females as 5.3±0.3 mmol L−1 (95.4±5.3 mg dL−1).
Fink and Børsting (2002)Fink, R. and Børsting, C. F. 2002. Quantitative glucose metabolism in lactating mink (Mustela vison) - effects of dietary levels of protein, fat and carbohydrates. Acta Agriculturae Scandinavica, Section A, Animal Science 52:34-42. suggested that uncontrollable gluconeogenesis causes hyperglycemia in female minks during lactation. Therefore, the older mink dams may be more prone to poor glycemic regulation due to their higher demands for hepatic glucose production in support of the higher milk production, as well as increased hepatic glucose output caused by their heavier body condition. In our study, obtained plasma glucose and glucose in urine concentrations during late lactation were 121.57 mg dL−1 (6.8 mmol L−1) and 124.57 mg dL−1 (6.97 mmol L−1) for BCS II and 131.57 mg dL−1 (7.35 mmol L−1) and 132.40 mg dL−1 (7.41 mmol L−1) for BCS IV. Similar results were obtained by Hynes et al. (2004)Hynes, A. M. J.; Rouvinen-Watt, K. and Armstrong D. 2004. Body condition and glycemic control in mink females during reproduction and lactation. Scientifur 28:79-86.. The authors also noted the decrease of plasma glucose concentration from 6.8 mmol L−1, in late lactation, to 5.9 mmol L−1, after weaning. Hynes and Rouvinen-Watt (2007b)Hynes, A. M. J. and Rouvinen-Watt, K. 2007b. Monitoring blood glucose levels in female mink during the reproductive cycle: 2. Effects of short-term fish oil, chromium picolinate, and acetylsalicylic acid supplementation during late lactation. The Canadian Journal of Veterinary Research 71:249-255. observed that in late lactation, blood glucose levels were significantly higher among mink dams that early in the nursing period had shown elevated blood glucose levels in comparison with females that had normal levels at that time. It seems that the hyperglycemia observed during late lactation is a transitory condition and may be reversed after the stresses of nursing and weaning have been eliminated. Nevertheless, it should be noted that with the increased concentration of glucose in urine, nursing females are at higher risk for dehydration and energy loss (Hynes et al., 2004Hynes, A. M. J.; Rouvinen-Watt, K. and Armstrong D. 2004. Body condition and glycemic control in mink females during reproduction and lactation. Scientifur 28:79-86.).
Ullman-Cullere and Foltz (1999)Ullman-Cullere, M. H. and Foltz, C. H. J. 1999. Body condition scoring: a rapid and accurate method for assessing health status in mice. Laboratory Animal Science 49:319-323. found a high correlation between BCS and the body mass of minks – heavier minks had worse condition and health; therefore, BCS, just like BMI (body mass index) in humans, seems to be an important indicator in the evaluation of health of animals with tendency to obesity (Bryl et al., 2016Bryl, M.; Bis-Wencel, H.; Ślaska, B.; Nowakowicz-Dębek, B.; Bełkot, Z. and Kubik-Komar, A. 2016. Relationship between body weight and leptin concentrations in mink dams and birth parameters of kits. Medycyna Weterynaryjna 72:755-759.). According to Lebovitz (1999)Lebovitz, H. E. 1999. Type 2 diabetes: an overview. Clinical Chemistry 458(B):1339-1345., children with low birth weight have increased predominance of obesity, insulin resistance, and type II diabetes in adult life. These facts show that insulin resistance and type II diabetes may be the consequences of fetal malnutrition. In the Mustonen et al. (2005)Mustonen, A. M.; Pyykönen, T.; Paakkonen, T.; Ryökkynen, A.; Asikainen, J.; Aho, J.; Mononen, J. and Nieminen, P. 2005. Adaptations to fasting in the American mink (Mustela vison): carbohydrate and lipid metabolism. Comparative Biochemistry and Physiology 140:195-202. experiment, the effect of seven-day fasting on blood glucose levels of minks of the brown variety was investigated. Despite starving, normoglycemia was found in those animals. In minks, the development of hyperglycemia and hyperinsulinemia and insulin resistance is the potentially possible effect of both obesity and cachexia. This suggests that hyperglycemia observed in minks may be a transition state associated with lactation and that it is reversible. The causative factor may be the elimination of irregularities resulting from poorly balanced nutrition. It appears that combination of factors such as obesity, deficiency of n-3 polyunsaturated fatty acids (PUFA), lipodystrophy (deficiency of body fat), and oxidative stress may exacerbate metabolic response in mink dams (Hynes and Rouvinen-Watt 2007bHynes, A. M. J. and Rouvinen-Watt, K. 2007b. Monitoring blood glucose levels in female mink during the reproductive cycle: 2. Effects of short-term fish oil, chromium picolinate, and acetylsalicylic acid supplementation during late lactation. The Canadian Journal of Veterinary Research 71:249-255.) and with evidence of poor glucose regulation in mink females before lactation, the preventive measures should be taken throughout the year. In addition, further research concerning long-term dietary strategies helpful in blood glucose regulation in mink females during the fall should be conducted and help in maintaining normoglycemia through pregnancy and lactation should be provided (Hynes and Rouvinen-Watt, 2007bHynes, A. M. J. and Rouvinen-Watt, K. 2007b. Monitoring blood glucose levels in female mink during the reproductive cycle: 2. Effects of short-term fish oil, chromium picolinate, and acetylsalicylic acid supplementation during late lactation. The Canadian Journal of Veterinary Research 71:249-255.).
Studies of HbA1C concentration in blood of cats (Elliott et al., 1997Elliott, D. A.; Nelson, R. W.; Feldman, E. C. and Neal, L. A. 1997. Glycosylated hemoglobin concentration for assessment of glycemic control in diabetic cats. Journal of Veterinary Internal Medicine 3:161-165.) indicate that concentrations of the indicator are significantly bigger in cats with diabetes compared with healthy individuals. In addition, the concentration of HbA1C decreases when glycemic control in individuals with diabetes improves or when the cats are back from insulin-dependent to non-insulin-dependent state of diabetes. These findings are similar to those recorded for people and dogs, which further suggests, as stressed by Elliott et al. (1997)Elliott, D. A.; Nelson, R. W.; Feldman, E. C. and Neal, L. A. 1997. Glycosylated hemoglobin concentration for assessment of glycemic control in diabetic cats. Journal of Veterinary Internal Medicine 3:161-165., that the concentration of HbA1C may be the clinically useful test for monitoring glycemic control in diabetic animals. Since HbA1C is a retrospective indicator in humans and in animals, it is possible to control the average value of blood glucose at the end of the period of erythrocyte survival, i.e., of 8-12 weeks for dogs and of 5-6 for cats. Various circumstances and diseases that change the survival time of erythrocytes may understate or overstate the results of HbA1C determinations. Accordingly, in the states with shortened survival of red blood cells (hemolytic anemia), it comes to an underestimation of the percentage of HbA1C. Extension of the activity of hemoglobin (e.g., in anemia/deficiency) will overestimate the result (Abhyuday et al., 2009Abhyuday, V.; Muthukrishnan, J.; Harikumar, K. V. S. and Modi, K. D. 2009. HbA1C and average blood glucose. Calicut Medical Journal 1:1-5.; Higgins, 2012Higgins, T. 2012. HbA1C - An analyte of increasing importance. Clinical Biochemistry 45:1038-1045.). Diabetes is diagnosed based on blood glucose test results (Abhyuday et al., 2009Abhyuday, V.; Muthukrishnan, J.; Harikumar, K. V. S. and Modi, K. D. 2009. HbA1C and average blood glucose. Calicut Medical Journal 1:1-5.; Herman and Fajans, 2010Herman, W. H. and Fajans, S. S. 2010. Hemoglobin A1C for the diagnosis of diabetes. Polskie Archiwum Medycyny Wewnętrznej 120:37-40.). In addition, certain complications of diabetes, such as diabetic nephropathy, may also contribute to a change in HbA1C test results in both women and pregnant females of other species (Królikowska et al., 2002Królikowska, B.; Olszewski, J.; Konarzewska, J.; Łukaszuk, K. and Wójcikowski, C. Z. 2002. Ocena stężenia lipidów u kobiet z cukrzycą ciążową. Diabetologia Kliniczna 2:129-132.; Herman and Fajans 2010Herman, W. H. and Fajans, S. S. 2010. Hemoglobin A1C for the diagnosis of diabetes. Polskie Archiwum Medycyny Wewnętrznej 120:37-40.; Sarmah and Sharma, 2012Sarmah, D. and Sharma, B. 2012. Importance and status of HBA1C in T2DM and its Indian perspective. Asian Journal of Biomedical and Pharmaceutical Sciences 2:1-10.). This is attributed to decreased survival of red blood cells during the period of pregnancy. According to Sarmah and Sharma (2012)Sarmah, D. and Sharma, B. 2012. Importance and status of HBA1C in T2DM and its Indian perspective. Asian Journal of Biomedical and Pharmaceutical Sciences 2:1-10., pregnancy lowers plasma glucose level partly by fetal transferring and partly due to the supply of fat and glycogen, which are used during the late period of pregnancy. As the erythrocytes are exposed to a lower average glucose level, the glycation of hemoglobin is smaller. The percentage of HbA1C may depend on membership of a given race and may increase with the age of the test object, although the significance of these differences has never been explained.
Conclusions
The aim of the prevention and treatment of diabetes is to obtain the status of carbohydrate metabolism close to normoglycemia. The few studies on this topic in mink and research in other species, including representatives of the Mustelidae family suggest that the mechanism of disorders of homeostasis in minks, particularly during the perinatal period and lactation, involves insulin resistance with hyperglycemia as the main feature. That is why HbA1C is a useful test for monitoring glycemic control in diabetic animals and animals with impaired glycemic control in conjunction with a physical examination, changes in body weight, and with multiple blood glucose determinations.
References
- Abhyuday, V.; Muthukrishnan, J.; Harikumar, K. V. S. and Modi, K. D. 2009. HbA1C and average blood glucose. Calicut Medical Journal 1:1-5.
- Behrend, E. N. 2002. Diabetes mellitus: an update on oral hypoglycemic agents and monitoring agents. Veterinary Medicine 97:743-751.
- Berestov, V. 1989. Carbohydrates. p.64-65. In: Haematology and clinical chemistry of fur animals. 1st ed. Brandt, A., ed. Scientifur, Jyvväskylä, Finland.
- Bis-Wencel, H.; Nordryn-Płotnicki, Z.; Saba, L.; Zoń, A.; Kopczewski, A. and Sroka, A. 2006. Wpływ konserwantów na obraz histopatologiczny narządów wewnętrznych norek. Medycyna Weterynaryjna 62:70-73.
- Bryl, M.; Bis-Wencel, H.; Ślaska, B.; Nowakowicz-Dębek, B.; Bełkot, Z. and Kubik-Komar, A. 2016. Relationship between body weight and leptin concentrations in mink dams and birth parameters of kits. Medycyna Weterynaryjna 72:755-759.
- Clausen, T. N.; Olesen, R.; Hansen, O. and Wamberg, S. 1992. Nursing sickness in lactating mink (Mustela vison). I. Epidemiological and pathological observations. Canadian Journal of Veterinary Research 56:89-94.
- Clausen, T. N.; Wamberg, S. and Hansen, O. 1996. Incidence of nursing sickness and biochemical observations in lactating mink with and without dietary salt supplementation. Canadian Journal of Veterinary Research 60:271-276.
- Di Cianni, G.; Miccoli, R.; Volpe, L.; Lencioni, C. and Del Prato, S. 2003. Intermediate metabolism in normal pregnancy and in gestational diabetes. Diabetes/Metabolism Research and Reviews 19:259-270.
- Elliott, D. A.; Nelson, R. W.; Feldman, E. C. and Neal, L. A. 1997. Glycosylated hemoglobin concentration for assessment of glycemic control in diabetic cats. Journal of Veterinary Internal Medicine 3:161-165.
- Finley, G.; Mason, G.; Pajor, E.; Rouvinen-Watt, K. and Rankin, K. 2012. Code of practice for the care and handling of mink: review of scientific research on priority issues. National Farm Animal Care Council, Lacombe, AB, Canada.
- Fink, R. and Børsting, C. F. 2002. Quantitative glucose metabolism in lactating mink (Mustela vison) - effects of dietary levels of protein, fat and carbohydrates. Acta Agriculturae Scandinavica, Section A, Animal Science 52:34-42.
- Gugołek, A. 2011. Zalecenia żywieniowe i wartość pokarmowa pasz. Zwierzęta futerkowe. Instytut Fizjologii i Żywienia Zwierząt, Jabłonna. p.68-69.
- Herman, W. H. and Fajans, S. S. 2010. Hemoglobin A1C for the diagnosis of diabetes. Polskie Archiwum Medycyny Wewnętrznej 120:37-40.
- Higgins, T. 2012. HbA1C - An analyte of increasing importance. Clinical Biochemistry 45:1038-1045.
- Hynes, A. M. J.; Rouvinen-Watt, K. and Armstrong D. 2004. Body condition and glycemic control in mink females during reproduction and lactation. Scientifur 28:79-86.
- Hynes, A. M. J. and Rouvinen-Watt, K. 2007a. Monitoring blood glucose levels in female mink during the reproductive cycle: 1. Prevention of hyperglycemia during the nursing period. The Canadian Journal of Veterinary Research 71:241-248.
- Hynes, A. M. J. and Rouvinen-Watt, K. 2007b. Monitoring blood glucose levels in female mink during the reproductive cycle: 2. Effects of short-term fish oil, chromium picolinate, and acetylsalicylic acid supplementation during late lactation. The Canadian Journal of Veterinary Research 71:249-255.
- Królikowska, B.; Olszewski, J.; Konarzewska, J.; Łukaszuk, K. and Wójcikowski, C. Z. 2002. Ocena stężenia lipidów u kobiet z cukrzycą ciążową. Diabetologia Kliniczna 2:129-132.
- Lagerkvist, G.; Johansson, K. and Lundeheim, N. 1993. Selection for litter size, body weight, and pelt quality in mink (Mustela vison): experimental design and direct response of each trait. Journal of Animal Science 71:3261-3272.
- Lebovitz, H. E. 1999. Type 2 diabetes: an overview. Clinical Chemistry 458(B):1339-1345.
- Manjunatha Goud, B. K.; Sarsina Devi, O.; Bhavna, N.; Shivashanker, S.; Sathisha, T. G. and Devaki, R. N. 2011. An overview of diabetes mellitus with emphasis on biochemical and clinical management. International Journal of Pharmaceutical Sciences Review and Research 8:96-100.
- Mustonen, A. M.; Pyykönen, T.; Paakkonen, T.; Ryökkynen, A.; Asikainen, J.; Aho, J.; Mononen, J. and Nieminen, P. 2005. Adaptations to fasting in the American mink (Mustela vison): carbohydrate and lipid metabolism. Comparative Biochemistry and Physiology 140:195-202.
- Rand, J. S.; Fleeman, L. M.; Farrow, H. A.; Appleton, D. J. and Lederer, R. 2004. Canine and feline diabetes mellitus: Nature or nurture? Journal of Nutrition 134:2072S-2080S.
- Rouvinen-Watt, K. 2008. Recent progress in research program activities. Fur Animal Research 16:196-198.
- Sarmah, D. and Sharma, B. 2012. Importance and status of HBA1C in T2DM and its Indian perspective. Asian Journal of Biomedical and Pharmaceutical Sciences 2:1-10.
- Shearer, P. 2010. Literature review - canine, feline and human overweight and obesity. Bark - Banfield Applied Research and Knowledge team. p.1-8.
- Sławoń, J. 1986. Żywienie lisów i norek. PWRiL, Warszawa.
- Ullman-Cullere, M. H. and Foltz, C. H. J. 1999. Body condition scoring: a rapid and accurate method for assessing health status in mice. Laboratory Animal Science 49:319-323.
- Wamberg, S.; Clausen, T. N.; Olesen, C. R. and Hansen, O. 1992. Nursing Sickness in lactating mink (Mustela vison). II. Pathophysiology and changes in body fluid composition. Canadian Journal of Veterinary Research 56:95-101.
Publication Dates
-
Publication in this collection
2018
History
-
Received
02 Jan 2017 -
Accepted
15 Aug 2017