Abstract
In this study, a ground anchored wall located in Belo Horizonte containing 295 anchorages in a sandy silt soil was analyzed. The load capacity of all the anchors was calculated by extrapolation of the receipt tests by the Van der Veen method through the CsAGeo web application. The shear strength in the soil-anchor interface was obtained from a semi-empirical method. Two criteria to analyze the extrapolated curves of Van der Veen were used. In the first criteria, the shear strengths of all the extrapolated curves were calculated. In the second criteria, only those curves from the extrapolations considered as reliable were used to calculate the shear strengths. The main objective of this work is to set up the value of shear strength at the soil-anchor interface through extrapolation of the mathematical and semi-empirical methods. The semi-empirical method was carried out in soil and executive methodology equal to the work analysed, which increases the accuracy of these values contributing to containments using anchors. The results were grouped according to the ranges of the penetration resistance (NSPT). An increasing tendency was identified in the shear strength as the value of the resistance to penetration increased. In addition, the linear tendency was observed for the reliable curves.
Keywords:
anchor; load capacity; shear strength
1. Introduction
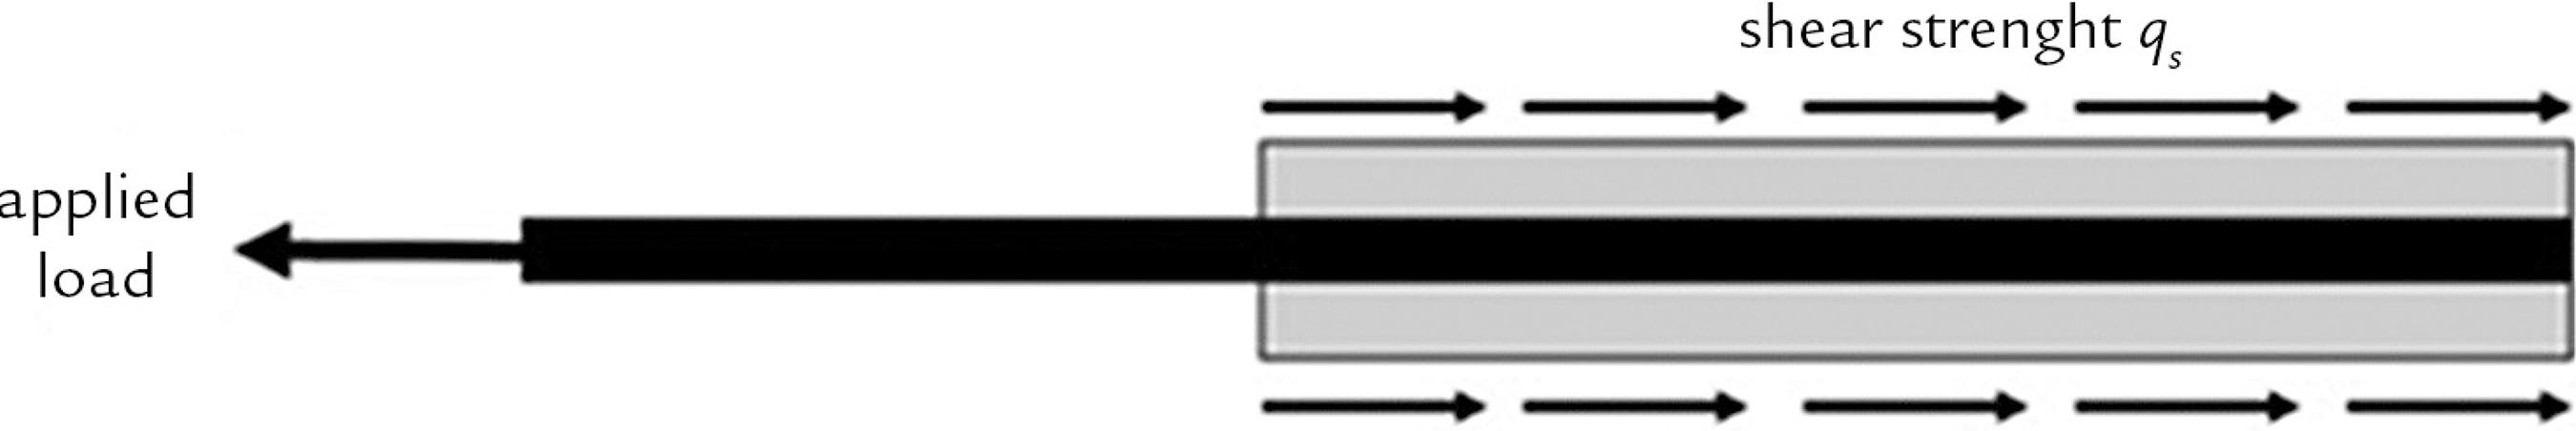
In the execution of pre-stressed and re-injectible anchors, a load of pre-defined magnitude is applied, generating a shear strength between the soil and the anchor as shown in Figure 1. The shear strength developed at the soil-anchor interface contributes to the soil stability in which it is anchored. The value of this parameter is influenced by the properties and characteristics of the anchor set and the used methodology, making it non-trivial and difficult to determine parameters.
Mechanical representation of applied load transfer and development of shear strength at the soil-anchor interface (Souza, 2001SOUZA, R. N. Ancoragens reinjetáveis e protendidas em solo: previsão de comportamento e controle de execução. São Paulo: Escola Politécnica da Universidade de São Paulo, 2001. 331p. (Tese Doutorado em Engenharia Civil).).
The shear strength (qs) developed at the soil-anchor interface can be estimated from experimental observations of the soil area with similar geomechanical characteristics. Some engineers, in the absence of experience, estimate this value through empirical correlations from literature. Consequently, the correlations may be elaborated under specific conditions that are not representative. As a result, they provide results that do not reproduce the reality for the soil type at the analyzed region, which produces imprecise results.
One of the best ways to determine the shear strength is through the field load tests, and recalculating the design. However, in practice, the value of this parameter is not determined by the execution of load tests during the construction. Due to the variability of the shear strength as a function of the soil type, conditions, and used methodology, it is not possible to establish a simple correlation to determine the value of this parameter. The shear strength determination from the NBR 5629 tests (ABNT, 2006ASSOCIAÇÃO BRASILEIRA DE NORMAS TÉCNICAS. NBR 5629: execução de tirantes ancorados no terreno. Rio de Janeiro, 2006.) - qualification, receipt and fluency - is indispensable for the evaluation of the shear strength at the soil-anchor interface.
Several studies have been carried out to obtain correlations between the value of shear strength and its variables. Liang e Feng (2002)LIANG, R., FENG, Y., L. Development and application of anchor soil interface models. Soils and Foundations, v.42, n.2, p.59-70, 2002. claim that understanding the anchor-soil interface behavior, and consequently the shear strenght, is essential in order to predict the deformation of the prestressed anchor system in working load terms. Hanna (1982)HANNA, T. H. Foundations in tension. Ground anchors. Sheffield, England: Trans Tech Publications and McGraw-Hill Book Company, 1982., Barley (1997)BARLEY, A.D. The single bore multiple anchor system. In: Proc. INT. CONF.: GROUND ANCHORAGES AND ANCHORED STRUCTURES. London, p. 65-75, 1997., Woods and Barkhordari (1997)WOODS R. I., BARKHORDARI, K. , The influence of bond stress distribution on ground anchor design. In: PROC. OF INT. CONF. GROUND ANCHORAGES AND ANCHORAGES STRUCTURES. London, p. 55-64, 1997. studied the physical-mathematical relationship between the shear strength developed at the interface and the bulb displacement. Ortigão (1997)ORTIGÃO, J.A.R. Ensaios de arrancamento para projetos de solo grampeado. Nota Técnica, Revista Solos e Rochas, ABMS, v. 20, n.1, p. 39-43, 1997. presented results of pullout tests correlated with Nspt values. Thus, the performance of nails as a function of shear strength can be evaluated in the initial stages of a work, before performing in situ tests. Skrabl (2004)SKRABL, S. Prestressed ground anchors of variable stiffness: patent number 21320. Ljubljana : SIPO, 2004. (In Slovene). evaluated the relationship between the amount of steel and the shear strength. Barley (1997)BARLEY, A.D. The single bore multiple anchor system. In: Proc. INT. CONF.: GROUND ANCHORAGES AND ANCHORED STRUCTURES. London, p. 65-75, 1997. and Alonso (2015)ALONSO, U. R. Comissão de revisão da atual NBR 5629, CE-02:152.10. ABEF, São Paulo, SP, 2015. analyzed the influence of the number of bulbs. Proto Silva (2005)PROTO SILVA, T. Resistência ao arrancamento de grampos em solo residual de gnaisse. Tese de M.Sc., Rio de Janeiro, RJ, Brasil: DEC/PUC-Rio, 2005. p. 140. CM. SC.)., studied the shear strength of nails in residual gneiss soil. From direct laboratory shear tests, the author proposed a semi-empirical relationship for the evaluation of this parameter. Springer (2006SPRINGER, F. O. Ensaios de arrancamento de grampos em solo residual de gnaisse. Belo Horizonte, MG, Brasil: DEC/PUC-Rio, 2006. p. 310. (Tese de Doutorado).) correlated the tensile-strain behavior and shear strength as a function of the method of execution, considering the number of injections, the wash of the hole, the cure time of the cement slurry and the soil. Erlich and Silva (2012)EHRLICH, M., SILVA, R. C. Resistência ao arrancamento de grampos-análise da influência do NSPT e da injeção da bainha nos resultados. In: CONGRESSO BRASILEIRO DE MECÂNICA DOS SOLOS E ENGENHARIA GEOTÉCNICA, 16. Porto de Galinhas, Brasil, 2012. analyzed the results of pull-out tests and found correlations between shear strength, Nspt and number of injections. Porto (2015)PORTO, T. B. Comportamento geotécnico e metodologia via web para previsão e controle. Ouro Preto, MG, Brasil: Universidade Federal de Ouro Preto, Núcleo de Geotecnia, 2015. p.482. (Tese de Doutorado em Geotecnia). and Porto et al. (2017)PORTO, T. B., TORRES, A. C. A., GOMES, R. C. Behavior of reinjectable and prestressed anchors in soil masses: construction case study in Congonhas-Brazil. Soils and rocks, v. 40, n. 2, p. 177-186, 2017. evaluated the relationship with specific load capacity, injection pressure, and injection number.
In this scenario, this study analyzed a work located in Belo Horizonte containing 295 anchorages in a sandy silt soil to calculate the load capacity of all the anchors through the extrapolation of the tests of receipt by the Van der Veen (1953)VAN DER VEEN, C. The bearing capacity of a pile. In: INTERNATIONAL CONFERENCE ON SOIL MECHANICS AND FOUNDATION ENGINEERING, 3. Zurich. In: Proceedings… Zurich, v. 2, p. 84-90, 1953. method and then estimate the value of shear strength to the work in study.
The shear strength values at the soil-anchor interface were calculated from the methodology proposed by Porto (2015)PORTO, T. B. Comportamento geotécnico e metodologia via web para previsão e controle. Ouro Preto, MG, Brasil: Universidade Federal de Ouro Preto, Núcleo de Geotecnia, 2015. p.482. (Tese de Doutorado em Geotecnia).. This methodology was chosen because it was elaborated for conditions closer to those evaluated by the case study. The values obtained were grouped by NSPT range in two distinct groups by the extrapolation types considered. In the first group, all the extrapolations of the curves from the 295 receiving tests were evaluated. In the second group, only the curves considered reliable according to Aoki et al. (2013)AOKI, N. et al. Fundações, ensaios estáticos e dinâmicos. São Paulo: Oficina de Textos, 2013., with 59 extrapolations, were evaluated. Figure 2 summarizes the analysis stages.
All calculations (load capacity by Van der Veen extrapolation and determination of shear strength) were performed through the web application CsAGeo proposed by Martini et al. (2016)MARTINI, B. D., PORTO, T. B., ARAUJO, D. A., GOMES, R. C. (2016). Proposta de metodologia via web para previsão e controle de ancoragens em solos. In: SIMPÓSIO BRASILEIRO DE ENGENHEIROS GEOTÉCNICOS JOVENS, 7. Belo Horizonte, Brasil.. The application allows to (i) catalogue the data from the received test bulletins of all analyzed anchors; (ii) calculate the extrapolated load capacity; and (iii) issue individual reports containing the curves and specific information for each anchor.
The use of the web application in the calculations contributed to the organization, data logging security, information quality, agility and productivity. In addition, it prevented loss or alteration as mentioned by Gouveia et al. (2017)GOUVEIA, J. R., GOUVEIA, G. R., GOMES, R. C., PORTO, T. B. Utilização de ferramenta mobile no controle tecnológico de obras de contenção atirantadas. Belo Horizonte: Consmara Engenharia Ltda, 2017. 21p. (Relatório Técnico Científico)., since the data were stored directly in the software (offline and then transmitted and assured through the generation of reports).
Porto’s Methodology
The methodology proposed by Porto (2015)PORTO, T. B. Comportamento geotécnico e metodologia via web para previsão e controle. Ouro Preto, MG, Brasil: Universidade Federal de Ouro Preto, Núcleo de Geotecnia, 2015. p.482. (Tese de Doutorado em Geotecnia). was based on pre-stress tests developed at the end of the 1970s in the construction of the subway in the city of São Paulo and in other works located at the states of São Paulo and Minas Gerais in the year of 2015, using different methodologies. From the results found and the extrapolation of Van der Veen, Equations 1, 2 and 3 were proposed to calculate the geotechnical load capacity, average bulb diameter, and shear strength at the soil-anchor interface, respectively:
Where: TL =load capacity (kN); DS = average bulb diameter (m); La =length of the anchored parts of the tie rod (m); qs =shear strength at the interface soil-anchor (kN/m2); DP =hole diameter (m); b =bulb increase coefficient due to injection, show in Table 1; k = coefficient of anchorage (kN/m2), show in Table 1, NSPT =number of blows obtained in the Standard Penetration test (SPT).
Values of the increase coefficient β and anchor coefficient k (Porto, 2015PORTO, T. B. Comportamento geotécnico e metodologia via web para previsão e controle. Ouro Preto, MG, Brasil: Universidade Federal de Ouro Preto, Núcleo de Geotecnia, 2015. p.482. (Tese de Doutorado em Geotecnia).).
Extrapolation of Van der Veen (1953)
In this work, the loading line of the received tests were used for the application of Van der Veen (1953)VAN DER VEEN, C. The bearing capacity of a pile. In: INTERNATIONAL CONFERENCE ON SOIL MECHANICS AND FOUNDATION ENGINEERING, 3. Zurich. In: Proceedings… Zurich, v. 2, p. 84-90, 1953. extrapolation and the determination of the load capacity. Similarly, the load-displacement curves obtained by the load tests on the piles can be divided into three regions (Figure 3) and described as follows:
-
The first region (I) presents high proportionality between the loads and displacements. It is characterized as the plastic deformation stretch of the load-displacement curve.
-
The second region (II) has viscoelastic deformation. In this section, studies affirm that the application speed of the load significantly alters the presented displacements.
-
The third region (III) corresponds to the region of rupture in which is defined the maximum load supported by the anchorage (the load capacity).
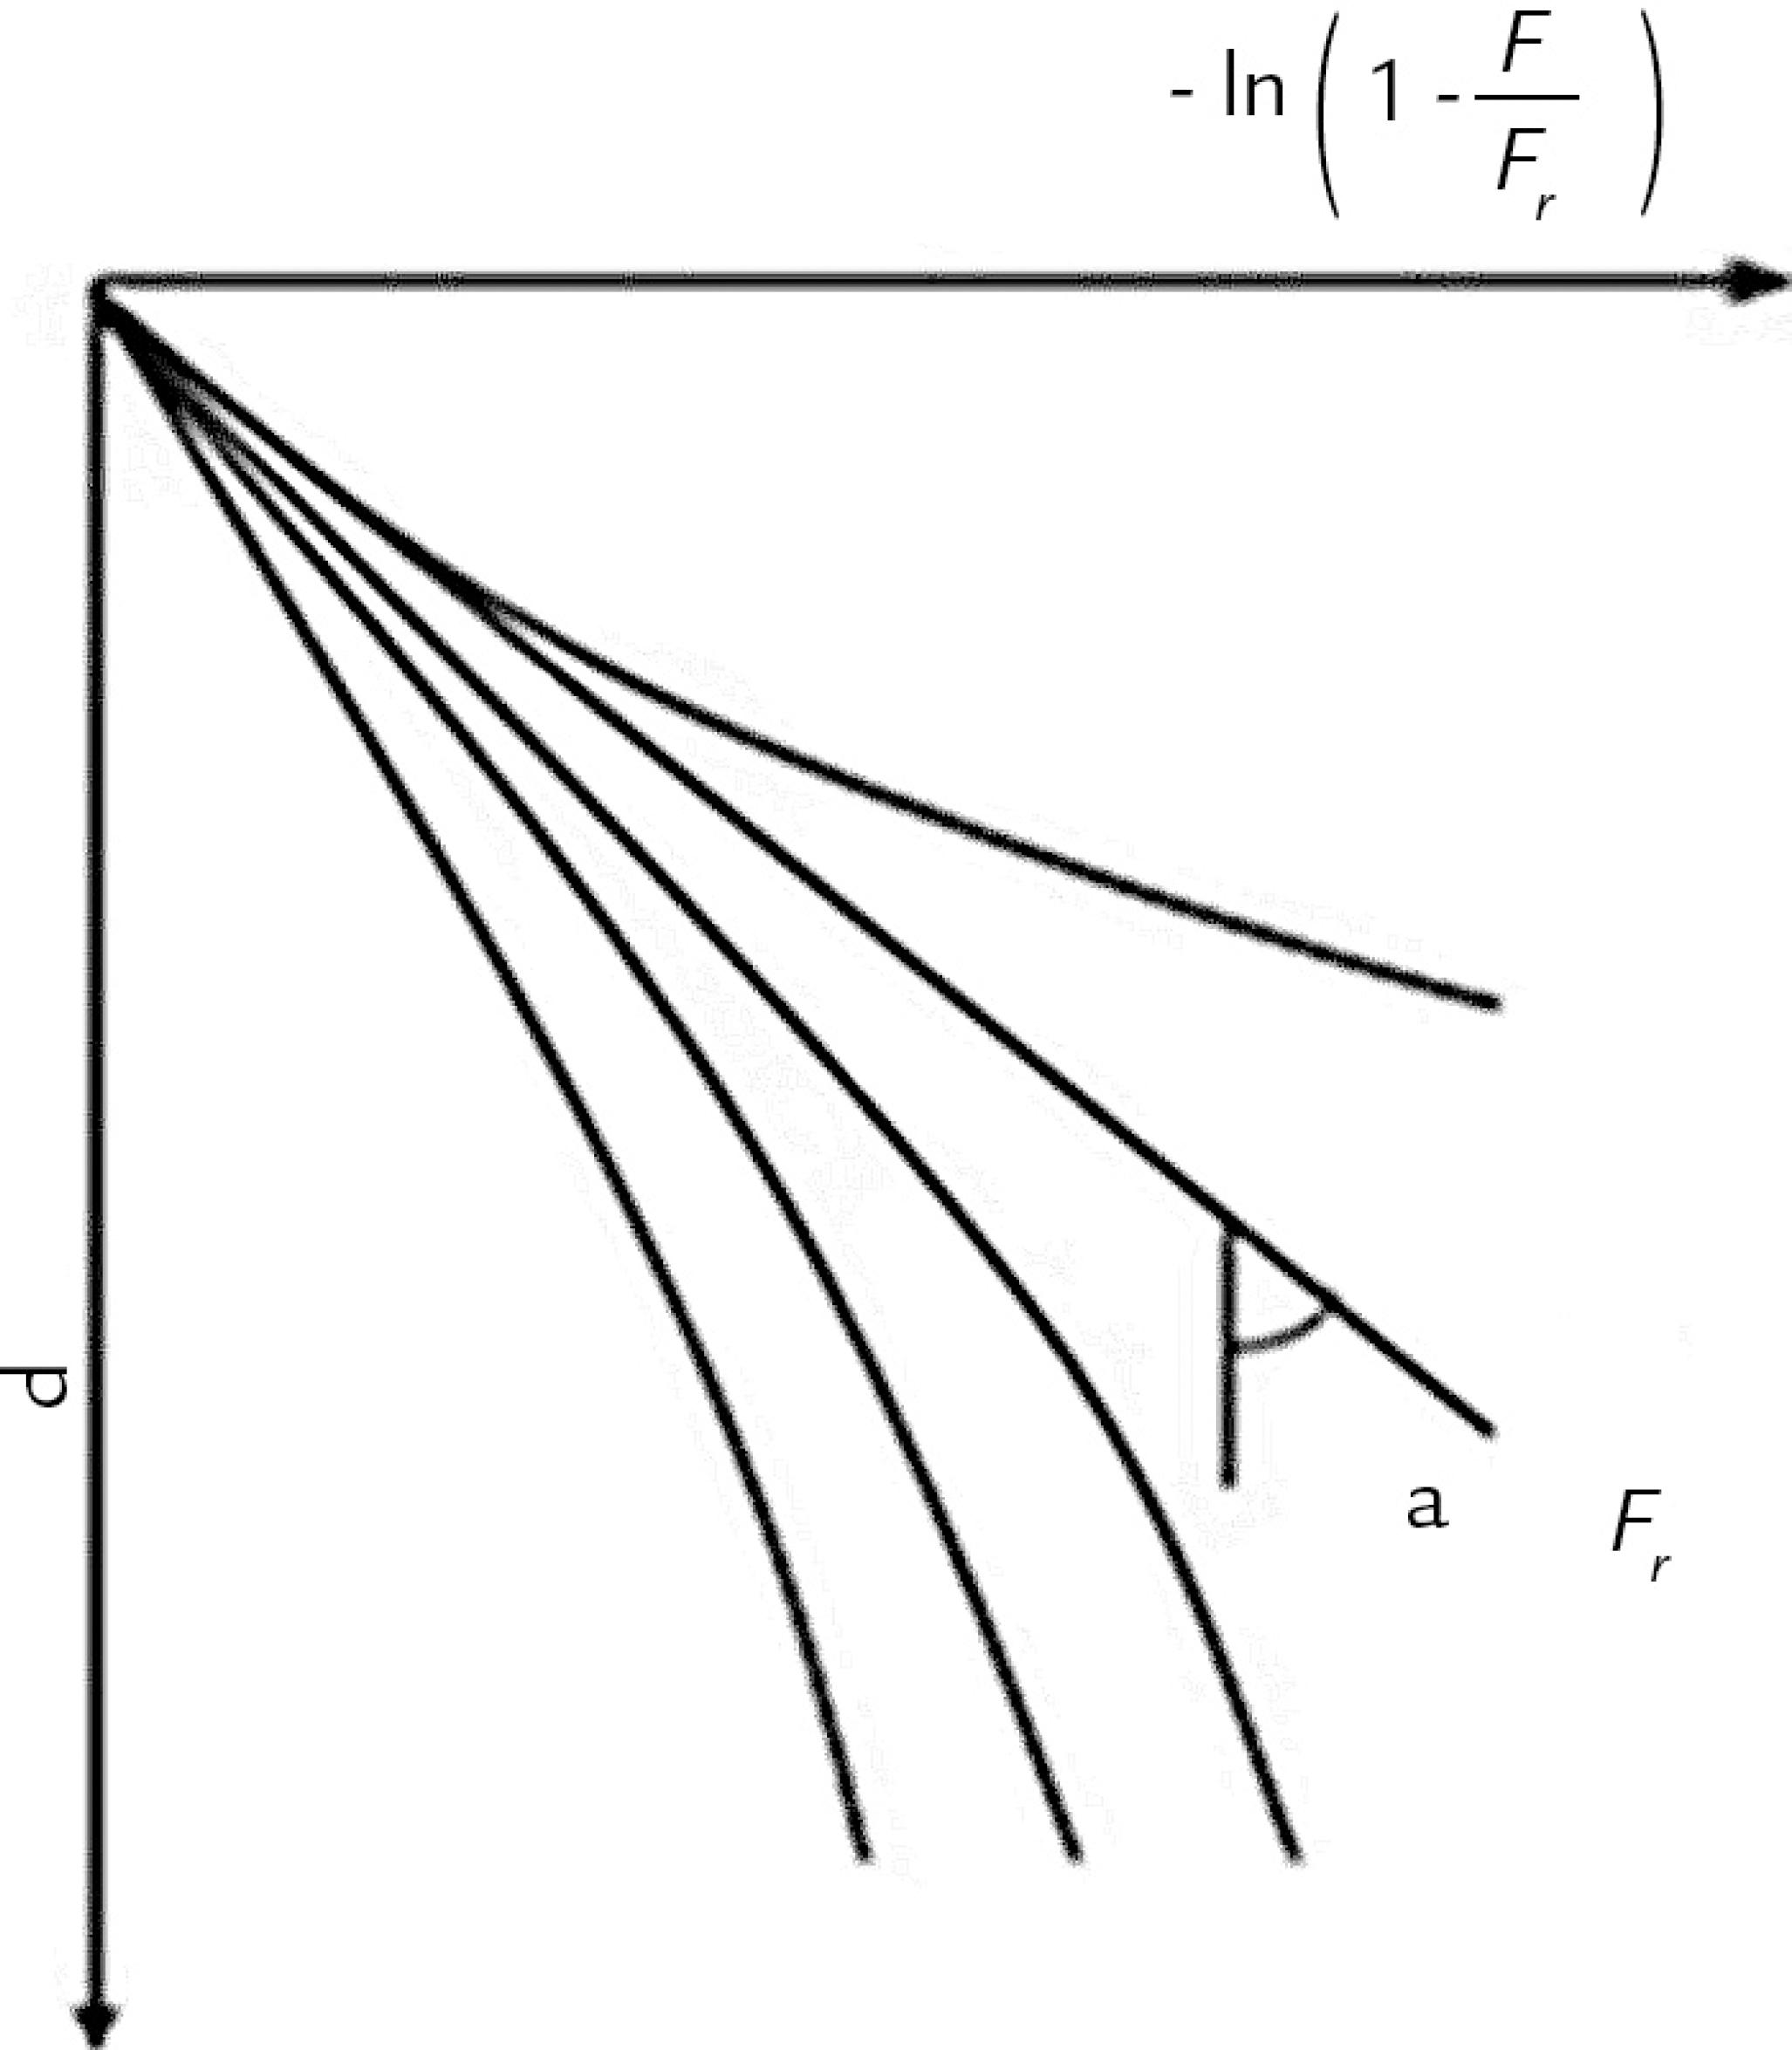
The proposed extrapolation method uses an exponential form, adjusting the points of the load-displacement curve to a mathematical function, analyzing the load capacity at theoretically infinite displacements. Equation 4 obtains the association of the load versus displacement curve:
where F is the load applied at the top of the anchor (kN); FR is the last load corresponding to the vertical asymptote of the curve (kN) and is equal to the TL referred in Equation 1; a is the coefficient that defines the shape of the curve (mm-1); and d is the displacement corresponding to the load (mm).
Equation 4 corresponds to the equation of a line in which a and FR are two constants determined, in a process of attempts, adopting values for F and plotting the corresponding graphs of -ln(1-F/FR) versus d. The curve closest to a straight line will indicate the value of FR (unknown value from the problem). The angular coefficient of this straight line is a as shown in Figure 4.
where b is the intercept in the axis of the displacements of the straight obtained in the semi logarithmic scale.
The coefficient of determination r2 measures the conformity of the extrapolated section with the experimental section. Thus, when its value is close to 1, the proposed model is adjusted to the experimental curve. When adapting to the Van der Veen's equation (1953), the author aimed at a value closer to 1, contributing to a better adjustment of the load-displacement curve, with the intermediate and final points of the loading.
Although the extrapolation proposed by Van der Veen (1953)VAN DER VEEN, C. The bearing capacity of a pile. In: INTERNATIONAL CONFERENCE ON SOIL MECHANICS AND FOUNDATION ENGINEERING, 3. Zurich. In: Proceedings… Zurich, v. 2, p. 84-90, 1953. is a very practical alternative, it should be used with attention. According to Aoki et al. (2013)AOKI, N. et al. Fundações, ensaios estáticos e dinâmicos. São Paulo: Oficina de Textos, 2013., if the determination coefficient is not sufficiently close to 1, the model proposed by Van der Veen (1953)VAN DER VEEN, C. The bearing capacity of a pile. In: INTERNATIONAL CONFERENCE ON SOIL MECHANICS AND FOUNDATION ENGINEERING, 3. Zurich. In: Proceedings… Zurich, v. 2, p. 84-90, 1953. should not be applied to the curve, otherwise the extrapolation will not be valid. Based on this interpretation, the author proposes reliability levels to the extrapolation. Aoki et al. (2013)AOKI, N. et al. Fundações, ensaios estáticos e dinâmicos. São Paulo: Oficina de Textos, 2013. relates the value of the load capacity obtained by extrapolation (FR) with the maximum load applied in the test (Fmáx), according to Table 1.
2. Material and methods
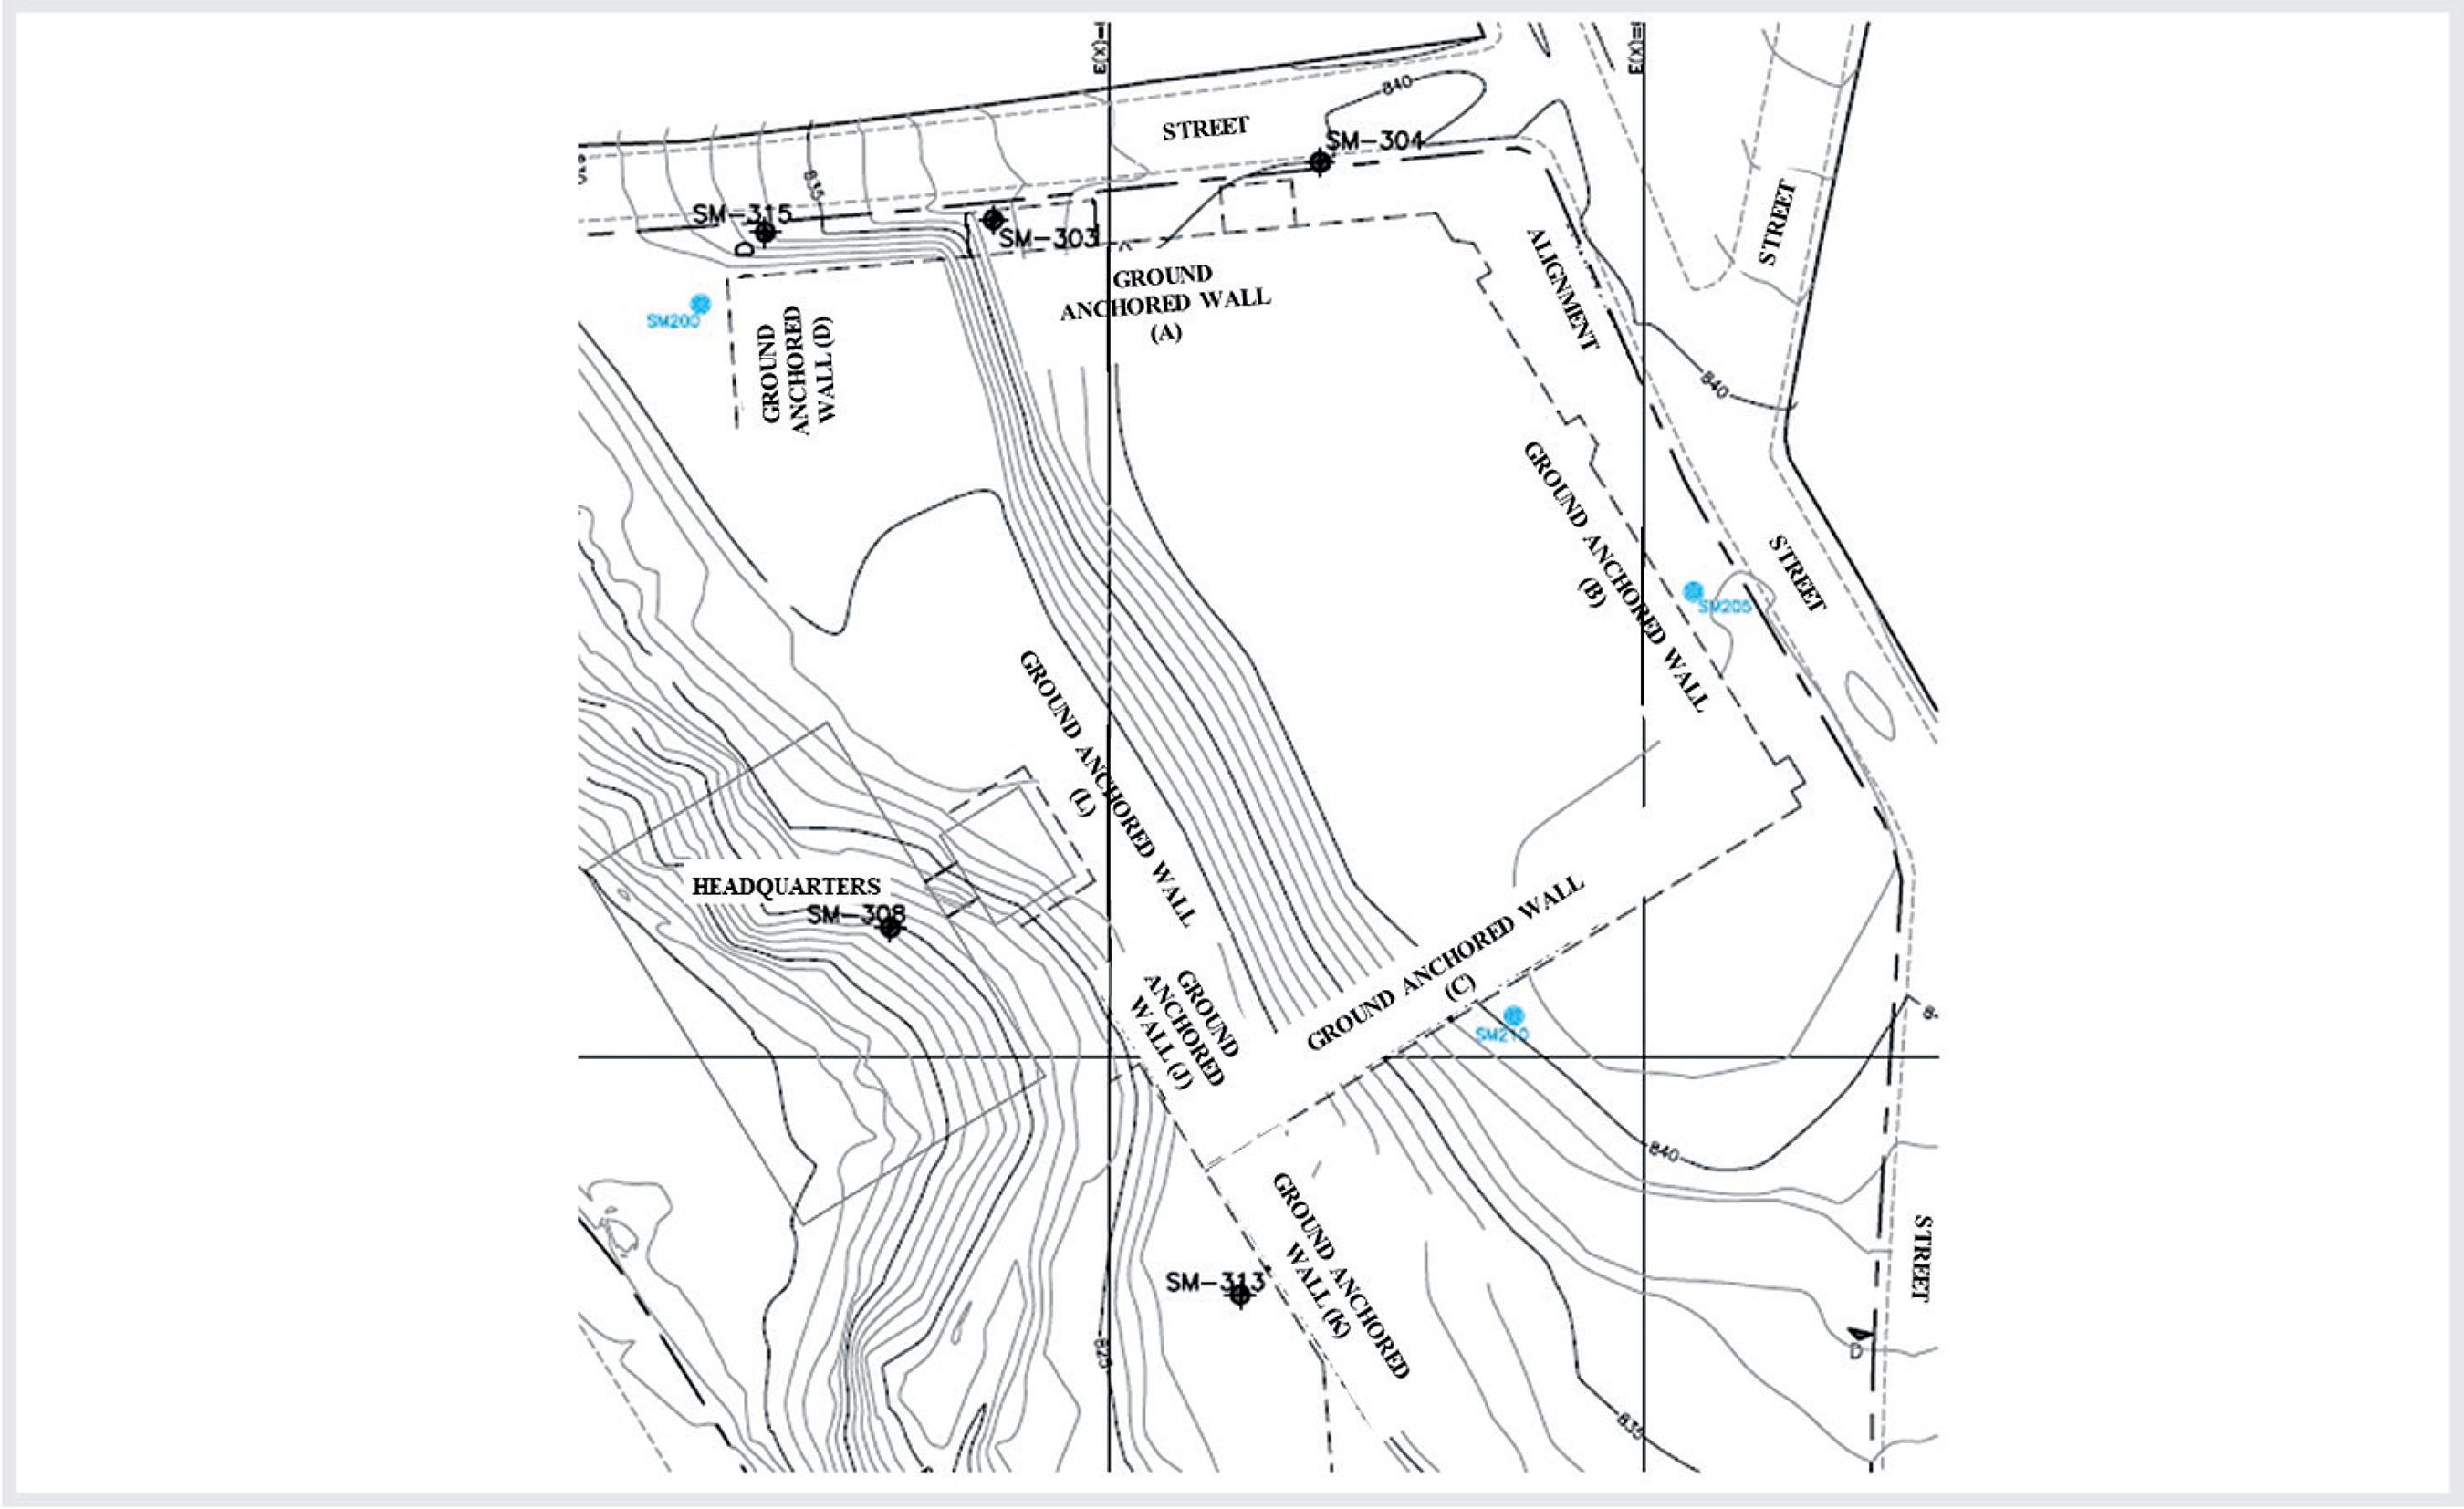
The case study refers to a construction of an automobile parking lot, located in the central region of the city of Belo Horizonte. The work is composed of seven anchored sections, denominated as sections A, B, C, D, J, K, L. The geological-geotechnical profile of each area was determined by selecting the closest and available NSPT of each section under analyses. From this information, it was possible to determine the average NSPT in the bulb of the anchor, relating it to the type of soil in which it is located. It was noticed that the majority of the bulbs where located at residual soil of a silt sandy medium, which was compact in the case of the first ones closest to the surface and compact for the deep rows. and a minority of them where located in gnaissic rock.
The six stretches of the anchored wall are composed of 475 permanent and temporary anchors, the distribution is shown in Table 2. The values of free and anchored length vary from 4 and 13 meters and the slope of the tie rod varies from 10 to 25 degrees, according to the type of tie rod and the section under which it is installed. Since the in situ tests were not followed up by the authors, a complete evaluation from the pre-stress bulletins was made. Among the 475 anchors selected for analysis, 140 were discarded. Therefore, 335 anchors were used in this study (245 temporary and 90 permanent). The reasons for the discard were (i) bulletins whose loading and displacement data were not informed; (ii) bulletins were missing; and (iii) tests in which the incorporation data of the tie rod were not informed. In addition, due to the restricted number of load capacity calculation methodologies applicable to bulbs located in rocks, 40 anchors (all permanent), whose bulbs were anchored in rocks, were also discarded, leaving 295 anchors. Figure 5 presents the sections, and the Table 3 presents the number of anchors in each of them and the life cycle type of the anchors (i.e., temporary and permanent).
Validity of the extrapolation proposed by Van der Veen (1953)VAN DER VEEN, C. The bearing capacity of a pile. In: INTERNATIONAL CONFERENCE ON SOIL MECHANICS AND FOUNDATION ENGINEERING, 3. Zurich. In: Proceedings… Zurich, v. 2, p. 84-90, 1953. according to Aoki et al. (2013)AOKI, N. et al. Fundações, ensaios estáticos e dinâmicos. São Paulo: Oficina de Textos, 2013..
The tests were performed using a hydraulic jack assembly, a pump, and a manometer. In some tests, a Rudloff MP5-7C hydraulic jack - Nº 19 was used and in others, an Incotep Hm-04.
3. Results
The shear strength in the soil-anchor interface was calculated from the rearrangement of the load capacity equation proposed by Porto (2015PORTO, T. B. Comportamento geotécnico e metodologia via web para previsão e controle. Ouro Preto, MG, Brasil: Universidade Federal de Ouro Preto, Núcleo de Geotecnia, 2015. p.482. (Tese de Doutorado em Geotecnia).). The values of shear strength found were organized according to their average values of NSPT (Table 4) for all the tests and according to the tests considered reliable by Aoki et al. (2013AOKI, N. et al. Fundações, ensaios estáticos e dinâmicos. São Paulo: Oficina de Textos, 2013.). Due to the reduction of the sample space caused by the adoption of the exclusion criterion, there were no extrapolations of the tests whose NSPT values of the anchors were in the 10-14 range. Therefore, the average value for this range is interpolated, as shown by the Table 4.
The curve with the average values of shear strength for each NSPT range for the two analyses (Aoki’s criteria and all tests) are shown in Figure 6.
Average q_sversus NSPT: all tests and Aoki et al. (2013)AOKI, N. et al. Fundações, ensaios estáticos e dinâmicos. São Paulo: Oficina de Textos, 2013. criteria.
Figures 7 and 8 present the shear strength values developed at the soil-anchor interface for each anchor and its respective value of NSPT. Figure 7 presents a graph with shear strength values obtained based on the extrapolation of all the tests evaluated. Figure 8 only shows the extrapolations considered reliable according to the criterion of Aoki et al. (2013)AOKI, N. et al. Fundações, ensaios estáticos e dinâmicos. São Paulo: Oficina de Textos, 2013..
qs versus NSPT: tests considered reliable according to Aoki et al. (2013)AOKI, N. et al. Fundações, ensaios estáticos e dinâmicos. São Paulo: Oficina de Textos, 2013..
4. Discussion
The analyses of the average values obtained by resistance at the penetration range allows to conclude that there is a tendency of increase for the values of qs as the resistance of the soil increases (Figure 6). For both analyses, it was observed that for the soils whose value are in the ranges of 25-29 and 35-40, there is an average value of qs below the increasing behavior observed for the others NSPT ranges.
Similarly, in the analyses performed for the extrapolations considered reliable, the shear strength values considering the NSPT ranges were lower than in the evaluation of all the extrapolations. Although the average values have shown a tendency of linearity (excluding the NSPT range of 25-29 and 35-40) between the values of NSPT and shear strength, all the anchors analyzed (Figure 7 and 8) show very scattered results, which do not allow the identification of any behavioral curve. However, it was possible propose an initial estimation for the shear strength value at the soil-anchor interface of sandy silts (Table 5).
5. Conclusions
The graphical analyses of the results (for all the analyzed criteria), demonstrates a tendency of a linear relationship for the increase between the shear strength value proposed by Porto (2015)PORTO, T. B. Comportamento geotécnico e metodologia via web para previsão e controle. Ouro Preto, MG, Brasil: Universidade Federal de Ouro Preto, Núcleo de Geotecnia, 2015. p.482. (Tese de Doutorado em Geotecnia)., and the penetration resistance of the studied soil. The observed dispersion can be related to the different vertical confinement tensions to which the analyzed bulbs are subjected. It is concluded that the restriction proposed by Aoki et al. (2013)AOKI, N. et al. Fundações, ensaios estáticos e dinâmicos. São Paulo: Oficina de Textos, 2013. presented results that are more conservative. The results of shear strength at the soil-anchor interface showed that it is not possible to establish a simple correlation with the value of NSPT. However, it was possible propose an initial estimation for the shear strength value at the soil-anchor interface of sandy silts.
Acknowledgments
The authors thank CAPES for the financial support.
References
- ALONSO, U. R. Comissão de revisão da atual NBR 5629, CE-02:152.10. ABEF, São Paulo, SP, 2015.
- AOKI, N. Considerações sobre a capacidade de carga de estacas isoladas Rio de Janeiro: Universidade Gama Filho, 1976. (Curso de Extensão Universitária em Engenharia de Fundações).
- AOKI, N. et al. Fundações, ensaios estáticos e dinâmicos São Paulo: Oficina de Textos, 2013.
- ASSOCIAÇÃO BRASILEIRA DE NORMAS TÉCNICAS. NBR 5629: execução de tirantes ancorados no terreno. Rio de Janeiro, 2006.
- BARLEY, A.D. The single bore multiple anchor system. In: Proc. INT. CONF.: GROUND ANCHORAGES AND ANCHORED STRUCTURES. London, p. 65-75, 1997.
- EHRLICH, M., SILVA, R. C. Resistência ao arrancamento de grampos-análise da influência do NSPT e da injeção da bainha nos resultados. In: CONGRESSO BRASILEIRO DE MECÂNICA DOS SOLOS E ENGENHARIA GEOTÉCNICA, 16. Porto de Galinhas, Brasil, 2012.
- GOUVEIA, J. R., GOUVEIA, G. R., GOMES, R. C., PORTO, T. B. Utilização de ferramenta mobile no controle tecnológico de obras de contenção atirantadas Belo Horizonte: Consmara Engenharia Ltda, 2017. 21p. (Relatório Técnico Científico).
- HANNA, T. H. Foundations in tension. Ground anchors Sheffield, England: Trans Tech Publications and McGraw-Hill Book Company, 1982.
- LIANG, R., FENG, Y., L. Development and application of anchor soil interface models. Soils and Foundations, v.42, n.2, p.59-70, 2002.
- MARTINI, B. D., PORTO, T. B., ARAUJO, D. A., GOMES, R. C. (2016). Proposta de metodologia via web para previsão e controle de ancoragens em solos. In: SIMPÓSIO BRASILEIRO DE ENGENHEIROS GEOTÉCNICOS JOVENS, 7. Belo Horizonte, Brasil.
- ORTIGÃO, J.A.R. Ensaios de arrancamento para projetos de solo grampeado. Nota Técnica, Revista Solos e Rochas, ABMS, v. 20, n.1, p. 39-43, 1997.
- PORTO, T. B. Comportamento geotécnico e metodologia via web para previsão e controle Ouro Preto, MG, Brasil: Universidade Federal de Ouro Preto, Núcleo de Geotecnia, 2015. p.482. (Tese de Doutorado em Geotecnia).
- PORTO, T. B., TORRES, A. C. A., GOMES, R. C. Behavior of reinjectable and prestressed anchors in soil masses: construction case study in Congonhas-Brazil. Soils and rocks, v. 40, n. 2, p. 177-186, 2017.
- PROTO SILVA, T. Resistência ao arrancamento de grampos em solo residual de gnaisse Tese de M.Sc., Rio de Janeiro, RJ, Brasil: DEC/PUC-Rio, 2005. p. 140. CM. SC.).
- SPRINGER, F. O. Ensaios de arrancamento de grampos em solo residual de gnaisse Belo Horizonte, MG, Brasil: DEC/PUC-Rio, 2006. p. 310. (Tese de Doutorado).
- SKRABL, S. Prestressed ground anchors of variable stiffness: patent number 21320 Ljubljana : SIPO, 2004. (In Slovene).
- SOUZA, R. N. Ancoragens reinjetáveis e protendidas em solo: previsão de comportamento e controle de execução São Paulo: Escola Politécnica da Universidade de São Paulo, 2001. 331p. (Tese Doutorado em Engenharia Civil).
- VAN DER VEEN, C. The bearing capacity of a pile. In: INTERNATIONAL CONFERENCE ON SOIL MECHANICS AND FOUNDATION ENGINEERING, 3. Zurich. In: Proceedings… Zurich, v. 2, p. 84-90, 1953.
- WOODS R. I., BARKHORDARI, K. , The influence of bond stress distribution on ground anchor design. In: PROC. OF INT. CONF. GROUND ANCHORAGES AND ANCHORAGES STRUCTURES. London, p. 55-64, 1997.
Publication Dates
-
Publication in this collection
Oct-Dec 2018
History
-
Received
13 Dec 2017 -
Accepted
23 May 2018