
Abstract
The Chalupas Caldera is a rhyolitic volcano located in the Eastern Cordillera to the Southeast of the Cotopaxi Volcano in the Ecuadorian Andes. It is supposedly fed by a huge magmatic chamber below the caldera. For studying the Chalupas magmatic chamber, the tomographic models obtained by a Tarantola-Valette inversion and studied previously in the entire Ecuadorian region were used. The theoretical basis of the tomography method based on a Bayesian solution of the inverse problem is introduced. The process of the inverse problem regularization is obtained by an L-curve scheme to achieve an optimal solution. The seismic tomography images zoomed in the Chalupas region are well correlated with the main geological terranes and faults documented for the basement of Eastern Cordillera. Based on the tomographic images obtained, it can be assumed that there is not a magmatic chamber of considerable magnitude placed close to the surface underneath the Chalupas Caldera, since it does not present seismic and tomographic evidence to be able to assume a possible volcanic eruption before long. Furthermore, the images allow identifying that the seismic and thermal activity is located beneath the Cotopaxi Volcano as a vertical anomaly beneath the Northeast of Cotopaxi Volcano that corresponds to the phreatomagmatic activity observed in 2015.
Keywords:
seismic tomography; magma chamber; Chalupas Caldera; Andes of Ecuador; Bayesian inversion
1. Introduction
Ecuador is an Andean country located above the convergence of the Nazca and South American plates. The subduction of the Nazca Plate induces morphological structures, such as mountain ranges (the Coastal Cordillera, Western Cordillera, the Eastern Cordillera, and the Eastern Subandean Belt) that correspond to a continental volcanic arc, oriented parallel to the margin. The reservoirs of the magma produced by subduction-related melting were estimated to be located approximately at the crust-mantle boundary and about 20 - 40km depth (Michaud et al., 2009MICHAUD, F.; WITT, C.; ROYER, J. Influence of the subduction of the Carnegie volcanic ridge on Ecuadorian geology: reality and fiction. In: KAY, S. M.; RAMOS, V. A.; DICKINSON, W. R. (ed.). Backbone of the Ameri cas: Shallow Subduction, Plateau Uplift, and Ridge and Terrane Collision. 1 ed. Boulder: The Geological Society of America Inc., 2009. cap. 10, p. 217-228.).
Over the past decades, several geological, geochemical, and geophysical techniques have been used to study the volcanic complexes in Ecuador with different approaches and purposes, i.e. the study of the geothermal resources related to volcanic provinces carried out since 1979 to develop alternative sources of energy. Based on a volumetric/statistical method, Almeida (1990ALMEIDA, E. Alternativas para el desarrollo geotermoeléctrico en la República del Ecuador. Quito: INECEL, 1990. 49 p.) estimates a potential of 283 MWe for the Chalupas prospect. The theoretical potential corresponds to a high temperature system and considers the presence of a hypothetical large magmatic chamber located from 5 to 8 km from the surface.
Also, based on geochemical and isotope data collected from the surface water, it cannot construct any reasonable theory that indicates the presence of a deep high-temperature aquifer or magmatic intrusions. For these reasons, geophysical techniques were recommended, especially more profound magnetotelluric (MT), and seismic of high resolution (Beate and Salgado, 2010BEATE, B.; SALGADO, R. Geothermal Country Update for Ecuador, 2005 - 2010. In: WORLD GEOTHERMAL CONGRESS, 2010, Bali, Indonesia. Proceedings […]. [S. l.]: IGA, 2010.).
One of the most developed geophysical techniques in recent years is seismic tomography. At present, it is a potent and essential tool to analyze 2D and 3D speed models in volcanic and seismically active areas (Thurber, 1992THURBER, C. H. Hypocenter-velocity structure coupling in local earthquake tomography. Physics of the Earth and Planetary Interiors. v. 75, n. 1-3, p. 55-62, 1992.). The seismic tomography applied to magmatic systems gives vast information concerning one of the most famous volcanic hot spot calderas of the world: Yellowstone. The tomography images provided evidence for gas and magmatic sources beneath Yellowstone (Husen et al, 2004HUSEN, S.; SMITH, R. B.; WAITE, G. P. Evidence for gas and magmatic sources beneath the Yellowstone volcanic field from seismic tomographic imaging. Journal of Volcanology and Geothermal Research, v. 13, n. 3-4, p. 397-410, 2004.); the slab-plume interaction that generates the Yellowstone complex (Obrebski et al, 2010OBREBSKI, M.; ALLEN, R. M.; XUE, M.; HUNG, S. H. Slab-plume interaction beneath the Pacific Northwest. Geophysical Research Letters, v. 37, n. 14, 2010.) and the spatial extent of the Yellowstone crustal magma (Farrell et al., 2014FARRELL, J.; SMITH, R. B.; HUSEN, S.; DIEHL, T. Tomography from 26 years of seismicity revealing that the spa tial extent of the Yellowstone crustal magma reservoir extends well beyond the Yellowstone caldera. Geophysical Research Letters, v. 41, n. 9, p. 068-3073, 2014.).
The advantage of this technique lies in the geodynamic context because the subduction systems provide excellent coverage of rays generated by deep seismicity related to the slab. Besides, a sufficient quantity and proper distribution of receivers on the surface allows studying volcanism processes in detail (Koulakov, 2012KOULAKOV, I. Multiscale seismic tomography imaging of volcanic complexes. In: STOPPA, F. (ed.). Updates in volcanology: a comprehensive approach to volcanological problems. 1 ed. Rijeka, Croatia: InTech, 2012. cap. 9, p. 207-242.).
One of the most studied types of seismic tomography is travel time tomography, which considers the P and S wave travel time between the source and the receiver. After generating an extensive data set with the travel times for various natural events, the next step is to choose the most suitable inversion procedure. Inversion tries to calculate the velocity of the medium by knowing the propagation times of the seismic rays and is one of the most studied geophysics topics. For this study, the results of seismic tomography developed by Araujo (2016ARAUJO, S. Travel time tomography of the crust and the mantle beneath Ecuador from data of the national seismic network. 2016. 197 f. Thèse (Doctorat en sciences de la terre et de l'univers, et de l'environnement) - Institut des Sciences de la Terre, Université Grenoble Alpes, Grenoble, 2016.) using the INSIGHT software were applied. This method is based on a stochastic inversion (Tarantola and Valette, 1982TARANTOLA, A.; VALETTE B. Generalized non-linear inverse problems solved using the least square criterion. Reviews of Geophysics and Space Physics, v. 20, n. 2, p. 219-232, 1982.) and leads to a Tikhonov problem, which consists of searching for the minimum of a cost function in a regularization space (Araujo et al., 2019ARAUJO, S.; VALETTE, B.; POTIN, B.; RUIZ. M. Seismic tomography of the continental wedge and geometry of Nazca slab beneath Ecuador. In: INTERNATIONAL SYMPOSIUM ON ANDEAN GEODYNAMICS, 8th, 2019, Quito. Proceedings […]. [S. l.]: ISAG, 2019.). The INSIGHT tomography code uses the LSQR algorithm (Paige and Saunders, 1982PAIGE, C.; SAUNDERS. M. LSQR: an algorithm for sparse linear equations and sparse least squares. ACM Transactions on Mathematical Software, v. 8, n. 1, p. 43-71, 1982.) following the matrix decomposition proposed in Monteiller et al., 2005MONTEILLER, V.; GOT, J. L.; VIRIEUX, J.; OKUBO, P. An efficient algorithm for double-difference tomography and location in heterogeneous media, with an application to the Kilauea volcano. Journal of Geophysical Research: Solid Earth, v. 110, n. B12, 2005..
INSIGHT software allows the use of P and S wave travel times of all seismic events available over the study zone, providing the maximal ray coverage of the study domain and stabilizing it by the "large" data set. The results obtained using INSIGHT software in the previous study (Araujo 2016ARAUJO, S. Travel time tomography of the crust and the mantle beneath Ecuador from data of the national seismic network. 2016. 197 f. Thèse (Doctorat en sciences de la terre et de l'univers, et de l'environnement) - Institut des Sciences de la Terre, Université Grenoble Alpes, Grenoble, 2016.) are analyzed in the present research to obtain an image of the Chalupas Caldera deep structure.
To obtain the P wave velocity model and the ratio between the P wave and S wave model, Araujo (2016ARAUJO, S. Travel time tomography of the crust and the mantle beneath Ecuador from data of the national seismic network. 2016. 197 f. Thèse (Doctorat en sciences de la terre et de l'univers, et de l'environnement) - Institut des Sciences de la Terre, Université Grenoble Alpes, Grenoble, 2016.) uses the data furnished by IGEPN (Instituto Geofísico de la Escuela Politécnica Nacional, Quito-Ecuador). There are 45941 seismic events registered in 256 seismic stations throughout Ecuadorian territory. The data cover the period from 1988 to April 2016 before the Pedernales subduction earthquake.
2. Methodology
A Bayesian approach to solve the inverse problem of the tomography was used (Tarantola, 2005TARANTOLA, A. Inverse problem theory and methods for model parameter estimation. Philadelphia: SIAM, 2005. 342 p.). It starts by defining a theoretical model with blocks in which m are the parameters and d the data. The relationship between them is the direct problem: d = g(m).
The data vector d contains the travel times of P waves and the differences between the S and P wave travel times. The model vector m contains the parameters to be obtained after the inversion: P wave velocity, the ratio of P wave velocity to S wave velocity, the hypocenters of the seismicity, the origin times of the earthquakes, and the delay time in the seismic stations. The linear operator g is a functional theoretical relationship between the data and the parameters.
The Bayesian inversion (Tarantola and Valette, 1982TARANTOLA, A.; VALETTE B. Generalized non-linear inverse problems solved using the least square criterion. Reviews of Geophysics and Space Physics, v. 20, n. 2, p. 219-232, 1982.) leads, as stated above, to a Tikhonov problem. This problem consists in searching for the minimum of a cost function in a regularization space. The cost function has the form:
In Equation (1), T is the regularization operator that in the case of the Gaussian stochastic approach is the square root of the covariance operator Cm-1/2 of the model. Cd is the covariance matrix of the data.
To solve this problem numerically, we used the following quasi-Newton algorithm:
The INSIGHT tomography software uses the LSQR algorithm (Paige and Saunders, 1982PAIGE, C.; SAUNDERS. M. LSQR: an algorithm for sparse linear equations and sparse least squares. ACM Transactions on Mathematical Software, v. 8, n. 1, p. 43-71, 1982.) and the matrix decomposition described in Monteiller et al., 2005MONTEILLER, V.; GOT, J. L.; VIRIEUX, J.; OKUBO, P. An efficient algorithm for double-difference tomography and location in heterogeneous media, with an application to the Kilauea volcano. Journal of Geophysical Research: Solid Earth, v. 110, n. B12, 2005.:
With:
The operator Σ applied to any function f and a vector x with standard deviation, σ is defined as (Σ f) (x) = σ(x) f (x). The correlation kernel has an exponential form (Vergely et al., 2010VERGELY, J. L.; VALETTE, B.; LALLEMENT, R.; RAIMOND, S. Spatial distribution of interstellar dust in the sun's vicinity-comparison with neutral sodium-bearing gas. Astronomy & Astrophysics. v. A31, n. 518, p. 1-12, 2010.):
The operator represents the correlation between two points xi and xi´ in the grid model. There are three correlation, or smoothing lengths ξ i, for each space direction. The algorithm also renormalizes the standard deviation using a damping length ξ 0 to maintain constant the information inside the inversion volume ξ 1 ξ 2 ξ 3:
The physical standard deviation for the parameters is 750 forvP and 0.15 for vP ⁄ vS and we set the vertical smoothing length ξ V at 15 km. The two horizontal lengths are considered equal. To evaluate the horizontal smoothing lengths and the damping length, the inverse problem must be regularized. To achieve the regularization, we used the L-curve strategy, where the optimization value is the corner of the curve (Hansen, 1992HANSEN, P. C. Analyses of discrete ill-possed problems by means of the L-curve. SIAM Review, v. 34, n. 4, p. 561-580, 1992.). Different values of ξ H and ξ 0 were plotted, the data fitting RMS versus the norm for the vP, vP ⁄ vS models, and the events hypocenters displacement. In this case, the L-curve corner is ξ 0 = 6 km and ξ H = 35 km, as seen in Figure 1.
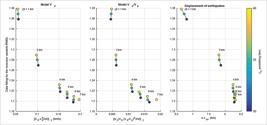
The L-curves show the stability of the inversion process and let define the regularization parameters. The vertical axis is the RMS of the inversion. The left L-curve is the norm of the vP model, the center is the norm of vP ⁄ vS and the right is the norm of the displacement of hypocenters. Colors represent the different values of the smoothing length ξ H. The values of the damping lengths ξ 0 are in the figure.
To test the solution’s stability, the tomography results obtained in Araujo et al. (2019ARAUJO, S.; VALETTE, B.; POTIN, B.; RUIZ. M. Seismic tomography of the continental wedge and geometry of Nazca slab beneath Ecuador. In: INTERNATIONAL SYMPOSIUM ON ANDEAN GEODYNAMICS, 8th, 2019, Quito. Proceedings […]. [S. l.]: ISAG, 2019.) were also analyzed. In this study, the database is complemented with 14917 seismic events from April 2016 to May 2019 (IGEPN). The resulting models in the region of interest do not have noticeable changes, and for this reason, the models used in the next sections are reported in Araujo (2016)ARAUJO, S. Travel time tomography of the crust and the mantle beneath Ecuador from data of the national seismic network. 2016. 197 f. Thèse (Doctorat en sciences de la terre et de l'univers, et de l'environnement) - Institut des Sciences de la Terre, Université Grenoble Alpes, Grenoble, 2016. seismic tomography.
The INSIGHT software solutions obtained in (Araujo, 2016ARAUJO, S. Travel time tomography of the crust and the mantle beneath Ecuador from data of the national seismic network. 2016. 197 f. Thèse (Doctorat en sciences de la terre et de l'univers, et de l'environnement) - Institut des Sciences de la Terre, Université Grenoble Alpes, Grenoble, 2016.) and in (Araujo et al., 2019ARAUJO, S.; VALETTE, B.; POTIN, B.; RUIZ. M. Seismic tomography of the continental wedge and geometry of Nazca slab beneath Ecuador. In: INTERNATIONAL SYMPOSIUM ON ANDEAN GEODYNAMICS, 8th, 2019, Quito. Proceedings […]. [S. l.]: ISAG, 2019.) provide three text files. These files are the vP, ∆vP (percentage variation) and vP ⁄ vS models with data in each node of the model space. The models have a grid with 119 nodes for x (longitude), 155 nodes for y (latitude), and 127 nodes for z (depth). The cell size of the model is 5km in the horizontal direction and 2km in the vertical direction.
For generating a cross-section, it is necessary to supply the geographic coordinates of the location (longitude and latitude), the azimuth, and length. The referred to coordinates are presented as the 0 in the cross-section, the azimuth gives the direction, and the length represents the total distance covered by the cross-section. For establishing the seismic events to show up in the cross-section, it is necessary to provide a distance in km. This distance performs the limits of a seismic box parallel to the azimuth of the cross-section to get the events registered within.
3. Study site: Chalupas Caldera
The Chalupas Caldera is located in the Eastern Cordillera, southeast of the Cotopaxi Volcano. The simplified stratigraphic sequence of metamorphic (Paleozoic-Triassic-Jurassic) basement of the Eastern Cordillera consists of four well-differentiated terranes (Litherland et al., 1994LITHERLAND, M.; ASPEN, J. A.; JEMIELITA, R. A. The metamorphic belts of Ecuador. Keyworth, Nottingham: British Geological Survey, 1994. 174 p. (Overseas Memoir, 11).). Figure 2 shows these terranes traversing (westward) from the Jurassic batholith (Abitagua) and crossing the Cosanga Fault, the deformed Salado Basin (Salado Terrane) consisting of turbiditic metasedimentary rocks and mafic lavas (Upano Unit), in contact with the I-type calc-alkaline Azafrán Batholith (145-140Ma) (Spikings et al.,2015SPIKINGS, R.; COCHRANE, R.; VILLAGOMEZ, D.; VAN DER LELIJ, R.; VALLEJO, C.; WINKLER, W.; BEATE, B. The geological history of northwestern South America: from Pangaea to the early collision of the Caribbean Large Igneous Province (290-75 Ma). Gondwana Research, v. 27, p.95-139, 2015.). Continuing the boundary of Salado Terrane westwards is the Llanganates Fault and further west a poorly differentiated zone between metamorphosed Paleozoic metasedimentary rocks of Chiguinda and Agoyán Units with the Triassic Tres Lagunas Unit Trl (240 - 250Ma); this is an S-type granite characterized by the presence of "blue quartz" (Paul et al., 2018PAUL, A. N.; SPIKINGS, R. A.; ULIANOV, A.; OVTCHAROVA, M. High temperature (> 350° C) thermal histories of the long lived (> 500 Ma) active margin of Ecuador and Colombia: Apatite, titanite and rutile U-Pb thermochronology. Geochimica et Cosmochimica Acta, v. 228, p. 275-300, 2018.). The association of these Paleozoic and Triassic rocks constitutes the Loja Terrane (Litherland et al., 1994LITHERLAND, M.; ASPEN, J. A.; JEMIELITA, R. A. The metamorphic belts of Ecuador. Keyworth, Nottingham: British Geological Survey, 1994. 174 p. (Overseas Memoir, 11).; Spikings et al., 2019SPIKINGS, R. A.; COCHRANE, R.; VALLEJO, C.; VILLAGOMEZ, D.; VAN DER LELIJ, R.; PAUL, A.; WINKLER, W. Latest Triassic to Early Cretaceous tectonics of the Northern Andes: geochronology, geochemistry, isotopic tracing, and thermochronology. In: HORTON, B. K.; FOLGUERA, A. (ed.). Andean Tectonics. [S. l.]: Elsevier, 2019. cap. 7, p. 173-208.).

The left map shows the position of the Chalupas Caldera. The Geological map to the right shows the basement of Eastern Cordillera and the Chalupas Caldera. The map is modified from Litherland (1994)LITHERLAND, M.; ASPEN, J. A.; JEMIELITA, R. A. The metamorphic belts of Ecuador. Keyworth, Nottingham: British Geological Survey, 1994. 174 p. (Overseas Memoir, 11)..
Further west, the Baños Fault and submarine meta-andesites and meta-agglomerates of the Alao-Paute, El Pan y Maguazo Units conform to the Alao Arc. These sequences western margin is the Peltetec Unit, an ophiolitic assemblage constituted by basalt and volcanoclastic rocks, and the Peltetec Fault (Litherland et al., 1994LITHERLAND, M.; ASPEN, J. A.; JEMIELITA, R. A. The metamorphic belts of Ecuador. Keyworth, Nottingham: British Geological Survey, 1994. 174 p. (Overseas Memoir, 11).). This fault is the east boundary of a series of slates and quartzites belonging to the Guamote Terrane (Spikings et al., 2019SPIKINGS, R. A.; COCHRANE, R.; VALLEJO, C.; VILLAGOMEZ, D.; VAN DER LELIJ, R.; PAUL, A.; WINKLER, W. Latest Triassic to Early Cretaceous tectonics of the Northern Andes: geochronology, geochemistry, isotopic tracing, and thermochronology. In: HORTON, B. K.; FOLGUERA, A. (ed.). Andean Tectonics. [S. l.]: Elsevier, 2019. cap. 7, p. 173-208.).
The caldera has approximately 17 km of diameter, and the dominant erupted phase is dated as 40Ar/39Ar to 211 ± 14 ky (Hammersley, 2003HAMMESLEY, L. C. Isotopic evidence for the relative roles of fractional crystallization, crustal assimilation and magma supply in the generation of large volume rhyolitic eruptions. 2003. 402f. Thesis (Doctorate of Sciences) - University of California, Berkeley, 2003.) and by K-Ar to of 216 ± 5 ky (Bablon et al., 2020BABLON, M.; QUIDELLEUR, X.; SIANI, G.; SAMANIEGO, P.; LEPENNEC, J. L.; NOUET, J.; LIORZOU, C.; SANTAMARÍA, S.; HIDALGO, S. Glass shard K-Ar dating of the Chalupas caldera major eruption: Main Pleistocene stratigraphic marker of the Ecuadorian volcanic arc. Quaternary Geochronology, vol. 57, p. 101053, 2020.) generates massive rhyolitic pyroclastic flow described as ignimbrite. The Chalupas Volcanic materials of the dominant eruptive phase are considered the primary temporary marker of Holocene because fine ashes of this event have been found 900 km away from the emission center, and the estimated deposit volume reaches up to 265 km3 (Bablon et al., 2020BABLON, M.; QUIDELLEUR, X.; SIANI, G.; SAMANIEGO, P.; LEPENNEC, J. L.; NOUET, J.; LIORZOU, C.; SANTAMARÍA, S.; HIDALGO, S. Glass shard K-Ar dating of the Chalupas caldera major eruption: Main Pleistocene stratigraphic marker of the Ecuadorian volcanic arc. Quaternary Geochronology, vol. 57, p. 101053, 2020.). In the first report provided by OLADE/INECEL, it recognizes the Chalupas prospect as the highest geothermal project with 283 MWe, based on the volumetric heat-in-place method (INECEL, 1983INECEL. Estudio de exploración de los recursos geotérmicos en Chalupas, Primera Fase Prefactibilidad. Unpublished Technical report, 1983. 150 p.).
Chalupas is the only volcano in Ecuador with a VEI (Volcanic Explosive Index) of 7, placing it as a volcano with ultraplinian eruptions (Bablon et al., 2020BABLON, M.; QUIDELLEUR, X.; SIANI, G.; SAMANIEGO, P.; LEPENNEC, J. L.; NOUET, J.; LIORZOU, C.; SANTAMARÍA, S.; HIDALGO, S. Glass shard K-Ar dating of the Chalupas caldera major eruption: Main Pleistocene stratigraphic marker of the Ecuadorian volcanic arc. Quaternary Geochronology, vol. 57, p. 101053, 2020.). According to Hall and Mothes (2008HALL, M.; MOTHES, P. The rhyolitic-andesitic eruptive history of Cotopaxi volcano, Ecuador. Bulletin of Volcanology, v. 70, n. 6, p. 675-702, 2008.), the pumice of the rhyolitic eruptions of the Cotopaxi during the Holocene are chemically similar to those of the oldest rhyolites of the Barrancas series, except for the initial eruptive products of the Colorado Canyon series, whose chemistry is similar to ignimbrite (216 ± 5 ky) of the neighboring Chalupas,. resulting in a hypothetical kind of connection or cross-feeding between the magmatic chambers of these two volcanoes.
There are three phases well-differentiated in Chalupas's eruptive record in the Pleistocene period: the pre-collapse, the dominant eruptive phase, and the post-collapse. The pre-collapse eruptions consist of a large amount of mainly andesitic periclinal lava flows (Hammersley, 2003HAMMESLEY, L. C. Isotopic evidence for the relative roles of fractional crystallization, crustal assimilation and magma supply in the generation of large volume rhyolitic eruptions. 2003. 402f. Thesis (Doctorate of Sciences) - University of California, Berkeley, 2003.). The dominant eruptive phase dated 216 ± 5 ky (Bablon et al., 2020BABLON, M.; QUIDELLEUR, X.; SIANI, G.; SAMANIEGO, P.; LEPENNEC, J. L.; NOUET, J.; LIORZOU, C.; SANTAMARÍA, S.; HIDALGO, S. Glass shard K-Ar dating of the Chalupas caldera major eruption: Main Pleistocene stratigraphic marker of the Ecuadorian volcanic arc. Quaternary Geochronology, vol. 57, p. 101053, 2020.) generates a large pyroclastic flow of ignimbrite and destroys the principal volcano structure. The Chalupas ignimbrite is formed by an unconsolidated pumitic tuff of light gray ash that presents microcrystals of biotite, plagioclase, and quartz with fragments of pumice (Almeida et al., 1992ALMEIDA, E.; SANDOVAL, G.; PANICHI, C.; NOTO, P.; BELLUCCI, L. Modelo geotérmico preliminar de áreas volcánicas del Ecuador, a partir de estudios químicos e isotópicos de manifestaciones termales. In: FINAL RESE ARCH COORDINATION MEETING, 1992, Vienna. Proceedings […]. [S. l.: s. n.], 1992.). The post-collapse eruptions described in Córdova (2018CÓRDOVA, M. D. Identificación y caracterización de los últimos productos eruptivos de la fase resurgente de la Caldera de Chalupas. 2018. 133 f. Trabajo de Titulación (Licenciatura en Ingenieria Geológica) - Faculdad de Geología y Petróleos, Escuela Politécnica Nacional, Quito, 2018.) are less acidic and conform to the successive volcanic events of Quilindaña volcano and Buenavista dome in the last resurgence period.
4. Results of tomography and discussion
The results of tomography are presented on vertical cross sections of the velocity models (vP, ∆vP and vP ⁄ vS). Additionally, the tomography shows the hypocenter of seismic events corresponding to 10 km parallel to the cross-sections drawing the seismic box. The azimuths of tomography cross-sections used in this work are presented in Figure 3.

The topographic map shows the directions of the two tomography cross-sections (yellow lines) used in this study. The map also shows the seismic events (points) with depth lower than 20km, the seismic stations (green triangles) in the region, and the locations of Quilindaña and Cotopaxi volcanos (red triangles). The blue lines are the limits of the seismic box. Thin black lines are the Peltetec Fault (PF,) the Baños Fault (BF,) and the Llanganates Fault (LLF).
The change in the medium's elastic properties due to a change in lithology is the key factor that induces variations in seismic velocities on rocks. The models vP and ∆vP are commonly used to infer lithological structures and delimited formations. Generally, the rocks with high porosity, such as tuff and pyroclastic deposits, display low vP values, and rocks highly consolidated like granite, or metamorphic rocks, display high values of vP (Lira, 2011LIRA, E. S. Estudio de sismicidad, tomografía sísmica y modelo de física de rocas: potencial sistema geotermal asociado al complejo volcánico Tinguiririca. 2011. 189 f. Tesis (Magíster en Ciencias) - Universidad de Chile, Santiago de Chile, 2011.).
From the vP cross-section, Figure 4a, it is possible to set the boundaries of the terranes that conforms to the metamorphic basement of the Eastern Cordillera as described in Litherland et al., 1994LITHERLAND, M.; ASPEN, J. A.; JEMIELITA, R. A. The metamorphic belts of Ecuador. Keyworth, Nottingham: British Geological Survey, 1994. 174 p. (Overseas Memoir, 11).; Spikings et al., 2019SPIKINGS, R. A.; COCHRANE, R.; VALLEJO, C.; VILLAGOMEZ, D.; VAN DER LELIJ, R.; PAUL, A.; WINKLER, W. Latest Triassic to Early Cretaceous tectonics of the Northern Andes: geochronology, geochemistry, isotopic tracing, and thermochronology. In: HORTON, B. K.; FOLGUERA, A. (ed.). Andean Tectonics. [S. l.]: Elsevier, 2019. cap. 7, p. 173-208.; based on the change in the vP model, the Peltetec, Baños and Llanganates faults (NNE-SSW) can be redrawn. Furthermore, a zone with relatively high vP located 20 km east of Quilindaña at 12 km depth below the surface is identified. The Chalupas does not present significant seismicity below the caldera, where the few events occurring belong to Cotopaxi Volcano.

Cross-sections centered at Quilindaña volcano; -78.32 W, -0.78 S. a) The vP model with a structural setting of Eastern Cordillera basement (dashed black lines). b) The ΔvP model with the Terranes of the cordillera basement. c) The vP model comparing the seismicity between Cotopaxi Volcano and Chalupas Caldera. d) The vP ⁄ vS model that shows the vertical anomaly beneath the Cotopaxi. The cross-sections a) and b) have an azimuth of N 90° E, c) and d) have an azimuth of N 34° W. Blue dots represent the seismic hypocenters of events placed inside the seismic box.
Based on Figure 4b and 4a, we delimit the terranes that conform to the basement of Chalupas Caldera and northern of Eastern Cordillera, concordant to schemes presented in (Litherland et al, 1994LITHERLAND, M.; ASPEN, J. A.; JEMIELITA, R. A. The metamorphic belts of Ecuador. Keyworth, Nottingham: British Geological Survey, 1994. 174 p. (Overseas Memoir, 11).; Spikings et al., 2019SPIKINGS, R. A.; COCHRANE, R.; VALLEJO, C.; VILLAGOMEZ, D.; VAN DER LELIJ, R.; PAUL, A.; WINKLER, W. Latest Triassic to Early Cretaceous tectonics of the Northern Andes: geochronology, geochemistry, isotopic tracing, and thermochronology. In: HORTON, B. K.; FOLGUERA, A. (ed.). Andean Tectonics. [S. l.]: Elsevier, 2019. cap. 7, p. 173-208.). Traversing westward, the Salado oceanic terrane is presented as a zone with relatively high values of vP and ∆vP given by the presence of I-type calc-alkaline Azafrán Batholith (145-140Ma) (Spikings et al., 2019SPIKINGS, R. A.; COCHRANE, R.; VALLEJO, C.; VILLAGOMEZ, D.; VAN DER LELIJ, R.; PAUL, A.; WINKLER, W. Latest Triassic to Early Cretaceous tectonics of the Northern Andes: geochronology, geochemistry, isotopic tracing, and thermochronology. In: HORTON, B. K.; FOLGUERA, A. (ed.). Andean Tectonics. [S. l.]: Elsevier, 2019. cap. 7, p. 173-208.). The Llanganates Fault is the west boundary of the Salado Terrane. To the west side is immediately located the Loja Terrane (continental), particularly Tres Lagunas Unit Trl (240-250 Ma), an S-type granite similar in velocity to Azafrán batholith (Jsaz). There is a hypothesized igneous contact in the location of Llanganates Fault between the Trl Unit and Azafrán batholith of the Salado Terrane (Litherland et al., 1994LITHERLAND, M.; ASPEN, J. A.; JEMIELITA, R. A. The metamorphic belts of Ecuador. Keyworth, Nottingham: British Geological Survey, 1994. 174 p. (Overseas Memoir, 11).; Spikings et al., 2019SPIKINGS, R. A.; COCHRANE, R.; VALLEJO, C.; VILLAGOMEZ, D.; VAN DER LELIJ, R.; PAUL, A.; WINKLER, W. Latest Triassic to Early Cretaceous tectonics of the Northern Andes: geochronology, geochemistry, isotopic tracing, and thermochronology. In: HORTON, B. K.; FOLGUERA, A. (ed.). Andean Tectonics. [S. l.]: Elsevier, 2019. cap. 7, p. 173-208.).
In the middle of Loja Terrane, Figure 4b, an igneous contact is inferred between the Trl Unit and the metasedimentary rocks of Agoyán Unit (Pzla) (Litherland et al., 1994LITHERLAND, M.; ASPEN, J. A.; JEMIELITA, R. A. The metamorphic belts of Ecuador. Keyworth, Nottingham: British Geological Survey, 1994. 174 p. (Overseas Memoir, 11).; Cochrane et al., 2014COCHRANE, R.; SPIKINGS, R.; GERDES, A.; ULIANOV, A.; MORA, A.; VILLAGÓMEZ, D.; PUTLITZ, B.; CHIARADIA, M. Permo-Triassic anatexis, continental rifting and the disassembly of western Pangaea. Lithos, v. 190, p. 383-402, 2014.; Spikings et al., 2019SPIKINGS, R. A.; COCHRANE, R.; VALLEJO, C.; VILLAGOMEZ, D.; VAN DER LELIJ, R.; PAUL, A.; WINKLER, W. Latest Triassic to Early Cretaceous tectonics of the Northern Andes: geochronology, geochemistry, isotopic tracing, and thermochronology. In: HORTON, B. K.; FOLGUERA, A. (ed.). Andean Tectonics. [S. l.]: Elsevier, 2019. cap. 7, p. 173-208.). Pratt et al. (2005PRATT, W. T.; DUQUE, P.; PONCE, M. An autochthonous geological model for the eastern Andes of Ecuador. Tectonophysics, v. 399, n. 1-4, p.251-278, 2005.) interpret this contact as either a metamorphosed intrusive contact or an unconformity between Paleozoic and Triassic units represented in Figure 2. The west boundary of Loja Terrane is the inferred Baños Fault that crosses close to the Quilindaña summit, covered by Quaternary volcanic deposits, Figure 4a. West to the Baños Fault with a negative value of ∆vP and a relatively low value of vP is located the Alao Terrane (Middle Jurassic), with no reliable age dates. In a consensus, the formation of Alao Arc occurs during the Early Cretaceous within a marine environment (Spikings et al., 2019SPIKINGS, R. A.; COCHRANE, R.; VALLEJO, C.; VILLAGOMEZ, D.; VAN DER LELIJ, R.; PAUL, A.; WINKLER, W. Latest Triassic to Early Cretaceous tectonics of the Northern Andes: geochronology, geochemistry, isotopic tracing, and thermochronology. In: HORTON, B. K.; FOLGUERA, A. (ed.). Andean Tectonics. [S. l.]: Elsevier, 2019. cap. 7, p. 173-208.).
On the western edge of Alao Arc the ophiolitic assemblage (Peltetec Unit) is inferred showing a low value of ∆vP; the Peltetec Fault constitutes the west boundary of Alao Arc. An inferred Guamote Terrane with high negative values of ∆vP is presented further west in Figures 4a and 4b, being part of the Inter-Andean Valley’s basement (Spikings et al., 2019SPIKINGS, R. A.; COCHRANE, R.; VALLEJO, C.; VILLAGOMEZ, D.; VAN DER LELIJ, R.; PAUL, A.; WINKLER, W. Latest Triassic to Early Cretaceous tectonics of the Northern Andes: geochronology, geochemistry, isotopic tracing, and thermochronology. In: HORTON, B. K.; FOLGUERA, A. (ed.). Andean Tectonics. [S. l.]: Elsevier, 2019. cap. 7, p. 173-208.).
The vP ⁄ vS model is used to determine magmatic and phreatic contexts related to volcanoes on different scales. Low vP ⁄ vS values infer consolidated materials, and high vP ⁄ vS values infer fluid magmatic margins. (Koulakov, 2012KOULAKOV, I. Multiscale seismic tomography imaging of volcanic complexes. In: STOPPA, F. (ed.). Updates in volcanology: a comprehensive approach to volcanological problems. 1 ed. Rijeka, Croatia: InTech, 2012. cap. 9, p. 207-242.).
The vP ⁄ vS model (Figure 5) shows low values (less than 1.56) directly below the Chalupas Caldera, representing its fill that matches with the caldera edges on the surface (Figure 2), and is limited with the igneous contact within the Loja Terrane (Figure 4a). These values allow assuming that there is no shallow magmatic chamber of considerable magnitude below the Chalupas Caldera. They neither present seismic and tomographic evidence to assume a possible volcanic eruption before long, nor vertical fluxes of magma feeding any chamber below the Chalupas Caldera. On the other hand, we identified a zone of high values of vP and vP ⁄ vS located 20 to 22 km east of Quilindaña at 12 km depth below the surface that could be associated with a cooled magmatic body, based on parameters describes in Lira (2011LIRA, E. S. Estudio de sismicidad, tomografía sísmica y modelo de física de rocas: potencial sistema geotermal asociado al complejo volcánico Tinguiririca. 2011. 189 f. Tesis (Magíster en Ciencias) - Universidad de Chile, Santiago de Chile, 2011.). This body is not the main magmatic chamber of Chalupas because it is not placed directly under the caldera and is too far from the surface. Based on Aloisi et al., 2002ALOISI, M.; COCINA, O.; NERI, G.; ORECCIO, B.; PRIVITERA, E. Seismic tomography of the crust underneath the Etna volcano. Physics of the Earth and Planetary Interiors, Sicily, v. 134, n. 3-4, 139-155p, 2002., this zone could be related to young intrusive bodies and would represent a possible hypothetical heat source of an eventual geothermal resource, which could be heating the water infiltrated by the inferred Llanganates fault, if the fault is permeable.

Cross-section of vP ⁄ vS beneath the Chalupas Caldera. We can identify a low value vP ⁄ vS zone below the Chalupas caldera and another zone with high values of vP ⁄ vS 22 km east of Quilindaña at 12 km depth. The image center is -78.32 W, -0.78 S with an azimuth of N 90° E.
To compare the Chalupas caldera's seismic and tomographic context with an active volcano, a cross-section centered on Quilindaña with an azimuth of N 34° E addressed to Cotopaxi is presented in Figures 4c and 4d. The cross-sections show a vertical velocity anomaly behind the northeast of the Cotopaxi Volcano. This anomaly is consistent with that inferred by Calahorrano et al. (2019)CALAHORRANO-DI PATRE, A.; WILLIAMS-JONES, G.; BATTAGLIA, M.; MOTHES, P., GAUNT, E.; ZUREK, J.; WITTER, J. Hydrothermal fluid migration due to interaction with shallow magma: Insights from gravity changes before and after the 2015 eruption of Cotopaxi volcano, Ecuador. Journal of Volcanology and Geothermal Research, v. 387, ref. 106667, 2019. for the Cotopaxi volcanic complex during the 2015 eruption. This gravimetric study estimates that the deep source of Cotopaxi magma is about 6 km depth and suggests a shallower source of magma 3000 m depth from the summit. This magma interacts with an aquifer and generates infiltration of hydrothermal water on the surface to the northeast of the Cotopaxi volcano. The value of the vP ⁄ vS anomaly beneath Cotopaxi is 1.66, and this is not high enough to represent a magma body rising (Koulakov, 2012KOULAKOV, I. Multiscale seismic tomography imaging of volcanic complexes. In: STOPPA, F. (ed.). Updates in volcanology: a comprehensive approach to volcanological problems. 1 ed. Rijeka, Croatia: InTech, 2012. cap. 9, p. 207-242.). According to Lira (2011LIRA, E. S. Estudio de sismicidad, tomografía sísmica y modelo de física de rocas: potencial sistema geotermal asociado al complejo volcánico Tinguiririca. 2011. 189 f. Tesis (Magíster en Ciencias) - Universidad de Chile, Santiago de Chile, 2011.), when gas or vapor phases intrude the rock, it produces a decrease of vP ⁄ vS, so that a phreatomagmatic eruption with a high percentage of SO2 as that produced in 2015 by the Cotopaxi Volcano (Mothes et al., 2017MOTHES, P. A.; RUIZ, M. C.; VIRACUCHA, E.G.; RAMÓN, P. A.; HERNÁNDEZ, S.; HIDALGO, S.; BERNARD, B.; GAUNT, E. H.; JARRÍN, P.; YÉPEZ, M. A.; ESPÍN, P. A. Geophysical footprints of Cotopaxi’s unrest and minor eruptions in 2015: an opportunity to test scientific and community preparedness. In: GOTTSMANN, J.; NEUBERG, J.; SCHEU, B. (ed.). Volcanic unrest: from sience to society. 1 ed. Cham: Springer Nature, 2017. cap. 16, p. 241-270.) should present relative smaller values of vP ⁄ vS, agreeing to the model presented in Figure 4d.
Figure 6 resumes the 3-dimensional structure of the Chalupas-Quilindaña-Cotopaxi complex. It shows the vP ⁄ vS model beneath the volcanoes, with the Cotopaxi volcano's vertical anomaly in agreement to the eruption of 2015 and the low values below the Chalupas Caldera that infers consolidated rocks. Figure 6 sketches the anomaly below Cotopaxi as an iso-surface vP ⁄ vS =1.66 and the anomaly below the Chalupas-Quilindaña as an iso-volume with vP ⁄ vS ≤1.56 . The topography in Figure 6 is depicted on a real scale.

Three-dimensional sketch of vP ⁄ vS model that better shows the anomaly of high values beneath the Cotopaxi volcano and the consolidated materials with low values of vP ⁄ vS below the Quilindaña Volcano and the Chalupas Caldera; the horizontal distances and depth are in kilometers.
4. Conclusions
This study allows assuming that there is not a magmatic chamber of considerable magnitude placed close to the surface below the Chalupas Caldera and does not present seismic and tomographic evidence to assume a possible volcanic eruption before long, with no vertical fluxes of magma feeding any chamber or reservoir below the Chalupas Caldera.
The anomaly with high values of vP and vP ⁄ vS located between 20 to 22 km east of Quilindaña at 12 km depth below the surface could be associated with a cooled magmatic body related to young intrusives or could represent a heat source of an eventual geothermal reserve.
The seismic tomography allows identifying that the seismic and thermal activity is located beneath the Cotopaxi Volcano, the vertical anomaly of vP ⁄ vS (1.66) beneath the Northeast of Cotopaxi Volcano corresponds to the phreatomagmatic eruption with a high percentage of SO2 produced in 2015.
Acknowledgment
All the computations presented in this article were performed using the Froggy platform of the CIMENT infrastructure at Grenoble Alpes University.
The authors acknowledge support of the professors of faculty of Earth and Water Sciences of Ikiam University, Mgs. Marco Simbaña, PhD. Nataly Aranda and Mgs. David Granda. Also, acknowledge the valuable comments of two blind reviewers and associate editor of REM.
References
- ALMEIDA, E. Alternativas para el desarrollo geotermoeléctrico en la República del Ecuador Quito: INECEL, 1990. 49 p.
- ALMEIDA, E.; SANDOVAL, G.; PANICHI, C.; NOTO, P.; BELLUCCI, L. Modelo geotérmico preliminar de áreas volcánicas del Ecuador, a partir de estudios químicos e isotópicos de manifestaciones termales. In: FINAL RESE ARCH COORDINATION MEETING, 1992, Vienna. Proceedings […]. [S. l: s. n], 1992.
- ALOISI, M.; COCINA, O.; NERI, G.; ORECCIO, B.; PRIVITERA, E. Seismic tomography of the crust underneath the Etna volcano. Physics of the Earth and Planetary Interiors, Sicily, v. 134, n. 3-4, 139-155p, 2002.
- ARAUJO, S. Travel time tomography of the crust and the mantle beneath Ecuador from data of the national seismic network 2016. 197 f. Thèse (Doctorat en sciences de la terre et de l'univers, et de l'environnement) - Institut des Sciences de la Terre, Université Grenoble Alpes, Grenoble, 2016.
- ARAUJO, S.; VALETTE, B.; POTIN, B.; RUIZ. M. Seismic tomography of the continental wedge and geometry of Nazca slab beneath Ecuador. In: INTERNATIONAL SYMPOSIUM ON ANDEAN GEODYNAMICS, 8th, 2019, Quito. Proceedings […]. [S. l.]: ISAG, 2019.
- BABLON, M.; QUIDELLEUR, X.; SIANI, G.; SAMANIEGO, P.; LEPENNEC, J. L.; NOUET, J.; LIORZOU, C.; SANTAMARÍA, S.; HIDALGO, S. Glass shard K-Ar dating of the Chalupas caldera major eruption: Main Pleistocene stratigraphic marker of the Ecuadorian volcanic arc. Quaternary Geochronology, vol. 57, p. 101053, 2020.
- BEATE, B.; SALGADO, R. Geothermal Country Update for Ecuador, 2005 - 2010. In: WORLD GEOTHERMAL CONGRESS, 2010, Bali, Indonesia. Proceedings […]. [S. l.]: IGA, 2010.
- CALAHORRANO-DI PATRE, A.; WILLIAMS-JONES, G.; BATTAGLIA, M.; MOTHES, P., GAUNT, E.; ZUREK, J.; WITTER, J. Hydrothermal fluid migration due to interaction with shallow magma: Insights from gravity changes before and after the 2015 eruption of Cotopaxi volcano, Ecuador. Journal of Volcanology and Geothermal Research, v. 387, ref. 106667, 2019.
- COCHRANE, R.; SPIKINGS, R.; GERDES, A.; ULIANOV, A.; MORA, A.; VILLAGÓMEZ, D.; PUTLITZ, B.; CHIARADIA, M. Permo-Triassic anatexis, continental rifting and the disassembly of western Pangaea. Lithos, v. 190, p. 383-402, 2014.
- CÓRDOVA, M. D. Identificación y caracterización de los últimos productos eruptivos de la fase resurgente de la Caldera de Chalupas 2018. 133 f. Trabajo de Titulación (Licenciatura en Ingenieria Geológica) - Faculdad de Geología y Petróleos, Escuela Politécnica Nacional, Quito, 2018.
- FARRELL, J.; SMITH, R. B.; HUSEN, S.; DIEHL, T. Tomography from 26 years of seismicity revealing that the spa tial extent of the Yellowstone crustal magma reservoir extends well beyond the Yellowstone caldera. Geophysical Research Letters, v. 41, n. 9, p. 068-3073, 2014.
- HALL, M.; MOTHES, P. The rhyolitic-andesitic eruptive history of Cotopaxi volcano, Ecuador. Bulletin of Volcanology, v. 70, n. 6, p. 675-702, 2008.
- HAMMESLEY, L. C. Isotopic evidence for the relative roles of fractional crystallization, crustal assimilation and magma supply in the generation of large volume rhyolitic eruptions 2003. 402f. Thesis (Doctorate of Sciences) - University of California, Berkeley, 2003.
- HANSEN, P. C. Analyses of discrete ill-possed problems by means of the L-curve. SIAM Review, v. 34, n. 4, p. 561-580, 1992.
- HUSEN, S.; SMITH, R. B.; WAITE, G. P. Evidence for gas and magmatic sources beneath the Yellowstone volcanic field from seismic tomographic imaging. Journal of Volcanology and Geothermal Research, v. 13, n. 3-4, p. 397-410, 2004.
- INECEL. Estudio de exploración de los recursos geotérmicos en Chalupas, Primera Fase Prefactibilidad Unpublished Technical report, 1983. 150 p.
- KOULAKOV, I. Multiscale seismic tomography imaging of volcanic complexes. In: STOPPA, F. (ed.). Updates in volcanology: a comprehensive approach to volcanological problems. 1 ed. Rijeka, Croatia: InTech, 2012. cap. 9, p. 207-242.
- LIRA, E. S. Estudio de sismicidad, tomografía sísmica y modelo de física de rocas: potencial sistema geotermal asociado al complejo volcánico Tinguiririca 2011. 189 f. Tesis (Magíster en Ciencias) - Universidad de Chile, Santiago de Chile, 2011.
- LITHERLAND, M.; ASPEN, J. A.; JEMIELITA, R. A. The metamorphic belts of Ecuador Keyworth, Nottingham: British Geological Survey, 1994. 174 p. (Overseas Memoir, 11).
- MICHAUD, F.; WITT, C.; ROYER, J. Influence of the subduction of the Carnegie volcanic ridge on Ecuadorian geology: reality and fiction. In: KAY, S. M.; RAMOS, V. A.; DICKINSON, W. R. (ed.). Backbone of the Ameri cas: Shallow Subduction, Plateau Uplift, and Ridge and Terrane Collision. 1 ed. Boulder: The Geological Society of America Inc., 2009. cap. 10, p. 217-228.
- MONTEILLER, V.; GOT, J. L.; VIRIEUX, J.; OKUBO, P. An efficient algorithm for double-difference tomography and location in heterogeneous media, with an application to the Kilauea volcano. Journal of Geophysical Research: Solid Earth, v. 110, n. B12, 2005.
- MOTHES, P. A.; RUIZ, M. C.; VIRACUCHA, E.G.; RAMÓN, P. A.; HERNÁNDEZ, S.; HIDALGO, S.; BERNARD, B.; GAUNT, E. H.; JARRÍN, P.; YÉPEZ, M. A.; ESPÍN, P. A. Geophysical footprints of Cotopaxi’s unrest and minor eruptions in 2015: an opportunity to test scientific and community preparedness. In: GOTTSMANN, J.; NEUBERG, J.; SCHEU, B. (ed.). Volcanic unrest: from sience to society. 1 ed. Cham: Springer Nature, 2017. cap. 16, p. 241-270.
- OBREBSKI, M.; ALLEN, R. M.; XUE, M.; HUNG, S. H. Slab-plume interaction beneath the Pacific Northwest. Geophysical Research Letters, v. 37, n. 14, 2010.
- PAIGE, C.; SAUNDERS. M. LSQR: an algorithm for sparse linear equations and sparse least squares. ACM Transactions on Mathematical Software, v. 8, n. 1, p. 43-71, 1982.
- PAUL, A. N.; SPIKINGS, R. A.; ULIANOV, A.; OVTCHAROVA, M. High temperature (> 350° C) thermal histories of the long lived (> 500 Ma) active margin of Ecuador and Colombia: Apatite, titanite and rutile U-Pb thermochronology. Geochimica et Cosmochimica Acta, v. 228, p. 275-300, 2018.
- PRATT, W. T.; DUQUE, P.; PONCE, M. An autochthonous geological model for the eastern Andes of Ecuador. Tectonophysics, v. 399, n. 1-4, p.251-278, 2005.
- SPIKINGS, R.; COCHRANE, R.; VILLAGOMEZ, D.; VAN DER LELIJ, R.; VALLEJO, C.; WINKLER, W.; BEATE, B. The geological history of northwestern South America: from Pangaea to the early collision of the Caribbean Large Igneous Province (290-75 Ma). Gondwana Research, v. 27, p.95-139, 2015.
- SPIKINGS, R. A.; COCHRANE, R.; VALLEJO, C.; VILLAGOMEZ, D.; VAN DER LELIJ, R.; PAUL, A.; WINKLER, W. Latest Triassic to Early Cretaceous tectonics of the Northern Andes: geochronology, geochemistry, isotopic tracing, and thermochronology. In: HORTON, B. K.; FOLGUERA, A. (ed.). Andean Tectonics [S. l.]: Elsevier, 2019. cap. 7, p. 173-208.
- TARANTOLA, A. Inverse problem theory and methods for model parameter estimation Philadelphia: SIAM, 2005. 342 p.
- TARANTOLA, A.; VALETTE B. Generalized non-linear inverse problems solved using the least square criterion. Reviews of Geophysics and Space Physics, v. 20, n. 2, p. 219-232, 1982.
- THURBER, C. H. Hypocenter-velocity structure coupling in local earthquake tomography. Physics of the Earth and Planetary Interiors v. 75, n. 1-3, p. 55-62, 1992.
- VERGELY, J. L.; VALETTE, B.; LALLEMENT, R.; RAIMOND, S. Spatial distribution of interstellar dust in the sun's vicinity-comparison with neutral sodium-bearing gas. Astronomy & Astrophysics v. A31, n. 518, p. 1-12, 2010.
Publication Dates
-
Publication in this collection
29 Mar 2021 -
Date of issue
Apr-Jun 2021
History
-
Received
12 Aug 2020 -
Accepted
29 Dec 2020


