
 Measurement of social inequalities in health: concepts and methodological approaches in the Brazilian context
This study aims to describe methodological approaches to measure and monitor health inequalities and to illustrate their applicability. The measures most frequently used in the literature were reviewed. Data on coverage and quality of pre-natal care in Brazil, from the Demographic and Maternal and Child Health Survey (PNDS-2006) and the National Health Survey (PNS-2013) were used to illustrate their applicability. Absolute and relative measures of inequalities were presented, highlighting their complementary character. Despite the progress achieved in the national indicators of pre-natal care, important inequalities were still identified between population subgroups, with no change in the magnitude of the differences throughout the studied period. Brazil has important social inequalities, whose consequences still lead to health inequalities. Their description and monitoring are highly relevant to support polices focused on those vulnerable population groups who have been left behind.
Keywords:
Health Inequalities/methods; Socioeconomic Factors; Measurements, Methods and Theories
 Thumbnail
 Thumbnail
 Thumbnail
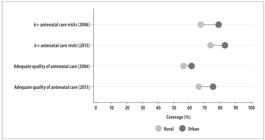
 Note: The dots show the average coverage in each category (urban/rural). The horizontal lines connect the average coverage in urban areas (light gray) to the rural areas (dark gray). The distance between circles represents the absolute inequality. The bigger the line between the groups, the higher the absolute inequality.
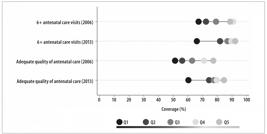
 Note: The dots show the average coverage in each wealth quintile. Q1 represents the poorest 20% and Q5 represents the wealthiest 20%. The distance between quintiles 1 and 5 represents the absolute inequality.
 Note:In figure 3(A), the dots show the average coverage observed in each wealth quintile and the line represents the estimated values. The difference between the extreme values of this distribution indicates the value of the SII (34.2 p.p.).In Figure 3(B), the CIX corresponds to twice times the area formed between the curve, which indicates the observed coverage, and the straight diagonal line, which represents perfect equality (CIX = 7.0).