ABSTRACT
Wind energy is an important electricity source. Even though it is cleaner than other energy sources in terms of greenhouse gas emissions, gathering energy from the wind has impact on organisms that fly, including bats. Understanding whether and how bat activity patterns are affected by environmental variables may be useful when trying to mitigate these impacts, for example bat mortality from collisions with wind turbines. Northeastern Brazil concentrates one of the world’s largest wind potentials and has thousands of wind turbines in operation. In spite of this scenario, there is a lack of basic information, such as the presence of bat species and their activity patterns in those wind farms. We used passive acoustic monitoring to assess species richness and species composition and obtain data on activity patterns of insectivorous bats in four wind farm complexes in northeastern Brazil. We also investigated the possible correlation between environmental variables (wind speed and direction, air temperature and humidity, and percentage of moon illumination) and bat activity. The acoustic monitoring carried out for 30 nights produced approximately 120,000 bat passes of 29 sonotypes and four families. Environmental variables may influence bat activity, but in a site-specific way, i.e., although the environmental conditions of wind-energy complexes were similar, there was not an activity pattern common to all. Considering such specificities, we strongly recommend long-term specific on-site monitoring in each wind complex, avoiding generalizations for the environmental licensing of wind energy in Brazil.
KEY WORDS:
Chiroptera; environmental impact assessments; environmental licensing; environmental variables; wind energy; wind farms
INTRODUCTION
Wind energy is one of the main electricity generation sources in alternative to fossil fuels, and the participation of wind energy in the energy matrix of several countries has grown significantly in the last decade (GWEC 2021GWEC (2021) Global Wind Report 2021. Global Wind Energy Council. https://gwec.net/global-wind-report-2021
https://gwec.net/global-wind-report-2021...
). For some countries, wind energy production has increased more than tenfold. In Brazil, for example, installed capacity was 1 GW in 2010 and increased to 18 GW in early 2021, and the country currently occupies the 8th position in the world ranking of wind energy production (ABEEólica 2021ABEEólica (2021) Energia eólica chega a 18 GW de capacidade instalada no Brasil. Associação Brasileira de Energia Eólica. http://abeeolica.org.br/noticias/energia-eolica-chega-a-18-gw-de-capacidade-instalada-no-brasil
http://abeeolica.org.br/noticias/energia...
). In February 2021, Brazil had ca. 695 wind farms installed, with approximately 8,300 wind turbines, besides more 2 GW in installation. The wind source accounted for about 10.3% of the country’s electricity (ABEEólica 2021ABEEólica (2021) Energia eólica chega a 18 GW de capacidade instalada no Brasil. Associação Brasileira de Energia Eólica. http://abeeolica.org.br/noticias/energia-eolica-chega-a-18-gw-de-capacidade-instalada-no-brasil
http://abeeolica.org.br/noticias/energia...
), which evidences the relevance of this electricity source and the sector in Brazil.
Although wind energy production is considered less polluting regarding greenhouse gas emissions, it can impact wildlife (e.g., Saidur et al. 2011Saidur R, Rahim NA, Islam MR, Solangi KH (2011) Environmental impact of wind energy. Renew Sustainable Energy Review 15: 2423-2430. https://doi.org/10.1016/j.rser.2011.02.024
https://doi.org/10.1016/j.rser.2011.02.0...
). Bats are among the main animal groups affected by wind power generation, both indirectly due to habitat loss, disturbance, displacement, and creation of movement barriers, and directly due to collisions with wind turbines and barotrauma (Barclay et al. 2007Barclay RMR, Baerwald EF, Gruver JC (2007) Variation in bat and bird fatalities at wind energy facilities: assessing the effects of rotor size and tower height. Canadian Journal of Zoology 85: 381-387. https://doi.org/10.1139/Z07-011
https://doi.org/10.1139/Z07-011...
, Kunz et al. 2007Kunz TH, Arnett EB, Erickson WP, Hoar AR, Johnson GD, Larkin RP, Strickland MD, Thresher RW, Tuttle MD (2007) Ecological impacts of wind energy development on bats: questions, research needs, and hypotheses. Frontiers in Ecology and the Environment 5: 315-324. https://doi.org/10.1890/1540-9295(2007)5[315:EIOWED]2.0.CO;2, Cryan and Barclay 2009Cryan PM, Barclay RMR (2009) Causes of bat fatalities at wind turbines: hypotheses and predictions. Journal of Mammalogy 90: 1330-1340. https://doi.org/10.1644/09-MAMM-S-076R1.1
https://doi.org/10.1644/09-MAMM-S-076R1....
, Rydell et al. 2010Rydell J, Bach L, Dubourg-Savage MJ, Green M, Rodrigues L, Hedenström A (2010) Bat mortality at wind turbines in northwestern Europe. Acta Chiropterologica 12: 261-274. https://doi.org/10.3161/150811010X537846
https://doi.org/10.3161/150811010X537846...
, Grodsky et al. 2011Grodsky SM, Behr MJ, Gendler A, Drake D, Dieterle BD, Rudd RJ, Walrath NL (2011) Investigating the causes of death for wind turbine-associated bat fatalities. Journal of Mammalogy 92: 917-925. https://doi.org/10.1644/10-MAMM-A-404.1
https://doi.org/10.1644/10-MAMM-A-404.1...
, Arnett et al. 2016Arnett EB, Baerwald EF, Mathews F, Rodrigues L, Rodríguez-Durán A, Rydell J, Villegas-Patraca R, Voigt CC (2016) Impacts of wind energy development on bats: a global perspective. In: Voigt CC, Kingston T (Eds) Bats in the Anthropocene: Conservation of Bats in a Changing World. Springer International Publishing, Cham, 295-323. https://doi.org/10.1007/978-3-319-25220-9_11
https://doi.org/10.1007/978-3-319-25220-...
). Collisions and barotrauma associated with wind turbines kill hundreds of thousands of bats annually (Hayes 2013Hayes MA (2013) Bats killed in large numbers at United States wind energy facilities. BioScience 63: 975-979. https://doi.org/10.1525/bio.2013.63.12.10
https://doi.org/10.1525/bio.2013.63.12.1...
, Frick et al. 2017Frick WF, Baerwald EF, Pollock JF, Barclay RMR, Szymanski JA, Weller TJ, Russell AL, Loeb SC, Medellin RA, McGuire LP (2017) Fatalities at wind turbines may threaten population viability of a migratory bat. Biological Conservation 209: 172-177. https://doi.org/10.1016/j.biocon.2017.02.023
https://doi.org/10.1016/j.biocon.2017.02...
). These fatalities raise conservation concerns, as bats have low reproductive rates and require a high survival rate for adults to avoid population decline (Barclay and Harder 2003Barclay RMR, Harder LM (2003) Life histories of bats: life in the slow lane. In: Kunz TH, Fenton MB (Eds) Bat ecology. University of Chicago Press, Chicago, 209-256.). Recent studies point out that wind farms are among the main threats to bats (O’Shea et al. 2016O’Shea TJ, Cryan PM, Hayman DTS, Plowright RK, Streicker DG (2016) Multiple mortality events in bats: a global review. Mammal Review 46: 175-190. https://doi.org/10.1111/mam.12064
https://doi.org/10.1111/mam.12064...
). In Brazil, the interaction with wind turbines is already recognized as one of the most relevant issues for bat conservation (Bernard et al. 2012Bernard E, Aguiar LMS, Brito D, Cruz-Neto AP, Gregorin R, Machado RB, Oprea M, Paglia AP, Tavares VC (2012) Uma análise de horizontes sobre a conservação de morcegos no Brasil. In: Freitas TRO, Vieira EM (Orgs) Mamíferos do Brasil: Genética, Sistemática, Ecologia e Conservação. Sociedade Brasileira de Mastozoologia, Rio de Janeiro, 19-35.). Thus, although the collision causes are not fully known yet, the frequency and magnitude of these collisions can be significant threats to the conservation of bat populations.
Despite the bat mortality records in wind farms in Brazil (Barros et al. 2015Barros MAS, Magalhães RG, Rui AM (2015) Species composition and mortality of bats at the Osório Wind Farm, southern Brazil. Studies on Neotropical Fauna and Environment 50: 31-39. https://doi.org/10.1080/01650521.2014.1001595
https://doi.org/10.1080/01650521.2014.10...
, Amaral et al. 2020Amaral IS, Pereira MJR, Mader A, Ferraz MR, Pereira JB, Oliveira LR (2020) Wind farm bat fatalities in southern Brazil: temporal patterns and influence of environmental factors. Hystrix 31: 40-47. https://doi.org/10.4404/hystrix-00256-2019
https://doi.org/10.4404/hystrix-00256-20...
), the knowledge about the impacts of wind turbines on bats in the country is still poor considering the number of wind farms in operation and the magnitude of investments already made. The northeastern region, which harbors the greatest potential for wind power generation and the largest wind farms installed in Brazil, with thousands of wind turbines in operation, has no published data on bat mortality from wind turbines. Besides, licensing for wind farm installation is complicated in Brazil, as there is no standardization of rules and procedures, not to mention that the rules are superficial and fail to detect the real impacts on the group (Valença and Bernard 2015Valença RB, Bernard E (2015) Another blown in the wind: bats and the licensing of wind farms in Brazil. Natureza & Conservação 13: 117-122. https://doi.org/10.1016/j.ncon.2015.09.001
https://doi.org/10.1016/j.ncon.2015.09.0...
). In addition to impacts on the flora (Neri et al. 2019Neri M, Jameli D, Bernard E, Melo FPL (2019) Green versus green? Adverting potential conflicts between wind power generation and biodiversity conservation in Brazil. Perspectives in Ecology and Conservation 17: 131-135. https://doi.org/10.1016/j.pecon.2019.08.004
https://doi.org/10.1016/j.pecon.2019.08....
), some of the areas chosen for installing wind farms are located in sites with large gaps in knowledge about the Brazilian bat fauna (Bernard et al. 2011Bernard E, Aguiar LMS, Machado RB (2011) Discovering the Brazilian bat fauna: a task for two centuries? Mammal Review 41: 23-39. https://doi.org/10.1111/j.1365-2907.2010.00164.x
https://doi.org/10.1111/j.1365-2907.2010...
). No matter how crucial the advancement of alternative energy sources may be to Brazil, proper environmental licensing for wind farm implementation cannot be neglected (Bernard et al. 2012Bernard E, Aguiar LMS, Brito D, Cruz-Neto AP, Gregorin R, Machado RB, Oprea M, Paglia AP, Tavares VC (2012) Uma análise de horizontes sobre a conservação de morcegos no Brasil. In: Freitas TRO, Vieira EM (Orgs) Mamíferos do Brasil: Genética, Sistemática, Ecologia e Conservação. Sociedade Brasileira de Mastozoologia, Rio de Janeiro, 19-35.).
Guidelines for studies on wind farm impacts on bats in Brazil have been published recently (Barros et al. 2017Barros MAS, Bernard E, Pereira MJR, Rui AM, Falcão FC, Luz JL (2017) Diretrizes para estudos de impacto de parques eólicos sobre morcegos no Brasil. https://www.sbeq.net/_files/ugd/053d6e_e440445d6703480ea175e9b9aa6c5167.pdf
https://www.sbeq.net/_files/ugd/053d6e_e...
). These guidelines point out the need for basic studies on bat presence and activity in sites where wind farms will be installed, from before construction to post-installation phases, for a better impact analysis. In fact, environmental regulatory agencies in several countries use bat presence and activity data to establish mitigation measures to improve the wind farm functioning and minimize its impact on the fauna (Valença and Bernard 2015Valença RB, Bernard E (2015) Another blown in the wind: bats and the licensing of wind farms in Brazil. Natureza & Conservação 13: 117-122. https://doi.org/10.1016/j.ncon.2015.09.001
https://doi.org/10.1016/j.ncon.2015.09.0...
).
In the current scenario of wind power production in northeastern Brazil, there is a lack on elementary and basic information, such as what species are present in the sites and how are their activity patterns. Furthermore, understanding whether and how different environmental variables affect bat activity in wind farms is essential for any mitigation processes that might be carried out in these sites (e.g., Arnett et al. 2011Arnett EB, Huso MMP, Schirmacher MR, Hayes JP (2011) Altering turbine speed reduces bat mortality at wind‐energy facilities. Frontiers in Ecology and the Environment 9: 209-214. https://doi.org/10.1890/100103
https://doi.org/10.1890/100103...
, Baerwald et al. 2009Baerwald EF, Edworthy J, Holder M, Barclay RMR (2009) A large‐scale mitigation experiment to reduce bat fatalities at wind energy facilities. The Journal of Wildlife Management 73: 1077-1081. https://doi.org/10.2193/2008-233
https://doi.org/10.2193/2008-233...
, Frick et al. 2017Frick WF, Baerwald EF, Pollock JF, Barclay RMR, Szymanski JA, Weller TJ, Russell AL, Loeb SC, Medellin RA, McGuire LP (2017) Fatalities at wind turbines may threaten population viability of a migratory bat. Biological Conservation 209: 172-177. https://doi.org/10.1016/j.biocon.2017.02.023
https://doi.org/10.1016/j.biocon.2017.02...
).
Aiming to fill these fundamental information gaps, and in the process of scientific transparency, which is fundamental for the sector, in the present study our goals were: a) identify the richness and abundance of bat species present in four wind-energy complexes in the states of Bahia, Rio Grande do Norte, and Pernambuco - the first two are among the largest wind power producers in Brazil; b) determine nocturnal activity patterns for insectivorous bat species; and c) assess whether the activity patterns of the bat species recorded were correlated with wind speed and direction, temperature, humidity, rainfall, and moon phases. Considering environmental variables may overall influence mammal activity and foraging (Amorim et al. 2012Amorim F, Rebelo H, Rodrigues L (2012) Factors influencing bat activity and mortality at a wind farm in the Mediterranean Region. Acta Chiropterologica 14: 439-57. https://doi.org/10.3161/150811012X661756
https://doi.org/10.3161/150811012X661756...
, Hayes 1997Hayes JP (1997) Temporal variation in activity of bats and the design of echolocation-monitoring studies. Journal of Mammalogy 78: 514-524., McCain 2007McCain CM (2007) Could temperature and water availability drive elevational species richness patterns? A global case study for bats. Global Ecology and Biogeography 16: 1-13. https://doi.org/10.1111/j.1466-8238.2006.00263.x
https://doi.org/10.1111/j.1466-8238.2006...
, Russo and Jones 2003Russo D, Jones G (2003) Use of foraging habitats by bats in a Mediterranean area determined by acoustic surveys: conservation implications. Ecography 26: 197-209. https://doi.org/10.1034/j.1600-0587.2003.03422.x
https://doi.org/10.1034/j.1600-0587.2003...
, Wellig et al. 2018Wellig SD, Nusslé S, Miltner D, Kohle O, Glaizot O, Braunisch V, et al. (2018) Mitigating the negative impacts of tall wind turbines on bats: Vertical activity profiles and relationships to wind speed. PLoS ONE 13: e0192493. https://doi.org/10.1371/journal.pone.0192493
https://doi.org/10.1371/journal.pone.019...
), we expected that activity at the wind complexes - expressed by the recorded bats’ echolocation calls - would be correlated to the variables analyzed. This information is useful, for example, to identify periods and conditions of higher activity and, therefore, collision risk, an information essential for mitigating measures (e.g., Baerwald et al. 2009Baerwald EF, Edworthy J, Holder M, Barclay RMR (2009) A large‐scale mitigation experiment to reduce bat fatalities at wind energy facilities. The Journal of Wildlife Management 73: 1077-1081. https://doi.org/10.2193/2008-233
https://doi.org/10.2193/2008-233...
, Arnett et al. 2011Arnett EB, Huso MMP, Schirmacher MR, Hayes JP (2011) Altering turbine speed reduces bat mortality at wind‐energy facilities. Frontiers in Ecology and the Environment 9: 209-214. https://doi.org/10.1890/100103
https://doi.org/10.1890/100103...
, 2016Arnett EB, Baerwald EF, Mathews F, Rodrigues L, Rodríguez-Durán A, Rydell J, Villegas-Patraca R, Voigt CC (2016) Impacts of wind energy development on bats: a global perspective. In: Voigt CC, Kingston T (Eds) Bats in the Anthropocene: Conservation of Bats in a Changing World. Springer International Publishing, Cham, 295-323. https://doi.org/10.1007/978-3-319-25220-9_11
https://doi.org/10.1007/978-3-319-25220-...
).
MATERIAL AND METHODS
Study Area
We sampled four wind-energy complexes between September 2015 and January 2017, in the states of Rio Grande do Norte, Pernambuco, and Bahia (Fig. 1). They are located within the Caatinga biome, which comprises most of northeastern Brazil’s inland area. The average temperature is constant throughout the year in the Caatinga, varying from 25 to 30 °C. However, the annual rainfall varies widely in time and space. Most of the region receives between 600 and 1,000 mm of rain per year, but in some mountainous areas, the rainfall can reach 1,800 mm per year due to the relief (Silva et al. 2018aSilva JMC, Leal IR, Tabarelli M (2018a) Caatinga: the largest tropical dry forest region in South America. Springer, Cham. 482 p.). The number of dry months increases from the edges to the center of the region; some areas undergo periods of seven to ten months without rain. An important characteristic of the Caatinga is the high interannual variability in rainfall, with droughts that can last for years (Silva et al. 2018aSilva JMC, Leal IR, Tabarelli M (2018a) Caatinga: the largest tropical dry forest region in South America. Springer, Cham. 482 p.).

Wind-energy complexes in northeastern Brazil studied for the presence and activity of insectivorous bats from September 2015 to January 2017.
The wind farms sampled were distributed as follows:
State of Bahia, municipality of Caetité, Curva dos Ventos wind-energy complex, comprising two wind farms (24 wind turbines), where we selected three sampling points (hereinafter referred to as P1, P2, and P3), with three data collection campaigns, each one including three nights of recording (Supplementary Material - Table S1 Supplementary material 1 Table S1. Environmental characteristics and activity of insectivorous bats obtained by bioacoustics in four wind-energy complexes in northeastern Brazil, from September 2015 to January 2017. Coord. = coordinates; Speed = wind speed (km/h); Elevation (m); Date = dd/mm//yyyy; Effort = sampling effort (min); Dir. = wind direction (in degrees); Temp. = air temperature (°C); Humid. = air humidity (%); Rain = rainfall (mm); Moon = percentage of illumination of the moon; Pulses = bat activity (pulses); Pulses/min. = pulses recorded per minute; Spp. rich. = sonotype richness, based on the bat echolocation signals; BA = state of Bahia; RN = State of Rio Grande do Norte; PE = state of Pernambuco. Authors: Carolina G. Pereira, Fábio Falcão, Enrico Bernard Data type: species data. Copyright notice: This dataset is made available under the Open Database License (http://opendatacommons.org/licenses/odbl/1.0). The Open Database License (ODbL) is a license agreement intended to allow users to freely share, modify, and use this Dataset while maintaining this same freedom for others, provided that the original source and author(s) are credited. Link: https://doi.org/10.1590/S1984-4689.v39.e21041 ). The predominant vegetation is typical of the Cerrado, with cerrado sensu stricto vegetation in good conservation status. There was a wide range of habitat types, including open savanna (campo sujo) and deciduous shrubland areas (carrasco) under a strong influence of the Caatinga in the surroundings.
State of Bahia, municipality of Morro do Chapéu, Cristal wind-energy complex, comprising three wind farms (39 wind turbines), where we selected three sampling points (hereinafter referred to as P4, P5, and P6), with three data collection campaigns of three nights of recordings each (Table S1 Supplementary material 1 Table S1. Environmental characteristics and activity of insectivorous bats obtained by bioacoustics in four wind-energy complexes in northeastern Brazil, from September 2015 to January 2017. Coord. = coordinates; Speed = wind speed (km/h); Elevation (m); Date = dd/mm//yyyy; Effort = sampling effort (min); Dir. = wind direction (in degrees); Temp. = air temperature (°C); Humid. = air humidity (%); Rain = rainfall (mm); Moon = percentage of illumination of the moon; Pulses = bat activity (pulses); Pulses/min. = pulses recorded per minute; Spp. rich. = sonotype richness, based on the bat echolocation signals; BA = state of Bahia; RN = State of Rio Grande do Norte; PE = state of Pernambuco. Authors: Carolina G. Pereira, Fábio Falcão, Enrico Bernard Data type: species data. Copyright notice: This dataset is made available under the Open Database License (http://opendatacommons.org/licenses/odbl/1.0). The Open Database License (ODbL) is a license agreement intended to allow users to freely share, modify, and use this Dataset while maintaining this same freedom for others, provided that the original source and author(s) are credited. Link: https://doi.org/10.1590/S1984-4689.v39.e21041 ). The predominant vegetation is typical of the Caatinga domain, with dense arboreal-shrubby caatinga in good conservation status. A few stretches are characterized by an open and anthropized area, with a shrubby caatinga secondary vegetation in regeneration.
State of Rio Grande do Norte, municipality of João Câmara, Modelo wind-energy complex, comprising two wind farms (24 wind turbines), where we selected three sampling points (hereinafter P7, P8, and P9), with two data collection campaigns of three nights of recordings each (Table S1 Supplementary material 1 Table S1. Environmental characteristics and activity of insectivorous bats obtained by bioacoustics in four wind-energy complexes in northeastern Brazil, from September 2015 to January 2017. Coord. = coordinates; Speed = wind speed (km/h); Elevation (m); Date = dd/mm//yyyy; Effort = sampling effort (min); Dir. = wind direction (in degrees); Temp. = air temperature (°C); Humid. = air humidity (%); Rain = rainfall (mm); Moon = percentage of illumination of the moon; Pulses = bat activity (pulses); Pulses/min. = pulses recorded per minute; Spp. rich. = sonotype richness, based on the bat echolocation signals; BA = state of Bahia; RN = State of Rio Grande do Norte; PE = state of Pernambuco. Authors: Carolina G. Pereira, Fábio Falcão, Enrico Bernard Data type: species data. Copyright notice: This dataset is made available under the Open Database License (http://opendatacommons.org/licenses/odbl/1.0). The Open Database License (ODbL) is a license agreement intended to allow users to freely share, modify, and use this Dataset while maintaining this same freedom for others, provided that the original source and author(s) are credited. Link: https://doi.org/10.1590/S1984-4689.v39.e21041 ). The predominant vegetation throughout the region is a relatively homogeneous arboreal-shrubby caatinga.
State of Pernambuco, municipality of Tacaratu, Fonte dos Ventos wind-energy complex, comprising three wind farms (52 wind turbines), where we selected six sampling points (hereinafter P10 to P15), and sampled each point only once (Table S1 Supplementary material 1 Table S1. Environmental characteristics and activity of insectivorous bats obtained by bioacoustics in four wind-energy complexes in northeastern Brazil, from September 2015 to January 2017. Coord. = coordinates; Speed = wind speed (km/h); Elevation (m); Date = dd/mm//yyyy; Effort = sampling effort (min); Dir. = wind direction (in degrees); Temp. = air temperature (°C); Humid. = air humidity (%); Rain = rainfall (mm); Moon = percentage of illumination of the moon; Pulses = bat activity (pulses); Pulses/min. = pulses recorded per minute; Spp. rich. = sonotype richness, based on the bat echolocation signals; BA = state of Bahia; RN = State of Rio Grande do Norte; PE = state of Pernambuco. Authors: Carolina G. Pereira, Fábio Falcão, Enrico Bernard Data type: species data. Copyright notice: This dataset is made available under the Open Database License (http://opendatacommons.org/licenses/odbl/1.0). The Open Database License (ODbL) is a license agreement intended to allow users to freely share, modify, and use this Dataset while maintaining this same freedom for others, provided that the original source and author(s) are credited. Link: https://doi.org/10.1590/S1984-4689.v39.e21041 ). The caatinga is the predominant vegetation, with dense arboreal-shrubby caatinga. A few stretches have a shrubby caatinga secondary vegetation in regeneration. All points were selected from satellite images (Google Earth, https://earth.google.com/web), to include different areas within each wind-energy complex.
Data collection
We used one echolocation signal recorder per sampling point (full spectrum Song Meter SM2 BAT+), with an SMX-U1 microphone (http://www.wildlifeacoustics.com) to record bat activity. The recorder was configured at a sampling rate of 384 kHz, with a 16-bit resolution, to record only sound signals between 12 kHz and 192 kHz, with a minimum of 12 dB SNR (signal to noise ratio). The recording protocol we used comprised five minutes of recording and five minutes of pause, totaling a maximum of six hours of recording per night, always from 06:00 pm to 06:00 am. An extra recorder (model: EM3+) was used only in the Fonte dos Ventos wind-energy complex at point P12, with the same configuration as the others. In all sessions, the recorders were installed on a three-meter-high stick to improve recording. The recordings generated on each recorder were stored on SD cards in .wac format.
Acoustic analysis
We used the Kaleidoscope software (http://www.wildlifeacoustics.com) to convert the original files from the .wac format to .wav, clean up the noise, and divide the recordings into 10-second segments for better visualization of the pulses in sonograms. We used the SonoChiro software (http://www.biotope.fr) to count the pulses recorded in each 10-second segment, configuring it for level 7 of sensitivity and minimum pulse duration of 0.2 ms. We calculated bat activity based on the number of pulses per night and grouped it in one-hour intervals (from 6:00 pm to 6:00 am) in an electronic worksheet. We adopted an activity index based on the number of pulses recorded per sampling night, divided by the effort of the recording time (in minutes). We used descriptive statistics to analyze possible activity patterns in each campaign and wind-energy complex considered alone or together, with all records obtained.
Species richness
We used the Raven Pro 1.5 software (http://www.birds.cornell.edu/brp/raven/RavenVersions.html) to extract parameters to identify echolocation signals. We viewed each 10-second file in spectrograms using a Hanning window, with 1024 samples of DFT size and 375-Hz spacing, overlap up to 80% and hop size of 205 samples, 3-dB filter with 539-Hz length. For each pulse sequence identified, we selected three or more good quality pulses and extracted the following measurements: minimum frequency (Fmin), maximum frequency (Fmax), maximum energy frequency (MEF), and bandwidth (BW, the difference between Fmax and Fmin), all in kHz. We also extracted the interval between pulses (IPI) and pulse duration (Dur), both in milliseconds (ms).
In addition to these parameters, we characterized sequences regarding the signal structure and classified them as frequency-modulated (FM), quasi-constant frequency (QCF), and constant frequency (CF). We also recorded the presence of pulse harmonics and alternation of signal and frequencies. We compared the extracted parameters with the literature and the signals from a bat-sound library in Brazil (Arias-Aguillar et al. 2018Arias-Aguilar A, Hintze F, Aguiar LMS, Rufray V, Bernard E, Pereira MJR (2018) Who’s calling? Acoustic identification of Brazilian bats. Mammalian Research 63: 231-253. https://doi.org/10.1007/s13364-018-0367-z
https://doi.org/10.1007/s13364-018-0367-...
), identifying the sequences at the most specific level possible. Sequences or signals for which it was not possible a correct identification were classified into sonotypes.
Environmental variables
The anemometric towers located in the wind-energy complexes recorded air temperature and humidity, wind direction, and speed at every hour. We obtained those data upon request to the company responsible for each wind-energy complex. We obtained daily rainfall data from the PROCLIMA website (http://www.proclima.cptec.inpe.br). We calculated moon phases through the percentage of illumination obtained from the Daff Lua app (https://play.google.com/store) and obtained elevation data via Google Earth (https://www.google.com.br/intl/pt-BR/earth) using the geographical coordinates of the wind-energy complexes. We did not consider the time of the night the moon was in the sky because that would require a detailed minute by minute nightly analysis.
Bat activity and environmental variables
We grouped the data on environmental variables and activity by hour and recorded them on worksheets. We analyzed normality with the Shapiro-Wilk test and verified that bat activity did not have a normal distribution (p < 0.005). To test possible linear regressions between bat activity and environmental variables (temperature, humidity, wind speed, wind direction, moon phases, and rainfall), we used generalized linear models (GLM) with Quasipoisson distribution due to overdispersion and the F test for deviation analysis (Zuur et al. 2013Zuur AF, Hilbe JM, Ieno EN (2013) A Beginner’s Guide to GLM and GLMM with R: a frequentist and Bayesian perspective for ecologists. Highland Statistics Newburgh, United Kingdom, 256 p.). We analyzed the collinearity of environmental variables using the pairs function of the R program (R Development Core Team 2009R Development Core Team (2009) R: A Language and Environment for Statistical Computing. R Foundation for Statistical Computing, Vienna. http://www.R-project.org
http://www.R-project.org...
). As humidity was negatively correlated with temperature (r = -0.59), we excluded it from the models. We compared bat activity between wind-energy complexes using a generalized linear mixed model (GLMM) with Quasipoisson distribution, with date and month as a random factor, and sampling effort as offset. All analyzes were performed using the R program, version 3.5.1 (R Development Core Team 2009). The results were considered significant with a p ≤ 0.05.
RESULTS
Environmental characterization
In the Curva dos Ventos complex, the wind speed varied between 3.1 to 13.2 m/s, with an average of 7.4 ± 2.5 m/s (Supplementary Material - Fig. S1A Supplementary material 3 Figure S1. Wind speed histogram for the wind-energy complexes Curva dos Ventos (A), Cristal (B), Modelo (C), and Fonte dos Ventos (D), all in northeastern Brazil, from September 2015 to January 2017. Vertical axes represent number of records. Authors: Carolina G. Pereira, Fábio Falcão, Enrico Bernard Data type: climate data. Copyright notice: This dataset is made available under the Open Database License (http://opendatacommons.org/licenses/odbl/1.0). The Open Database License (ODbL) is a license agreement intended to allow users to freely share, modify, and use this Dataset while maintaining this same freedom for others, provided that the original source and author(s) are credited. Link: https://doi.org/10.1590/S1984-4689.v39.e21041 ). The wind direction varied between 88.3 and 135.0°, with an average of 98 ± 1.7° (Fig. S2A Supplementary material 4 Figure S2. Wind direction histogram for the wind-energy complexes Curva dos Ventos (A), Cristal (B), Modelo (C), and Fonte dos Ventos (D), all in northeastern Brazil, from September 2015 to January 2017. Vertical axes represent number of records. Authors: Carolina G. Pereira, Fábio Falcão, Enrico Bernard Data type: climate data. Copyright notice: This dataset is made available under the Open Database License (http://opendatacommons.org/licenses/odbl/1.0/). The Open Database License (ODbL) is a license agreement intended to allow users to freely share, modify, and use this Dataset while maintaining this same freedom for others, provided that the original source and author(s) are credited. Link: https://doi.org/10.1590/S1984-4689.v39.e21041 ). In the Cristal complex, the wind speed varied from 2.1 to 12.8 m/s, with an average of 8.0 ± 1.8 m/s (Fig. S1B Supplementary material 3 Figure S1. Wind speed histogram for the wind-energy complexes Curva dos Ventos (A), Cristal (B), Modelo (C), and Fonte dos Ventos (D), all in northeastern Brazil, from September 2015 to January 2017. Vertical axes represent number of records. Authors: Carolina G. Pereira, Fábio Falcão, Enrico Bernard Data type: climate data. Copyright notice: This dataset is made available under the Open Database License (http://opendatacommons.org/licenses/odbl/1.0). The Open Database License (ODbL) is a license agreement intended to allow users to freely share, modify, and use this Dataset while maintaining this same freedom for others, provided that the original source and author(s) are credited. Link: https://doi.org/10.1590/S1984-4689.v39.e21041 ). The wind direction varied between 48.1 to 123.0°, with an average of 92.5 ± 1.5° (Fig. S2B Supplementary material 4 Figure S2. Wind direction histogram for the wind-energy complexes Curva dos Ventos (A), Cristal (B), Modelo (C), and Fonte dos Ventos (D), all in northeastern Brazil, from September 2015 to January 2017. Vertical axes represent number of records. Authors: Carolina G. Pereira, Fábio Falcão, Enrico Bernard Data type: climate data. Copyright notice: This dataset is made available under the Open Database License (http://opendatacommons.org/licenses/odbl/1.0/). The Open Database License (ODbL) is a license agreement intended to allow users to freely share, modify, and use this Dataset while maintaining this same freedom for others, provided that the original source and author(s) are credited. Link: https://doi.org/10.1590/S1984-4689.v39.e21041 ). In the Modelo complex, the wind speed varied from 5.2 to 11.2 m/s, with an average of 7.5 ± 1.4 m/s (Fig. S1C Supplementary material 3 Figure S1. Wind speed histogram for the wind-energy complexes Curva dos Ventos (A), Cristal (B), Modelo (C), and Fonte dos Ventos (D), all in northeastern Brazil, from September 2015 to January 2017. Vertical axes represent number of records. Authors: Carolina G. Pereira, Fábio Falcão, Enrico Bernard Data type: climate data. Copyright notice: This dataset is made available under the Open Database License (http://opendatacommons.org/licenses/odbl/1.0). The Open Database License (ODbL) is a license agreement intended to allow users to freely share, modify, and use this Dataset while maintaining this same freedom for others, provided that the original source and author(s) are credited. Link: https://doi.org/10.1590/S1984-4689.v39.e21041 ). The wind direction varied from 97.9 to 153.8°, with an average of 131 ± 1.6° (Fig. S2C Supplementary material 4 Figure S2. Wind direction histogram for the wind-energy complexes Curva dos Ventos (A), Cristal (B), Modelo (C), and Fonte dos Ventos (D), all in northeastern Brazil, from September 2015 to January 2017. Vertical axes represent number of records. Authors: Carolina G. Pereira, Fábio Falcão, Enrico Bernard Data type: climate data. Copyright notice: This dataset is made available under the Open Database License (http://opendatacommons.org/licenses/odbl/1.0/). The Open Database License (ODbL) is a license agreement intended to allow users to freely share, modify, and use this Dataset while maintaining this same freedom for others, provided that the original source and author(s) are credited. Link: https://doi.org/10.1590/S1984-4689.v39.e21041 ). In the Fonte dos Ventos complex the wind speed varied between 6.2 to 10.3 m/s, with an average of 8.4 ± 0.9 m/s (Fig. S1D Supplementary material 3 Figure S1. Wind speed histogram for the wind-energy complexes Curva dos Ventos (A), Cristal (B), Modelo (C), and Fonte dos Ventos (D), all in northeastern Brazil, from September 2015 to January 2017. Vertical axes represent number of records. Authors: Carolina G. Pereira, Fábio Falcão, Enrico Bernard Data type: climate data. Copyright notice: This dataset is made available under the Open Database License (http://opendatacommons.org/licenses/odbl/1.0). The Open Database License (ODbL) is a license agreement intended to allow users to freely share, modify, and use this Dataset while maintaining this same freedom for others, provided that the original source and author(s) are credited. Link: https://doi.org/10.1590/S1984-4689.v39.e21041 ). The wind direction varied from 97.9 to 153.8°, with an average of 131.6 ± 1.6° (Fig. S2D Supplementary material 4 Figure S2. Wind direction histogram for the wind-energy complexes Curva dos Ventos (A), Cristal (B), Modelo (C), and Fonte dos Ventos (D), all in northeastern Brazil, from September 2015 to January 2017. Vertical axes represent number of records. Authors: Carolina G. Pereira, Fábio Falcão, Enrico Bernard Data type: climate data. Copyright notice: This dataset is made available under the Open Database License (http://opendatacommons.org/licenses/odbl/1.0/). The Open Database License (ODbL) is a license agreement intended to allow users to freely share, modify, and use this Dataset while maintaining this same freedom for others, provided that the original source and author(s) are credited. Link: https://doi.org/10.1590/S1984-4689.v39.e21041 ).
Bat activity
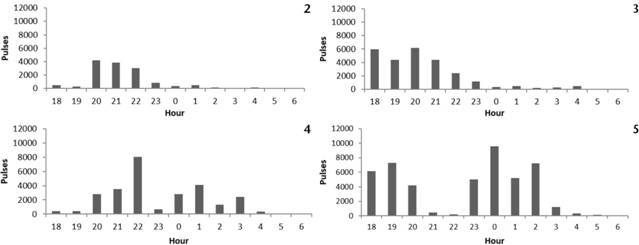
Despite the higher effort (3,240 min.), the Curva dos Ventos and Cristal complexes showed the lowest activity rates, with 4.35 and 8.10 pulses/min., respectively (Table S1 Supplementary material 1 Table S1. Environmental characteristics and activity of insectivorous bats obtained by bioacoustics in four wind-energy complexes in northeastern Brazil, from September 2015 to January 2017. Coord. = coordinates; Speed = wind speed (km/h); Elevation (m); Date = dd/mm//yyyy; Effort = sampling effort (min); Dir. = wind direction (in degrees); Temp. = air temperature (°C); Humid. = air humidity (%); Rain = rainfall (mm); Moon = percentage of illumination of the moon; Pulses = bat activity (pulses); Pulses/min. = pulses recorded per minute; Spp. rich. = sonotype richness, based on the bat echolocation signals; BA = state of Bahia; RN = State of Rio Grande do Norte; PE = state of Pernambuco. Authors: Carolina G. Pereira, Fábio Falcão, Enrico Bernard Data type: species data. Copyright notice: This dataset is made available under the Open Database License (http://opendatacommons.org/licenses/odbl/1.0). The Open Database License (ODbL) is a license agreement intended to allow users to freely share, modify, and use this Dataset while maintaining this same freedom for others, provided that the original source and author(s) are credited. Link: https://doi.org/10.1590/S1984-4689.v39.e21041 ). With less effort (2,160 min.), the Modelo and Fonte dos Ventos complexes showed activity rates of 12.47 and 21.69 pulses/min., respectively (Table S1 Supplementary material 1 Table S1. Environmental characteristics and activity of insectivorous bats obtained by bioacoustics in four wind-energy complexes in northeastern Brazil, from September 2015 to January 2017. Coord. = coordinates; Speed = wind speed (km/h); Elevation (m); Date = dd/mm//yyyy; Effort = sampling effort (min); Dir. = wind direction (in degrees); Temp. = air temperature (°C); Humid. = air humidity (%); Rain = rainfall (mm); Moon = percentage of illumination of the moon; Pulses = bat activity (pulses); Pulses/min. = pulses recorded per minute; Spp. rich. = sonotype richness, based on the bat echolocation signals; BA = state of Bahia; RN = State of Rio Grande do Norte; PE = state of Pernambuco. Authors: Carolina G. Pereira, Fábio Falcão, Enrico Bernard Data type: species data. Copyright notice: This dataset is made available under the Open Database License (http://opendatacommons.org/licenses/odbl/1.0). The Open Database License (ODbL) is a license agreement intended to allow users to freely share, modify, and use this Dataset while maintaining this same freedom for others, provided that the original source and author(s) are credited. Link: https://doi.org/10.1590/S1984-4689.v39.e21041 ). In the Curva dos Ventos complex, bat activity varied from 10 to 6,485 pulses. There were activity peaks between 08:00 and 11:00 pm (Fig. 2). In the first campaign, activity peaks varied after 08:00 pm; in the second campaign, there were activity peaks at different hours of the night, with the highest peak recorded at 08:00 pm (503 pulses) and the lowest activity at 05:00 am (11 pulses). In the Cristal complex, bat activity varied from 12,232 to 298 pulses. We found an activity pattern commonly reported for insectivorous species: a predominant peak in the first four hours after sunset followed by a decrease throughout the night (Fig. 3). The second campaign showed higher activity (with 13,062 pulses counted) than the first campaign (with 3,395 pulses). In the Modelo complex, bat activity was constant throughout the night, but with activity peaks at specific times, between 10:00 pm and 01:00 am (Fig. 4). The first campaign showed higher activity, with 14,184 pulses, whereas the second campaign counted 12,769 pulses. Both campaigns showed the highest activity peak at 10:00 pm (first campaign with 3,100 pulses and second campaign with 4,946 pulses). The Fonte dos Ventos complex showed a bimodal activity pattern: in the first three hours after sunset, with a peak at 07:00 pm and 7,265 pulses, and another peak at 00:00 am, with 9,540 pulses (Fig. 5).

Bat activity based on the pooled number of echolocation pulses per hour in four wind-energy complexes in northeastern Brazil, from September 2015 to January 2017: (2) Curva dos Ventos, municipality of Caetité, state of Bahia; (3) Cristal, municipality of Morro do Chapéu, state of Bahia; (4) Modelo, municipality of João Câmara, state of Rio Grande do Norte; (5) Fonte dos Ventos, municipality of Tacaratu, state of Pernambuco.
Bat activity and environmental variables
In the Curva dos Ventos complex, the temperature (p = 0.008) showed influence on bat activity, with slightly more activity at higher temperatures (Residual Deviation: 44637, df = 111). In the Cristal complex, the temperature (p < 0.005), wind speed (p = 0.002), and wind direction (p = 0.017) were the variables that best explained bat activity (Residual Deviation: 47256, df = 112). For the Modelo (Residual Deviation: 78459, df = 72) and Fonte dos Ventos complexes (Residual Deviation: 118386, df = 73), none of the variables was significant. The number of pulses did not differ between wind-energy complexes (Supplementary Material 2 - Table S2 Supplementary material 2 Table S2. Summary of Generalized Linear Mixed Models examining bat activity of each wind farm complex. Date and month were used as a random factor, and sampling effort as offset. Authors: Carolina G. Pereira, Fábio Falcão, Enrico Bernard Data type: species data. Copyright notice: This dataset is made available under the Open Database License (http://opendatacommons.org/licenses/odbl/1.0). The Open Database License (ODbL) is a license agreement intended to allow users to freely share, modify, and use this Dataset while maintaining this same freedom for others, provided that the original source and author(s) are credited. Link: https://doi.org/10.1590/S1984-4689.v39.e21041 ).
Species richness
We recorded 29 sonotypes: 15 of Vespertilionidae, 10 of Molossidae, three of Emballonuridae, one of Mormoopidae (Table 1). The Curva dos Ventos and Modelo complexes showed the highest sonotype richness, with 20 (11 Vespertilionidae, 6 Molossidae, and 3 Emballonuridae), and 19 sonotypes (10 Vespertilionidae, 7 Molossidae, one Mormoopidae, and one Emballonuridae), respectively. The Fonte dos Ventos complex showed 13 sonotypes (5 Vespertilionidae, 4 Molossidae, 3 Emballonuridae, and one Mormoopidae). The Cristal complex showed the lowest richness, with six sonotypes (4 Vespertilionidae and 2 Molossidae; Fig. 6).

Bat species richness recorded based on bioacoustics in four wind-energy complexes in northeastern Brazil from September 2015 to January 2017.
Sonotypes identified based on bat echolocation calls recorded in four wind-energy complexes in northeastern Brazil from September 2015 to January 2017.
Among the 16 sonotypes found in the Curva dos Ventos complex, we identified the vespertilionids Lasiurus ega (Gervais, 1856), Lasiurus blossevillii ([Lesson, 1826]), Lasiurus villosissimus (É. Geoffroy, 1806), Eptesicus chiriquinus Thomas, 1920, Eptesicus furinalis (d’Orbigny and Gervais, 1847), Eptesicus brasiliensis (Desmarest, 1819), Myotis sp. 1, Histiotus sp. 2, and Myotis sp./Rhogeessa sp. (Table 1). An unidentified sonotype was assigned to this family, named Vespertilionidae 2, with structure FMdqCFd, FME < 30 kHz, and Fmin < 20 kHz. For the Molossidae, we identified Molossops temminckii (Burmeister, 1854), Molossops neglectus Williams e Genoways, 1980, and Cynomops sp. Three unidentified sonotypes were attributed to Molossidae due to the characteristics of their pulses: Molossidae 1, with structure FMdqCFd and Fmin = 23 kHz; Molossidae 2, with structure FMaqCFd and Fmin between 37 and 40 kHz; and Molossidae 4, with structure FMdqCFd, Fmin ≈ 28 kHz, FME = 31 kHz, and Fmax = 35 kHz (Table 1).
In the Cristal complex, we recorded six sonotypes: Myotis sp./Rhogeessa sp.; L. blossevillii; Myotis lavali Moratelli, Peracchi, Dias and Oliveira, 2011; a sonotype named Vespertilionidae 2, with structure FMdqCFd, FME < 30 kHz and Fmin < 20Khz; Nyctinomops macrotis (Gray, 1840)/Eumops sp.; and a sonotype named Molossidae 4, with structure FMdqCFd and Fmin = 28 kHz (Table 1).
In the Modelo complex, we recorded 19 sonotypes: Myotis sp./Rhogeessa sp.; L. ega; E. chiriquinus; L. blossevillii; Myotis sp. 1; Myotis sp. 3; Histiotus sp. 3.; Histiotus sp. 1; Vespertilionidae 2, with structure FMdqCFd, FME < 30 kHz, and Fmin < 20 kHz; Vespertilionidae 1, with structure FMdqCFd, Fmin > 30 kHz, FME ≈ 40 kHz, Fmax > 50 kHz; M. neglectus; Eumops sp.; Molossus molossus Pallas, 1766; Cynomops sp.; Molossidae 4, with structure FMdqCFd and Fmin = 28 kHz; Molossidae 1, with structure FMdqCFd and Fmin = 23 kHz; Molossidae 2, with structure FMaqCFd and Fmin from 37 to 40 kHz; Peropteryx macrotis (Wagner, 1843); and Pteronotus gymnonotus (Wagner, 1843) (Table 1).
In the Fonte dos Ventos complex, we recorded 14 sonotypes: Histiotus sp. 1; L. blossevillii; Myotis sp. 1; E. brasiliensis; Vespertilionidae 2, with structure FMdqCFd, FME < 30 kHz, and Fmin < 20 kHz; M. neglectus; Promops nasutus (Spix, 1823); Eumops sp.; Molossidae 4, with structure FMd qCFd and Fmin = 28 kHz; Molossidae 2, with structure FMaqCFd and Fmin from 37 to 40 kHz; Molossidae 3, with Fmin < 18 kHz; P. macrotis; Peropteryx sp. 1; and P. gymnonotus (Table 1).
DISCUSSION
We analyzed the activity patterns of insectivorous bats using bioacoustics in four wind-energy complexes in northeastern Brazil, testing possible correlations between bat activity and environmental variables and trying to identify which of those variables may influence bat activity. However, this influence is site-specific, i.e., although the environmental conditions in wind-energy complexes are similar, we could not identify a single activity pattern common to all wind farms analyzed; each wind-energy complex had a specific bat activity pattern.
Northeastern Brazil has unique wind characteristics, high solar radiation, little cloudiness, low relative humidity, and average temperatures between 25 and 30 °C and, as the most remarkable characteristic, low and irregular rainfall, usually concentrated in only three months of the year, resulting in a long characteristic annual drought (Silva et al. 2018aSilva JMC, Leal IR, Tabarelli M (2018a) Caatinga: the largest tropical dry forest region in South America. Springer, Cham. 482 p.). Although there were differences in the climate variation between the wind-energy complexes studied, these complexes experience very similar climate conditions and differences were subtle. Temperature (in the case of Curva dos Ventos and Cristal) and wind speed and direction (for Cristal only) explained part of the bat activity for some complexes, but not for all of them. In this context, climate conditions alone do not explain the overall bat activity, which points out that other factors should be considered. Simultaneously sampling at different wind complexes - an ideal approach we could not adopt due to logistical constrains - could also clarify the precise role climatic variables may have on the overall bat activity.
The local species richness could help to understand the differences observed. We recorded a high species diversity and variation in species richness and composition in each wind-energy complex. The observed richness varied from six to 21 sonotypes, with a total of 29 sonotypes recorded. All wind farms sampled are within the Caatinga biome, a neotropical dry forest with high biodiversity (Silva et al. 2018aSilva JMC, Leal IR, Tabarelli M (2018a) Caatinga: the largest tropical dry forest region in South America. Springer, Cham. 482 p.). Recent studies indicate that the bat richness in the Caatinga comprises at least 96 species (Silva et al. 2018bSilva UBT, Delgado-Jaramillo M, Aguiar LMS, Bernard E (2018b) Species richness, geographic distribution, pressures, and threats to bats in the Caatinga drylands of Brazil. Biological Conservation 221: 312-322. https://doi.org/10.1016/j.biocon.2018.03.028
https://doi.org/10.1016/j.biocon.2018.03...
). The richness observed in the wind farms we sampled indicated that, besides the common species among wind-energy complexes (L. blossevillii, Myotis sp. 1, Eumops sp.), there was also the presence of exclusive species in the Curva dos Ventos, Modelo, and Fonte dos Ventos wind-energy complexes (see Table 1). Hence, the different species composition of each complex can explain the different activity patterns observed. This is more evident when bat activity and richness of each wind farm and each campaign are analyzed alone. Thus, wind-energy complexes with different species richness also showed different activity patterns.
The Caatinga has high heterogeneity in vegetation, soil types, and climate conditions, comprising areas of savannas, rainforests, and rocky grasslands inserted in a large matrix of dry forest mixed with transition areas (Silva et al. 2018aSilva JMC, Leal IR, Tabarelli M (2018a) Caatinga: the largest tropical dry forest region in South America. Springer, Cham. 482 p.). This high floristic heterogeneity influences fauna richness, as some species show preferences for a particular type of environment composition (Silva et al. 2018a). The modeling of potential bat species distribution in the Caatinga showed that richness is associated with certain vegetation types. The higher potential for species occurred in the western region, in the contact between the Caatinga and Atlantic Forest biomes, and the lowest potential for species occurred in the eastern region, in the transition zone between the Caatinga and the Cerrado (Silva et al. 2018bSilva UBT, Delgado-Jaramillo M, Aguiar LMS, Bernard E (2018b) Species richness, geographic distribution, pressures, and threats to bats in the Caatinga drylands of Brazil. Biological Conservation 221: 312-322. https://doi.org/10.1016/j.biocon.2018.03.028
https://doi.org/10.1016/j.biocon.2018.03...
). In the present study, the wind-energy complex located more to the east (Modelo, in the state of Rio Grande do Norte) showed higher species richness per night (3.16 sp./night) than other wind farms located more to the west (Curva dos Ventos, with 2.33 sp./night; and Cristal, with 0.66 sp./night). Thus, the wind farm location is also a variable that may help better understand what bat activity patterns would be expected for that site. Further studies, with a larger sample size, wind farms distributed in more locations, and simultaneous sampling could prove whether the location is indeed an important variable that should be considered.
Site-specific and group-specific characteristics
Although there was no common pattern in bat activity among the wind-energy complexes analyzed, it was possible to detect site-specific characteristics when these complexes are studied alone. Despite the differences between campaigns, there was a predominant activity peak in the first four hours after sunset in the Cristal complex. In Curva dos Ventos these peaks were concentrated in the first five hours after sunset. In Fonte dos Ventos there was a bimodal activity pattern: one peak in the first four hours after sunset and another around midnight. In Modelo there was a uniform activity pattern throughout the nights. As mentioned earlier, these different activities can be explained by the different species richness and compositions of each wind farm.
Several factors can influence variations in activity patterns between different species, such as the preferred or available food type, the species physiology, or the foraging strategy adopted by each species (e.g., Denzinger and Schnitzler 2013Denzinger A, Schnitzler H-U (2013) Bat guilds, a concept to classify the highly diverse foraging and echolocation behaviors of microchiropteran bat. Frontiers in Physiology 4: 164. https://doi.org/10.3389/fphys.2013.00164
https://doi.org/10.3389/fphys.2013.00164...
). The highest bat activity peak in the early night hours probably occurs because of a long period of fasting in the roost, and the decrease in activity during the night may correspond to a return of these individuals to their roosts (e.g., Hayes 1997Hayes JP (1997) Temporal variation in activity of bats and the design of echolocation-monitoring studies. Journal of Mammalogy 78: 514-524.). The initial activity peak in the early night hours is a known pattern for other areas and environments, and the bimodal pattern is typical of insectivorous bat species (Kunz 1973Kunz TH (1973) Resource utilization: temporal and spatial components of bat activity in central Iowa. Journal of Mammalogy 54: 14-32., Erkert 1982Erkert HG (1982) Ecological aspects of bat activity rhythms. In: Kunz TH (eds) Ecology of Bats. Springer, Boston, 201-242., Taylor and O’Neill 1988Taylor RJ, O’Neill MG (1988) Summer activity patterns of insectivorous bats and their prey in Tasmania. Wildlife Research 15: 533-539., Meyer et al. 2004Meyer CFJ, Schwarz CJ, Fahr J (2004) Activity patterns and habitat preferences of insectivorous bats in a West African forest-savanna mosaic. Journal of Tropical Ecology 20: 397-407. https://doi.org/10.1017/S0266467404001373
https://doi.org/10.1017/S026646740400137...
). This bimodal activity pattern probably results from a foraging extension: some species return to the roost after the first peak of foraging activity and do not leave it until the following night, but in the bimodal activity pattern, in addition to this first foraging peak, the species leave the roost again in a second activity peak before returning to it definitively (Kunz 1974Kunz TH (1974) Feeding ecology of a temperate insectivorous bat (Myotis velifer). Ecology 55: 693-711., Kunz et al. 1995Kunz TH, Whitaker JO, Wadanoli MD (1995) Dietary energetics of the insectivorous Mexican free-tailed bat (Tadarida brasiliensis) during pregnancy and lactation. Oecologia 101: 407-415.).
In the present study, Vespertilionidae and Molossidae foraged in the first hours after sunset and remained constant until midnight. Mormoopidae was recorded in the Modelo complex, with activity throughout the night, during all nights. The species recorded (P. gymnonotus) is the least captured of the genus when mist nets are used, but it is abundant in open and dry areas (Reid 1997Reid F (1997) A field guide to the mammals of Central America and Southeast Mexico. Oxford University Press, New York, 334 pp., Pavan and Tavares 2020Pavan AC, Tavares V (2020) Pteronotus gymnonotus. Mammalian Species 52(990): 40-48. https://doi.org/10.1093/mspecies/seaa003
https://doi.org/10.1093/mspecies/seaa003...
). This species aggregates preferably in colonies in caves and rock crevices, which can house more than 100,000 individuals (Otalora-Ardila et al. 2019Otalora-Ardila A, Torres JM, Barbier E, Pimentel NT, Leal ESB, Bernard E (2019) Thermally-assisted monitoring of bat abundance in an exceptional cave in Brazil’s Caatinga drylands. Acta Chiropterologica 21: 411-423. https://doi.org/10.3161/15081109ACC2019.21.2.016
https://doi.org/10.3161/15081109ACC2019....
). The activity throughout the night can be explained by the proximity of the sampling point to a roost. In fact, sampling point 7, which showed the highest richness and activity, was close to a cave found in the wind farm surroundings. The presence of this cave may have influenced the increase in activity and species richness in that sampling point. Thus, the wind farm’s proximity to a roost occupied by bats can influence bat activity in this wind farm and the existence of these conditions should be considered when researching both activity patterns and possible environmental impacts of this wind farm (Barros et al. 2017Barros MAS, Bernard E, Pereira MJR, Rui AM, Falcão FC, Luz JL (2017) Diretrizes para estudos de impacto de parques eólicos sobre morcegos no Brasil. https://www.sbeq.net/_files/ugd/053d6e_e440445d6703480ea175e9b9aa6c5167.pdf
https://www.sbeq.net/_files/ugd/053d6e_e...
).
Importance and influence of temperature
Temperature explained the bat activity observed in Curva dos Ventos and Cristal complexes. Differences in ambient temperature can influence bat activity (McCain 2007McCain CM (2007) Could temperature and water availability drive elevational species richness patterns? A global case study for bats. Global Ecology and Biogeography 16: 1-13. https://doi.org/10.1111/j.1466-8238.2006.00263.x
https://doi.org/10.1111/j.1466-8238.2006...
, Hayes 1997Hayes JP (1997) Temporal variation in activity of bats and the design of echolocation-monitoring studies. Journal of Mammalogy 78: 514-524.). Higher temperatures make the environment suitable for bat physiology, contributing to a lower metabolic cost. In addition, some insect species show strong synchrony with temperature and rainfall (Wolda 1988Wolda H (1988) Insect seasonality: why? Annual Review of Ecology, Evolution and Systematics 19: 1-18.), and others are more abundant in moderately higher temperature conditions (Arbuthnott and Brigham 2007Arbuthnott D, Brigham RM (2007) The influence of a local temperature inversion on the foraging behaviour of big brown bats, Eptesicus fuscus. Acta Chiropterologica 9: 193-201. https://doi.org/10.3161/1733-5329(2007)9[193:TIOALT]2.0.CO;2). In the Caatinga, there is a variation in temperature and humidity throughout the night, with a trend of lower temperatures in the middle of the night (Silva et al. 2018aSilva JMC, Leal IR, Tabarelli M (2018a) Caatinga: the largest tropical dry forest region in South America. Springer, Cham. 482 p.) and days drier than nights. Such variation could influence the activity of insectivorous bats in two ways: indirectly, due to a higher abundance and availability of the insects on which bat feed; or directly, due to physiological or metabolic issues inherent to the physiology of individuals and species (McCain 2007McCain CM (2007) Could temperature and water availability drive elevational species richness patterns? A global case study for bats. Global Ecology and Biogeography 16: 1-13. https://doi.org/10.1111/j.1466-8238.2006.00263.x
https://doi.org/10.1111/j.1466-8238.2006...
).
Wind farms in northeastern Brazil are mostly located in two different environment types: closer to beaches and the coast, or located further inland, usually in higher elevations (between 800 and 1,200 m.a.s.l.). Although all sites undergo variations, temperatures near the coast tend to have higher averages than those in inland areas, where there are higher variations and lower averages. Thus, regarding that the temperature influences bat activity and given the limitation of the sampling carried out here, in situations where new monitoring is necessary, we recommended covering longer periods and different times of the year.
Wind speed
Wind speed had a significant influence on bat activity in the Cristal wind-energy complex. The association of bat activity with wind speed is reported in the literature (e.g., Adam et al. 1994Adam MD, Lacki MJ, Shoemaker LG (1994) Influence of environmental conditions on flight activity of Plecotus townsendii virginianus (Chiroptera: Vespertilionidae). Brimleyana 21: 77-85., Russo and Jones 2003Russo D, Jones G (2003) Use of foraging habitats by bats in a Mediterranean area determined by acoustic surveys: conservation implications. Ecography 26: 197-209. https://doi.org/10.1034/j.1600-0587.2003.03422.x
https://doi.org/10.1034/j.1600-0587.2003...
, Amorim et al. 2012Amorim F, Rebelo H, Rodrigues L (2012) Factors influencing bat activity and mortality at a wind farm in the Mediterranean Region. Acta Chiropterologica 14: 439-57. https://doi.org/10.3161/150811012X661756
https://doi.org/10.3161/150811012X661756...
, Wellig et al. 2018Wellig SD, Nusslé S, Miltner D, Kohle O, Glaizot O, Braunisch V, et al. (2018) Mitigating the negative impacts of tall wind turbines on bats: Vertical activity profiles and relationships to wind speed. PLoS ONE 13: e0192493. https://doi.org/10.1371/journal.pone.0192493
https://doi.org/10.1371/journal.pone.019...
), and it is intuitive because bats are relatively small animals, their ability to fly can be influenced by wind force, as well as the activity of their aerial prey. Bats have several adaptations for flight in different conditions: some species are adapted for a slow flight with high maneuverability, whereas others have a fast flight with low maneuverability (Aldridge and Rautenbach 1987Aldridge HDJN, Rauntenbach IL (1987) Morphology, echolocation and resource partitioning in insectivorous bats. Journal of Animal Ecology 56: 763-778., Norberg and Rayner 1987Norberg UM, Rayner JMV (1987) Ecological morphology and flight in bats (Mammalia; Chiroptera): wing adaptations, flight performance, foraging strategy and echolocation. Philosophical Transactions of the Royal Society of London B 316: 335-427., Marinello and Bernard 2014Marinello MM, Bernard E (2014) Wing morphology of Neotropical bats: a quantitative and qualitative analysis with implications for habitat use. Canadian Journal of Zoology 92: 141-147. https://doi.org/10.1139/cjz-2013-0127
https://doi.org/10.1139/cjz-2013-0127...
). In fact, the relationship between wind speed and bat activity is what supports the implementation of curtailment, i.e., the reduction of the rotation speed of the blades during higher bat activity, one of the most effective means of reducing high bat fatalities at wind farms (Arnett et al. 2011Arnett EB, Huso MMP, Schirmacher MR, Hayes JP (2011) Altering turbine speed reduces bat mortality at wind‐energy facilities. Frontiers in Ecology and the Environment 9: 209-214. https://doi.org/10.1890/100103
https://doi.org/10.1890/100103...
, Hayes et al. 2019Hayes MA, Hooton LA, Gilland KL, Grandgent C, Smith RL, Lindsay SR, Collins JD, Schumacher SM, Rabie PA, Gruver JC, et al. (2019) A smart curtailment approach for reducing bat fatalities and curtailment time at wind energy facilities. Ecological Applications 29: e01881. https://doi.org/10.1002/eap.1881
https://doi.org/10.1002/eap.1881...
, Smallwood and Bell 2020Smallwood KS, Bell DA (2020) Effects of wind turbine curtailment on bird and bat fatalities. The Journal of Wildlife Management 84: 685-696. https://doi.org/10.1002/jwmg.21844
https://doi.org/10.1002/jwmg.21844...
).
In both Modelo and Fonte dos Ventos complexes, we identified no relationship between bat activity and the environmental variables tested. However, considering that these variables may experience fluctuations throughout the year, the need for monitoring in wind farms covering longer periods becomes more evident (Barros et al. 2017Barros MAS, Bernard E, Pereira MJR, Rui AM, Falcão FC, Luz JL (2017) Diretrizes para estudos de impacto de parques eólicos sobre morcegos no Brasil. https://www.sbeq.net/_files/ugd/053d6e_e440445d6703480ea175e9b9aa6c5167.pdf
https://www.sbeq.net/_files/ugd/053d6e_e...
). Only long-term monitoring can produce complete information, which is essential for mitigation actions to decrease mortality. In the United States and Canada, only after long-term studies, it was possible to identify that bat activity patterns were seasonal - in those cases, associated with migratory movements - and responded to specific characteristics, such as wind speed and direction (Arnett et al. 2016Arnett EB, Baerwald EF, Mathews F, Rodrigues L, Rodríguez-Durán A, Rydell J, Villegas-Patraca R, Voigt CC (2016) Impacts of wind energy development on bats: a global perspective. In: Voigt CC, Kingston T (Eds) Bats in the Anthropocene: Conservation of Bats in a Changing World. Springer International Publishing, Cham, 295-323. https://doi.org/10.1007/978-3-319-25220-9_11
https://doi.org/10.1007/978-3-319-25220-...
). With this information in hand, it was possible to test actions to reduce the rotation speed of the blades of wind turbines under environmental conditions associates to higher bat activity (Baerwald et al. 2009Baerwald EF, Edworthy J, Holder M, Barclay RMR (2009) A large‐scale mitigation experiment to reduce bat fatalities at wind energy facilities. The Journal of Wildlife Management 73: 1077-1081. https://doi.org/10.2193/2008-233
https://doi.org/10.2193/2008-233...
). These actions were very successful in some cases, even reducing bat mortality by almost 90% (Arnett et al. 2011Arnett EB, Huso MMP, Schirmacher MR, Hayes JP (2011) Altering turbine speed reduces bat mortality at wind‐energy facilities. Frontiers in Ecology and the Environment 9: 209-214. https://doi.org/10.1890/100103
https://doi.org/10.1890/100103...
). Thus, monitoring in detail the bat activity and environmental variables proved to be essential for reducing environmental impacts in wind farms (Frick et al. 2017Frick WF, Baerwald EF, Pollock JF, Barclay RMR, Szymanski JA, Weller TJ, Russell AL, Loeb SC, Medellin RA, McGuire LP (2017) Fatalities at wind turbines may threaten population viability of a migratory bat. Biological Conservation 209: 172-177. https://doi.org/10.1016/j.biocon.2017.02.023
https://doi.org/10.1016/j.biocon.2017.02...
).
Our data showed that, despite being geographically close, the environmental conditions of wind-energy complexes, their species richness and composition are not the same and each wind farm has its singularities. Some environmental variables may explain bat activity, but in site-specific context. Hence, our main recommendation is that long-term site-specific monitoring must be mandatory, avoiding generalizations for environmental licensing purposes in the wind power in Brazil. In fact, the poor quality of the environmental licensing of wind parks in the country is an issue (Valença and Bernard 2015Valença RB, Bernard E (2015) Another blown in the wind: bats and the licensing of wind farms in Brazil. Natureza & Conservação 13: 117-122. https://doi.org/10.1016/j.ncon.2015.09.001
https://doi.org/10.1016/j.ncon.2015.09.0...
, Neri et al. 2019Neri M, Jameli D, Bernard E, Melo FPL (2019) Green versus green? Adverting potential conflicts between wind power generation and biodiversity conservation in Brazil. Perspectives in Ecology and Conservation 17: 131-135. https://doi.org/10.1016/j.pecon.2019.08.004
https://doi.org/10.1016/j.pecon.2019.08....
, Barros and Bernard 2019Barros MAS, Bernard E (2019) Licenciamento ambiental de parques eólicos no Brasil: qualidade das diretrizes estaduais para avaliação de impacto sobre morcegos. In: Brazil Windpower (Ed.) Artigos Trabalhos Técnicos. GWEC/Grupo Canalenergia/ABEEólica, São Paulo, 504-523.). Guidelines for studies on wind farm impacts on bats in Brazil have been published recently (Barros et al. 2017Barros MAS, Bernard E, Pereira MJR, Rui AM, Falcão FC, Luz JL (2017) Diretrizes para estudos de impacto de parques eólicos sobre morcegos no Brasil. https://www.sbeq.net/_files/ugd/053d6e_e440445d6703480ea175e9b9aa6c5167.pdf
https://www.sbeq.net/_files/ugd/053d6e_e...
) and documents like that set standards on how to minimally sample an area for the environmental assessment in wind farms. Brazil holds one of the largest generation potentials in the world when it comes to renewable energies. The forecast is that the wind power installed in the country will reach 25.5 GW by 2024 with an estimated investment of US$ 1.2 billion per year (ABEEólica 2021ABEEólica (2021) Energia eólica chega a 18 GW de capacidade instalada no Brasil. Associação Brasileira de Energia Eólica. http://abeeolica.org.br/noticias/energia-eolica-chega-a-18-gw-de-capacidade-instalada-no-brasil
http://abeeolica.org.br/noticias/energia...
). But such production cannot occur at the expense of the country’s rich biodiversity. In order to be considered really green, the wind energy sector not just in Brazil, but elsewhere, should adopt higher environmental standards. And in this process, complete and detailed environmental assessments is a key-step. Therefore, we urge Brazilian state and federal environmental agencies to not accept superficial short-term studies based on ex-situ data and information. In this case, public policies based on bad data are the worst-case scenario for both bat conservation and green energy production in Brazil.
ACKNOWLEDGEMENTS
We thank Thais Figueiredo and Eco.Logic for field support and for providing part of the data, and Enel (in special Soraya Cavalleri) for allowing access to the environmental data. Frederico Hintze provided invaluable help with the acoustical analysis, and Aída Otalora-Ardila and Jennifer Barros with the statistical analysis. Lander Alves produced de map used. This manuscript is part of the C.G. Pereira’s M.Sc. at the Programa de Pós-Graduação em Biologia Animal/UFPE and we thank B.M. Bezerra and J.P.S. Alves for valuable comments on the thesis. This study was financed in part by the Coordenação de Aperfeiçoamento de Pessoal de Nível Superior (CAPES, Finance Code 001. E. Bernard has a fellowship grant from CNPq. Any proficiency inadequacies in the English version are the sole responsibility of the authors.
LITERATURE CITED
- ABEEólica (2021) Energia eólica chega a 18 GW de capacidade instalada no Brasil. Associação Brasileira de Energia Eólica. http://abeeolica.org.br/noticias/energia-eolica-chega-a-18-gw-de-capacidade-instalada-no-brasil
» http://abeeolica.org.br/noticias/energia-eolica-chega-a-18-gw-de-capacidade-instalada-no-brasil - Adam MD, Lacki MJ, Shoemaker LG (1994) Influence of environmental conditions on flight activity of Plecotus townsendii virginianus (Chiroptera: Vespertilionidae). Brimleyana 21: 77-85.
- Aldridge HDJN, Rauntenbach IL (1987) Morphology, echolocation and resource partitioning in insectivorous bats. Journal of Animal Ecology 56: 763-778.
- Amaral IS, Pereira MJR, Mader A, Ferraz MR, Pereira JB, Oliveira LR (2020) Wind farm bat fatalities in southern Brazil: temporal patterns and influence of environmental factors. Hystrix 31: 40-47. https://doi.org/10.4404/hystrix-00256-2019
» https://doi.org/10.4404/hystrix-00256-2019 - Amorim F, Rebelo H, Rodrigues L (2012) Factors influencing bat activity and mortality at a wind farm in the Mediterranean Region. Acta Chiropterologica 14: 439-57. https://doi.org/10.3161/150811012X661756
» https://doi.org/10.3161/150811012X661756 - Arbuthnott D, Brigham RM (2007) The influence of a local temperature inversion on the foraging behaviour of big brown bats, Eptesicus fuscus Acta Chiropterologica 9: 193-201. https://doi.org/10.3161/1733-5329(2007)9[193:TIOALT]2.0.CO;2
- Arias-Aguilar A, Hintze F, Aguiar LMS, Rufray V, Bernard E, Pereira MJR (2018) Who’s calling? Acoustic identification of Brazilian bats. Mammalian Research 63: 231-253. https://doi.org/10.1007/s13364-018-0367-z
» https://doi.org/10.1007/s13364-018-0367-z - Arnett EB, Baerwald EF, Mathews F, Rodrigues L, Rodríguez-Durán A, Rydell J, Villegas-Patraca R, Voigt CC (2016) Impacts of wind energy development on bats: a global perspective. In: Voigt CC, Kingston T (Eds) Bats in the Anthropocene: Conservation of Bats in a Changing World. Springer International Publishing, Cham, 295-323. https://doi.org/10.1007/978-3-319-25220-9_11
» https://doi.org/10.1007/978-3-319-25220-9_11 - Arnett EB, Huso MMP, Schirmacher MR, Hayes JP (2011) Altering turbine speed reduces bat mortality at wind‐energy facilities. Frontiers in Ecology and the Environment 9: 209-214. https://doi.org/10.1890/100103
» https://doi.org/10.1890/100103 - Baerwald EF, Edworthy J, Holder M, Barclay RMR (2009) A large‐scale mitigation experiment to reduce bat fatalities at wind energy facilities. The Journal of Wildlife Management 73: 1077-1081. https://doi.org/10.2193/2008-233
» https://doi.org/10.2193/2008-233 - Barclay RMR, Baerwald EF, Gruver JC (2007) Variation in bat and bird fatalities at wind energy facilities: assessing the effects of rotor size and tower height. Canadian Journal of Zoology 85: 381-387. https://doi.org/10.1139/Z07-011
» https://doi.org/10.1139/Z07-011 - Barclay RMR, Harder LM (2003) Life histories of bats: life in the slow lane. In: Kunz TH, Fenton MB (Eds) Bat ecology. University of Chicago Press, Chicago, 209-256.
- Barros MAS, Bernard E (2019) Licenciamento ambiental de parques eólicos no Brasil: qualidade das diretrizes estaduais para avaliação de impacto sobre morcegos. In: Brazil Windpower (Ed.) Artigos Trabalhos Técnicos. GWEC/Grupo Canalenergia/ABEEólica, São Paulo, 504-523.
- Barros MAS, Bernard E, Pereira MJR, Rui AM, Falcão FC, Luz JL (2017) Diretrizes para estudos de impacto de parques eólicos sobre morcegos no Brasil. https://www.sbeq.net/_files/ugd/053d6e_e440445d6703480ea175e9b9aa6c5167.pdf
» https://www.sbeq.net/_files/ugd/053d6e_e440445d6703480ea175e9b9aa6c5167.pdf - Barros MAS, Magalhães RG, Rui AM (2015) Species composition and mortality of bats at the Osório Wind Farm, southern Brazil. Studies on Neotropical Fauna and Environment 50: 31-39. https://doi.org/10.1080/01650521.2014.1001595
» https://doi.org/10.1080/01650521.2014.1001595 - Bernard E, Aguiar LMS, Brito D, Cruz-Neto AP, Gregorin R, Machado RB, Oprea M, Paglia AP, Tavares VC (2012) Uma análise de horizontes sobre a conservação de morcegos no Brasil. In: Freitas TRO, Vieira EM (Orgs) Mamíferos do Brasil: Genética, Sistemática, Ecologia e Conservação. Sociedade Brasileira de Mastozoologia, Rio de Janeiro, 19-35.
- Bernard E, Aguiar LMS, Machado RB (2011) Discovering the Brazilian bat fauna: a task for two centuries? Mammal Review 41: 23-39. https://doi.org/10.1111/j.1365-2907.2010.00164.x
» https://doi.org/10.1111/j.1365-2907.2010.00164.x - Cryan PM, Barclay RMR (2009) Causes of bat fatalities at wind turbines: hypotheses and predictions. Journal of Mammalogy 90: 1330-1340. https://doi.org/10.1644/09-MAMM-S-076R1.1
» https://doi.org/10.1644/09-MAMM-S-076R1.1 - Denzinger A, Schnitzler H-U (2013) Bat guilds, a concept to classify the highly diverse foraging and echolocation behaviors of microchiropteran bat. Frontiers in Physiology 4: 164. https://doi.org/10.3389/fphys.2013.00164
» https://doi.org/10.3389/fphys.2013.00164 - Erkert HG (1982) Ecological aspects of bat activity rhythms. In: Kunz TH (eds) Ecology of Bats. Springer, Boston, 201-242.
- Frick WF, Baerwald EF, Pollock JF, Barclay RMR, Szymanski JA, Weller TJ, Russell AL, Loeb SC, Medellin RA, McGuire LP (2017) Fatalities at wind turbines may threaten population viability of a migratory bat. Biological Conservation 209: 172-177. https://doi.org/10.1016/j.biocon.2017.02.023
» https://doi.org/10.1016/j.biocon.2017.02.023 - Grodsky SM, Behr MJ, Gendler A, Drake D, Dieterle BD, Rudd RJ, Walrath NL (2011) Investigating the causes of death for wind turbine-associated bat fatalities. Journal of Mammalogy 92: 917-925. https://doi.org/10.1644/10-MAMM-A-404.1
» https://doi.org/10.1644/10-MAMM-A-404.1 - GWEC (2021) Global Wind Report 2021. Global Wind Energy Council. https://gwec.net/global-wind-report-2021
» https://gwec.net/global-wind-report-2021 - Hayes JP (1997) Temporal variation in activity of bats and the design of echolocation-monitoring studies. Journal of Mammalogy 78: 514-524.
- Hayes MA (2013) Bats killed in large numbers at United States wind energy facilities. BioScience 63: 975-979. https://doi.org/10.1525/bio.2013.63.12.10
» https://doi.org/10.1525/bio.2013.63.12.10 - Hayes MA, Hooton LA, Gilland KL, Grandgent C, Smith RL, Lindsay SR, Collins JD, Schumacher SM, Rabie PA, Gruver JC, et al. (2019) A smart curtailment approach for reducing bat fatalities and curtailment time at wind energy facilities. Ecological Applications 29: e01881. https://doi.org/10.1002/eap.1881
» https://doi.org/10.1002/eap.1881 - Kunz TH (1973) Resource utilization: temporal and spatial components of bat activity in central Iowa. Journal of Mammalogy 54: 14-32.
- Kunz TH (1974) Feeding ecology of a temperate insectivorous bat (Myotis velifer). Ecology 55: 693-711.
- Kunz TH, Arnett EB, Erickson WP, Hoar AR, Johnson GD, Larkin RP, Strickland MD, Thresher RW, Tuttle MD (2007) Ecological impacts of wind energy development on bats: questions, research needs, and hypotheses. Frontiers in Ecology and the Environment 5: 315-324. https://doi.org/10.1890/1540-9295(2007)5[315:EIOWED]2.0.CO;2
- Kunz TH, Whitaker JO, Wadanoli MD (1995) Dietary energetics of the insectivorous Mexican free-tailed bat (Tadarida brasiliensis) during pregnancy and lactation. Oecologia 101: 407-415.
- Marinello MM, Bernard E (2014) Wing morphology of Neotropical bats: a quantitative and qualitative analysis with implications for habitat use. Canadian Journal of Zoology 92: 141-147. https://doi.org/10.1139/cjz-2013-0127
» https://doi.org/10.1139/cjz-2013-0127 - McCain CM (2007) Could temperature and water availability drive elevational species richness patterns? A global case study for bats. Global Ecology and Biogeography 16: 1-13. https://doi.org/10.1111/j.1466-8238.2006.00263.x
» https://doi.org/10.1111/j.1466-8238.2006.00263.x - Meyer CFJ, Schwarz CJ, Fahr J (2004) Activity patterns and habitat preferences of insectivorous bats in a West African forest-savanna mosaic. Journal of Tropical Ecology 20: 397-407. https://doi.org/10.1017/S0266467404001373
» https://doi.org/10.1017/S0266467404001373 - Neri M, Jameli D, Bernard E, Melo FPL (2019) Green versus green? Adverting potential conflicts between wind power generation and biodiversity conservation in Brazil. Perspectives in Ecology and Conservation 17: 131-135. https://doi.org/10.1016/j.pecon.2019.08.004
» https://doi.org/10.1016/j.pecon.2019.08.004 - Norberg UM, Rayner JMV (1987) Ecological morphology and flight in bats (Mammalia; Chiroptera): wing adaptations, flight performance, foraging strategy and echolocation. Philosophical Transactions of the Royal Society of London B 316: 335-427.
- O’Shea TJ, Cryan PM, Hayman DTS, Plowright RK, Streicker DG (2016) Multiple mortality events in bats: a global review. Mammal Review 46: 175-190. https://doi.org/10.1111/mam.12064
» https://doi.org/10.1111/mam.12064 - Otalora-Ardila A, Torres JM, Barbier E, Pimentel NT, Leal ESB, Bernard E (2019) Thermally-assisted monitoring of bat abundance in an exceptional cave in Brazil’s Caatinga drylands. Acta Chiropterologica 21: 411-423. https://doi.org/10.3161/15081109ACC2019.21.2.016
» https://doi.org/10.3161/15081109ACC2019.21.2.016 - Pavan AC, Tavares V (2020) Pteronotus gymnonotus Mammalian Species 52(990): 40-48. https://doi.org/10.1093/mspecies/seaa003
» https://doi.org/10.1093/mspecies/seaa003 - R Development Core Team (2009) R: A Language and Environment for Statistical Computing. R Foundation for Statistical Computing, Vienna. http://www.R-project.org
» http://www.R-project.org - Reid F (1997) A field guide to the mammals of Central America and Southeast Mexico. Oxford University Press, New York, 334 pp.
- Russo D, Jones G (2003) Use of foraging habitats by bats in a Mediterranean area determined by acoustic surveys: conservation implications. Ecography 26: 197-209. https://doi.org/10.1034/j.1600-0587.2003.03422.x
» https://doi.org/10.1034/j.1600-0587.2003.03422.x - Rydell J, Bach L, Dubourg-Savage MJ, Green M, Rodrigues L, Hedenström A (2010) Bat mortality at wind turbines in northwestern Europe. Acta Chiropterologica 12: 261-274. https://doi.org/10.3161/150811010X537846
» https://doi.org/10.3161/150811010X537846 - Saidur R, Rahim NA, Islam MR, Solangi KH (2011) Environmental impact of wind energy. Renew Sustainable Energy Review 15: 2423-2430. https://doi.org/10.1016/j.rser.2011.02.024
» https://doi.org/10.1016/j.rser.2011.02.024 - Silva JMC, Leal IR, Tabarelli M (2018a) Caatinga: the largest tropical dry forest region in South America. Springer, Cham. 482 p.
- Silva UBT, Delgado-Jaramillo M, Aguiar LMS, Bernard E (2018b) Species richness, geographic distribution, pressures, and threats to bats in the Caatinga drylands of Brazil. Biological Conservation 221: 312-322. https://doi.org/10.1016/j.biocon.2018.03.028
» https://doi.org/10.1016/j.biocon.2018.03.028 - Smallwood KS, Bell DA (2020) Effects of wind turbine curtailment on bird and bat fatalities. The Journal of Wildlife Management 84: 685-696. https://doi.org/10.1002/jwmg.21844
» https://doi.org/10.1002/jwmg.21844 - Taylor RJ, O’Neill MG (1988) Summer activity patterns of insectivorous bats and their prey in Tasmania. Wildlife Research 15: 533-539.
- Valença RB, Bernard E (2015) Another blown in the wind: bats and the licensing of wind farms in Brazil. Natureza & Conservação 13: 117-122. https://doi.org/10.1016/j.ncon.2015.09.001
» https://doi.org/10.1016/j.ncon.2015.09.001 - Wellig SD, Nusslé S, Miltner D, Kohle O, Glaizot O, Braunisch V, et al. (2018) Mitigating the negative impacts of tall wind turbines on bats: Vertical activity profiles and relationships to wind speed. PLoS ONE 13: e0192493. https://doi.org/10.1371/journal.pone.0192493
» https://doi.org/10.1371/journal.pone.0192493 - Wolda H (1988) Insect seasonality: why? Annual Review of Ecology, Evolution and Systematics 19: 1-18.
- Zuur AF, Hilbe JM, Ieno EN (2013) A Beginner’s Guide to GLM and GLMM with R: a frequentist and Bayesian perspective for ecologists. Highland Statistics Newburgh, United Kingdom, 256 p.
ADDITIONAL NOTES
-
Zoobank register
http://zoobank.org/06E9DAE7-2E1B-462C-A497-1F96B1162481 -
How to cite this article
Pereira CG, Falcão F, Bernard E (2022) One size doesn’t fit all: Singularities in bat species richness and activity patterns in wind-energy complexes in Brazil and implications for environmental assessment. Zoologia (Curitiba) 39: e21041. https://doi.org/10.1590/S1984-4689.v39.e21041 -
Published by
Sociedade Brasileira de Zoologia at Scientific Electronic Library Online (https://www.scielo.br/zool)
Supplementary material 1
Authors: Carolina G. Pereira, Fábio Falcão, Enrico Bernard
Data type: species data.
Copyright notice: This dataset is made available under the Open Database License (http://opendatacommons.org/licenses/odbl/1.0). The Open Database License (ODbL) is a license agreement intended to allow users to freely share, modify, and use this Dataset while maintaining this same freedom for others, provided that the original source and author(s) are credited.
Supplementary material 2
Authors: Carolina G. Pereira, Fábio Falcão, Enrico Bernard
Data type: species data.
Copyright notice: This dataset is made available under the Open Database License (http://opendatacommons.org/licenses/odbl/1.0). The Open Database License (ODbL) is a license agreement intended to allow users to freely share, modify, and use this Dataset while maintaining this same freedom for others, provided that the original source and author(s) are credited.
Supplementary material 3
Authors: Carolina G. Pereira, Fábio Falcão, Enrico Bernard
Data type: climate data.
Copyright notice: This dataset is made available under the Open Database License (http://opendatacommons.org/licenses/odbl/1.0). The Open Database License (ODbL) is a license agreement intended to allow users to freely share, modify, and use this Dataset while maintaining this same freedom for others, provided that the original source and author(s) are credited.
Supplementary material 4
Authors: Carolina G. Pereira, Fábio Falcão, Enrico Bernard
Data type: climate data.
Copyright notice: This dataset is made available under the Open Database License (http://opendatacommons.org/licenses/odbl/1.0/). The Open Database License (ODbL) is a license agreement intended to allow users to freely share, modify, and use this Dataset while maintaining this same freedom for others, provided that the original source and author(s) are credited.
Link: https://doi.org/10.1590/S1984-4689.v39.e21041
Edited by
Editorial responsibility
Publication Dates
-
Publication in this collection
11 Apr 2022 -
Date of issue
2022
History
-
Received
01 Dec 2021 -
Accepted
26 Jan 2022