Silver-dichloroquinoline Complexes: Synthesis, Structure and Antitubercular Properties
Abstract
Synthesis, characterization, and antitubercular activity of three silver(I) complexes with 4,7-dichloroquinoline (C9H5Cl2N, DCQ), 2,2’-bipyridine (C10H8N2, Bpy) and triphenylphosphine (C18H15P, PPh3) are presented. Complex 1 was formulated as [Ag(H2O)(DCQ)2(μ-ONO2)Ag(NO3)(DCQ)2], 1:2 M:L1 molar ratio, L1 = DCQ. Complexes 2 [Ag(NO3)(DCQ)(Bpy)] and 3 [Ag(NO3)(DCQ)(PPh3)]2 exhibit 1:1:1 M:L1:L2 molar ratio, where L2 = Bpy or PPh3. All compounds were analytically, spectroscopically, and structurally characterized. The crystal and molecular structures of complexes 1 and 3 were determined by conventional single-crystal X-ray diffraction, while the crystal structure of 2 was elucidated using laboratory powder diffraction method. Elemental analyses, conductometry, infrared (IR), Raman, UV-Vis, and 1H, 13C{1H}, 31P{1H}, {1H-15N} heteronuclear multiple bond correlation (HMBC) nuclear magnetic resonance (NMR) spectroscopies, along with 1H NMR T1 relaxation time measurements, corroborate the proposed formulas. Complex 3, in the solid state, was found to contain significant residual solvents (CH3OH and CH3CN). Consequently, its desolvation process was investigated using IR microscopy and X-ray powder diffraction. In vitro biological assays against Mycobacterium tuberculosis H37Rv (ATCC 27294) were performed for all compounds. Complexes 1 and 3 shown the lowest concentration of the antibiotic at which 90% of the isolates are inhibited (MIC90) of 7 ± 1 and 14 ± 3 µg mL-1, suggesting their potential as antimycobacterial agents, in contrast, assays indicate lower activity for compound 2 against the evaluated strains.
Keywords:
4,7-dichloroquinoline; homo/heteroleptic complexes; silver complexes; Mycobacterium tuberculosis
Introduction
Koch’s bacillus or Mycobacterium tuberculosis (MTB) is the pathogen responsible for tuberculosis (TB) disease, which is highly contagious in its active stage and commonly occurs in the pulmonary form, spreading through sputum and sneeze. Indeed, people with immunosuppressive diseases such as AIDS (Acquired Immune Deficiency Syndrome) are more susceptible to developing TB, and they are also recurrently affected by the extrapulmonary form of TB, which also disturbs essential organs such as bones, kidneys, skin and lymph nodes. TB usually manifests itself, in its active form, by chronic cough with hemoptysis, night sweats, weight loss and fever.1 In 2023, an estimated 10.8 million new cases of tuberculosis were reported, reflecting an upward trend that has persisted in recent years.2 In 2022, approximately 10.6 million people contracted TB globally, surpassing the 10.3 million cases reported in 2021 and the 10 million in 2020. This increase is primarily attributed to disruptions in healthcare services caused by the coronavirus (COVID-19) pandemic, which limited access to medical care. Despite this rise in incidence, TB-related deaths showed a progressive decline, with 1.25 million deaths in 2023 compared to 1.32 million in 2022 and 1.42 million in 2021.2 The low awareness of a large number of patients with TB intensifies the development of resistant strains of M. tuberculosis (MTB-MR).3 Also, some patients do not use prescribed drugs in the correct posology and/or do not respect the minimum six-month period therapy. Premature abandonment of TB treatment leads to multidrug-resistant strains to first-line drugs, like pyrazinamide, isoniazid, ethambutol and rifampicin.4,5 It is therefore important to find compounds capable of fighting both MTB and MTB-MR strains and which have a shorter treatment time, since the long therapeutic period causes withdrawal by patients, generating strains that are even more resistant to usual pharmacotherapy.
Quinoline is a heterocyclic aromatic compound, with high synthetic versatility, attributed to susceptibility to electrophilic aromatic attacks in the all-carbon ring and to sites available for nucleophilic aromatic substitutions in pyridine ring, when favorable leaving groups, such as halides, are present. The quinoline core and the molecular structure of 4,7-dichloroquinoline (DCQ), are illustrated in Figure 1. Worthy of note, the dichloro-substituted quinoline moiety is present in nature as structural core of several alkaloids in medicinal plants of the genus Cinchona, such as quinine, with relevant fungicidal, and bactericidal properties.6,7

The numbering of the DCQ molecule used for spectroscopic assignments and structural labels in the present article.
The bactericidal action of quinolinic derivatives has great potential against MTB. A previous work8 have shown promising results against strains of the MTB type H37Rv, showing minimum inhibitory concentrations (MICs) equivalent to, or lower than, those of globally spread reference drugs. The effectiveness of inorganic compounds in medicinal interventions has been investigated and robustly proven since the last century, when researchers reported the use of transition metal coordination compounds in fighting bacteria.9-11 As a well-known example, silver sulfadiazine, Ag(C10H9N4O2S), is a popular drug used in limiting and preventing bacterial infections in dermatological lesions; also, a silver(I) complex with isoniazid (an antibiotic used to treat MTB infections) showed promising results against TB, with lower MIC90 value (the lowest concentration of the antibiotic at which 90% of the isolates are inhibited) than the commonly marketed antitubercular drugs ethambutol and p-aminosalicylic acid.12
Biologically active coordination compounds can be prepared by combining metallic ions and ligands, which have, each, known biological activities. In addition, lipophilic/hydrophilic properties of the ligands can be modulated to suitably interact with extra/intracellular environments. In this regard, phosphines have been described to present bactericidal, anti-inflammatory and antitumoral effects; additionally, the chemical environment and the biological activity of their metal complexes can be easily tuned by changing the substituents linked to the phosphorus atom.13 Similarly, N-heterocyclic ligands, such a 2,2’-bipyridine (Bpy), C10H8N2, have relevance in coordination chemistry; Bpy, indeed, can easily form 5-membered chelate rings, capable of modulating the lability of metal ions, and making its coordination compounds valid alternatives against infectious diseases, also thanks to their interactions with biological macromolecules, such as deoxyribonucleic acid (DNA).14
In the present work, we describe the synthesis and the characterization of three novel monoand di-nuclear complexes of silver(I) ions containing the DCQ ligand. Spectroscopic, analytical and crystallographic methods were employed to study the three isolated silver species. Finally, biological assays were performed to assess their cytotoxicity and resistance against strains of M. tuberculosis.
Experimental
Synthesis
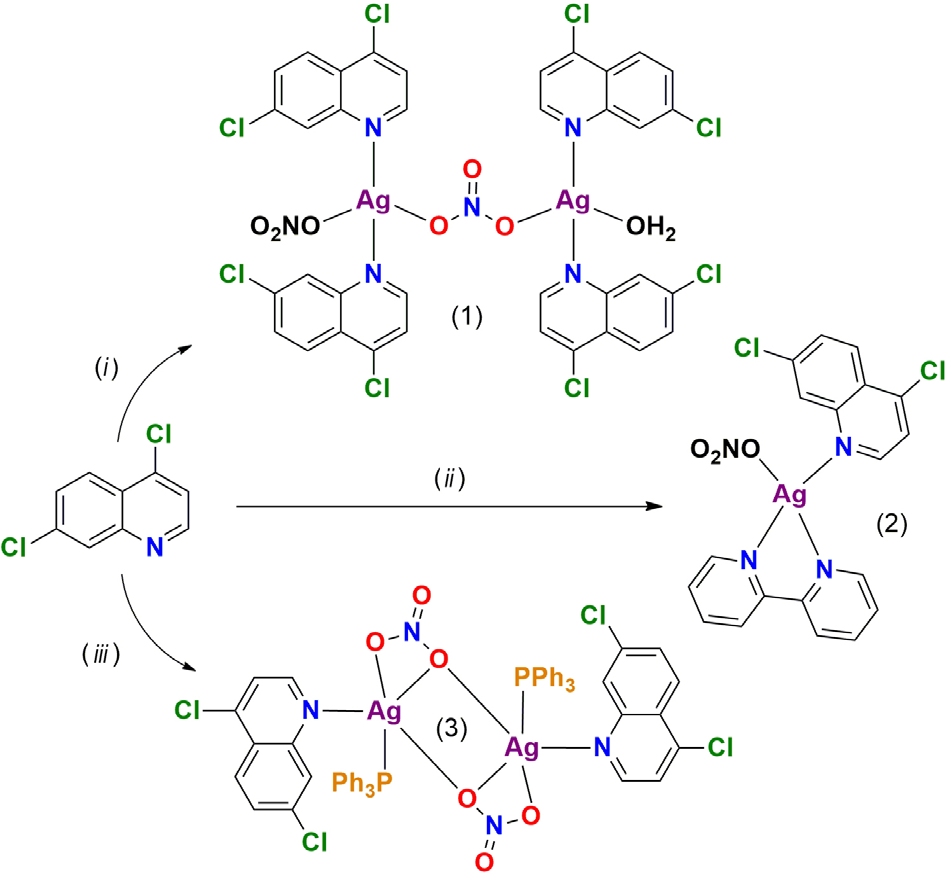
All chemicals and solvents were acquired commercially and used without further purification. All reactions were carried out under an ambient atmosphere. The general procedure for the syntheses of the three silver complexes is illustrated in Scheme 1.

Syntheses of silver(I) complexes. (i) AgNO3, stirring, 10 min; (ii) AgNO3, stirring, 10 min, Bpy, stirring, 10 min; (iii) AgNO3, stirring, 10 min, PPh3, stirring, 10 min. CH3CN:CH3OH (1:1) mixture is used in all routes as solvent. All synthesis routes were carried out in ambient conditions.
[Ag(H2O)(DCQ)2(µ-ONO2)Ag(NO3)(DCQ)2] (1)
A solution of AgNO3 (1.00 × 10⁻³ mol, 0.170 g), dissolved in 10 mL of CH3CN:CH3OH 1:1, was added dropwise to a solution containing 2.00 × 10⁻³ mol L-1 (0.396 g) of DCQ (10 mL of CH3CN:CH3OH 1:1). The resulting solution was kept under stirring for 10 min at room temperature (RT) protected from light and then, after three days, colorless crystals were formed and filtered off, washed with methanol and acetonitrile, and dried in air. The crystals obtained were ground for spectroscopic, conductivity and elemental analyses. Yield: 82% (0.943 g); mp 193 ± 1 °C; molar conductivity (1.0 × 10⁻³ mol L-1, DMSO) 31.92 ± 0.08 µS cm2 mol-1; FTIR (ATR) ν / cm-1 1562 ν(CC + CN), 1318 νasym(NO3-), 1085 (νCCl. + dCH)in plane; FT-Raman ν / cm-1 1567 ν(CC + CN), 1077 (νCCl. + dCH)in plane, 1041 νsym(NO3-); 1H NMR (500 MHz, DMSO-d6) d 7.79 (dd, 1H, J 2.2, 9.0, H(6)), 7.84 (d, 1H, J 4.9, H(2)), 8.20 (d, 1H, J 8.9, H(5)), 8.24 (d, 1H, J 2.1, H(8)), 8.88 (d, 1H, J 4.9, H(1)); 13C{1H} NMR (125 MHz, DMSO-d6) d 122.34 C(6), 124.53 C(7), 124.60 C(2), 125.97 C(3), 128.19 C(9), 129.00 C(1), 134.46 C(4), 151.73 C(5), 153.76 C(8); {1H-15N} HMBC NMR (DMSO-d6) d 294.13 N(2); UV-Vis (DMSO) λ / nm (ε, M-1 cm-1) 309 (π-π*) (27444), 323 (π-π*) (28392); anal. calcd. for C36H22Ag2N6O7Cl8: C 37.60, H 1.93, N 7.31, found: C 37.64, H 1.94, N 7.27.
[Ag(NO3)(DCQ)(Bpy)] (2)
A solution of AgNO3 (1.00 × 10⁻³ mol, 0.170 g), dissolved in 10 mL of CH3CN:CH3OH 1:1, was added dropwise to DCQ solution (1.0 × 10⁻³ mol, 0.198 g), dissolved in 10 mL of CH3CN:CH3OH 1:1. The final solution was kept under stirring for 10 min at RT protected from light. Then, Bpy dissolved in 5 mL of acetonitrile (1.00 mmol, 0.156 g) was added dropwise and stirred for additional 10 min at RT. Polycrystalline colorless material was obtained after one week. The precipitate was filtered off, washed with methanol and acetonitrile, and dried in air. The polycrystalline material obtained was studied by spectroscopic, conductivity and elemental analyses. Yield 61% (0.320 g); mp 153 ± 1 °C; molar conductivity (1.0 × 10⁻³ mol L-1, DMSO) 32.8 ± 0.4 µS cm2 mol-1; FTIR (ATR) ν / cm-1 1590 ν(CC + CN), 1576 ν(CC + CN), 1322 νasym(NO3-), 1078 (νCCl. + δCH)in plane; FT-Raman ν / cm-1 1594 ν(CC + CN), 1579 ν(CC + CN), 1064 (νCCl. + δCH)in plane, 1039 νsym(NO3-); 1H NMR (500 MHz, DMSO-d6) d 7.64 (m, 2H, H(12)), 7.80 (m, 2H, H(2);H(6)), 8.12 (td, 2H, J 1.7, 7.8, H(13)), 8.19 (d, 1H, J 2.1, H(8)), 8.23 (d, 1H, J 9.0, H(5)), 8.46 (d, 2H, J 8.1, H(11)), 8.74 (d, 2H, J 1.5, 4.7, H(14)), 8.89 (d, 1H, J 4.7, H(1)); 13C{1H} NMR (125 MHz, DMSO-d6) d 122.62 C(2), 122.79 C(14), 124.87 C(4), 125.81 C(12), 126.40 C(5), 128.64 C(8), 129.30 C(6), 135.99 C(7), 139.29 C(13), 142.09 C(3), 149.19 C(9), 150.93 C(11), 152.63 C(1), 152.83 C(10); {1H-15N} HMBC NMR (DMSO-d6) d 286.13 N(2), N(3); UV-Vis (DMSO) λ / nm (d, M-1 cm-1) 307 (π-π*) (34195), 323 (π π*) (28466); anal. calcd. for C19H13AgN4O3Cl2: C 43.53, H 2.50, N 10.69, found: C 43.60, H 2.48, N 10.63.
[Ag(NO3)(DCQ)(PPh3)]2 (3)
It was obtained in similar way to compound 2. However, a solution of PPh3 (0.262 g, 1.00 × 10⁻³ mol) was used instead of solution of Bpy. The crystals obtained were ground before spectroscopic, conductivity and elemental analyses. Yield 45% (0.633 g); mp 187 ± 1 °C; molar conductivity (1.0 × 10⁻³ mol L-1, DMSO) 22.6 ± 0.3 µS cm2 mol-1; FTIR (ATR) ν / cm-1 1562 ν(CC + CN), 1488 ν(PPh3), 1279 νasym(NO3-), 1075 (νCCl + δCH)in plane; FT Raman ν / cm-1 1565 ν(CC + CN), 1095 ν(PPh3), 1031 νsym(NO3-), 1076 (νCCl + dCH)in plane; 1H NMR (500 MHz, DMSO-d6) d 7.46 7.52 (m, 15H, PPh3), 7.72 (dd, 1H, J 2.6, 9.1, H(6)), 7.77 (d, 1H, J 4.9, H(2)), 8.13 (m, 2H, H(5);H(8)), 8.86 (d, 1H, J 4.8, H(1)); 13C{1H} NMR (125 MHz, DMSO-d6) d 122.08 C(2), 124.32 C(4), 125.86 C(5), 128.13 C(8), 128.76 C(6), 129.28 (d, J 10.0, C(12)/C(14)), 130.97 C(13), 131.20 (d, J 32.0, C(10)), 133.42 (d, J 16.9, C(11)/C(15)), 135.42 C(7), 141.41 C(3), 148.75 C(9), 152.00 C(1); {1H-15N} HMBC NMR (DMSO-d6) d 303.22 N(2); 31P{1H} NMR (202 MHz, DMSO-d6) d 11.19 P (d, J 404.5, (31P/107 109Ag)); UV-Vis (DMSO) λ / nm (ε, M-1 cm-1) 309 (π-π*) (19516), 323 (π-π*) (17491), 337 (MLTC) (4038); anal. calcd. for C54H40Ag2P2N4O6Cl4: C 51.46, H 3.20, N 4.45, found: C 51.89, H 3.20, N 4.80.
Physical measurements
Carbon, hydrogen and nitrogen (CHN) elemental analyses were performed on PerkinElmer Series II 2400 CHNS/O system. Attenuated total reflectance Fourier-transform infrared spectra, ATR-FTIR, were recorded on Bruker FT-IR Platinum ATR spectrophotometer, in the 4000-400 cm-1 range, resolution of 4 cm-1 and 1024 scans, at 293 ± 1 K, for all compounds. The ATR FTIR microscopy was performed in Hyperion 3000 module connected to Bruker Vertex70. The spectra were acquired with 16× infrared-prepared objective in reflection mode and nitrogen-cooled MCT detector. The spectral resolution was 4 cm-1 (4000-600 cm-1 range), 256 scans, and at 293 ± 1 K. The lateral resolution of the equipment was ca. 20 µm. Fourier-transform Raman spectra, FT Raman, were recorded on Bruker RFS 100 FT-Raman spectrophotometer, λ0 = 1064 nm (Nd:YAG), in the 4000 50 cm-1 range, resolution of 4 cm-1, using 10 mW laser power, 1024 scans and at 293 ± 1 K, for all compounds. UV-Vis experiments were carried out on Ocean Optics fiber USB 2000 spectrophotometer, DH-2000-BAL, operating with deuterium halogen laser at 254 and 700 nm wavelength, within the 200-1100 nm range, at 293 ± 1 K, using quartz cuvette (1 cm, 2 mL), integration time 1 ms, to measure the maximum absorption wavelength with an absorbance below 1, for all compounds. 1H, 13C{1H}, 31P{1H}, {1H-15N} heteronuclear multiple bond correlation nuclear magnetic resonance (HMBC NMR) and 1H NMR T1 relaxation times were measured on Bruker Avance III HD 500 MHz spectrometer, in deuterated dimethyl sulfoxide (DMSO-d6), at 297 K. The NMR spectra were obtained using 20 mg for all compounds. The chemical shifts, d, were reported in parts per million (ppm) and are referenced to either the residual solvent peak (DMSO). Coupling constants (J) were measured in hertz (Hz). Peaks are denoted as d (doublet), dd (doublet of doublets), t (triplet), td (triplet of doublets) and m (multiplet). Melting points were determined with MQAPF/Microquímica apparatus. Molar conductivities (ΛM) were obtained using MS Tecnopon-mCA 150, platinum sensor (K = 1 cm-1), conductivity standard KCl (146.9 µS cm-1 ± 0.5% at 298 ± 0.2 K). The molar conductivities of complexes 1-3 were obtained in 25 mL DMSO solutions, 1.0 × 10⁻³ mol L-1, and evaluated at specific intervals during a 24 h period, at room temperature, 298 ± 2 K.
Single crystal X-ray diffraction studies of complex (1)
Single crystal X-ray diffraction measurements were performed on an Agilent SuperNova diffractometer. Measurements were performed using a Cu Kα1 source (λ = 1.54184 Å). X-ray diffraction data integration and scaling of reflection intensities was performed in the CrysAlis PRO 1.171.41.93a (Rigaku Oxford Diffraction, Rigaku OD 2020). Structure of complex 1 was solved using SHELXT 2018/2,15 with the intrinsic phasing method and the least squares refinements were performed with SHELXL 2018/3.16 The orientation of the two O-H bonds of the coordinated water molecule has been determined by employing the common HFIX 33 command and setting the site occupancy factor of one of the three H atoms to zero. Figure 2 was drawn using software OLEX2 1.3.17 Tables and illustrations, drawn using the Pov-Ray tool of the software Mercury 2022.3.0,18 are present in Supplementary Information section.

Crystal structures of silver complexes, 1-3 (a-c, respectively) with donor atoms and silver(I) ions labels. Thermal ellipsoids, for (a) and (c), are drawn at the 50% probability level; hydrogen atoms are represented as spheres with arbitrary radius. Color codes: Ag, indigo; C, grey; H, white; O, red; N, blue; and Cl, green.
Structural powder diffraction characterization of complex (2)
The crystals of (2) were found to be of rather poor quality, and unsuitable for complete data collection on single crystal diffractometer. However, approximate (triclinic) cell parameters were determined and employed in the following steps. The X-ray diffraction pattern of polycrystalline sample was therefore collected on Bruker AXS D8 Da Vinci diffractometer and the molecular model of (2) was determined by structural powder diffraction methods,19 developed by some of us, through the years, for coordination and organometallic complexes.20,21 Crystals of 2 were gently ground in agate mortar providing polycrystalline powder which was deposited in the hollow of thin glass sample-holder plate, which has very low background and no Bragg peaks. Diffraction data were collected by overnight scans in the 5-105° 2θ range, with 0.02° steps. The D8 diffractometer is equipped with Ni-filtered Cu Kα radiation and linear position-sensitive Lynxeye detector. Optics used: primary beam Soller slit (2.94°), fixed divergence (0.3°) and receiving (8.09 mm) slit. The generator was set at 40 kV and 40 mA. In the present case, the cell parameters were refined using 6-50° 2θ range,22 by the structureless Pawley method.23 Density consideration indicated Z = 2 and, accordingly, the centrosymmetric space group P1- was chosen. Then, the structure solution process was performed by the simulated annealing method,24 implemented in TOPAS.25 In this case, unique silver(I) ion was left to freely float in the unit cell. Bpy,26 DCQ,27 and nitrate ion rigid body models, were built using the Z-matrix formalism, and added with six degrees of freedom each (translation and rotation) and a torsional parameter (t1) between pyridine rings in Bpy, expected to be close to 0° for a chelating conformation. In the last refinement cycles, carried out by the Rietveld method,28 58 parameters were refined, including 10 parameters for the background trace modeled by a Chebyshev polynomial. The rigid body descriptions introduced at the solution stage were maintained in the final refinement. An isotropic thermal parameter was assigned to all atoms. The final Rietveld refinement plot is provided in Supplementary Information section.
Single crystal X-ray diffraction studies for complex (3)
Single crystal X-ray diffraction measurements of (3) were performed on Bruker Apex-II diffractometer equipped with charge-coupled device (CCD) detector. Measurements were performed using the source of radiation Cu Kα1, λ = 1.54184 Å. X-ray diffraction data integration and scaling of reflection intensities were performed in the CrysAlis PRO 1.171.41.93a (Rigaku OD, 2020). The structure of complex 3 was solved using SHELXT 2018/2,15 with the intrinsic phasing method and the refinements were performed with SHELXL 2018/3,16 with the least square method. A solvent mask was computed to assign residual electron density without determining specific atomic positions and assigned to disordered methanol and acetonitrile molecules. Illustrations and further crystallographic tables are present in Supplementary Information section. The illustrations were drawn using the Pov-Ray tool of the software Mercury 2022.3.0.18
Antibacterial assays
The standard drug rifampicin was used as experimental control. Complexes 1-3 and DCQ were solubilized in dimethylsulfoxide (DMSO). In a concise overview, MTB H37Rv (ATCC 27294) was formulated as density suspension of 105 CFU mL-1 (CFU: colony forming unit), and then 100 μL were dispensed into each well of 96-well plate, except for those reserved for compound and medium controls. Designated compounds were added at the volume of 100 μL, subsequently undergoing serial dilutions. Plates were incubated for seven days at 37 °C in 5% CO2 atmosphere and then, 30 μL of 0.01% resazurin, previously solubilized in pristine distilled water, was added to each well. The fluorescence intensity of wells was assessed with Synergy H1 device from Biotek® after 24 h. MIC90 values were recognized as the concentration that achieves 90% reduction in bacterial growth. The results presented were the average of three independent assays conducted under identical conditions.29
In vitro cytotoxic activity assays
Cytotoxic activity assays, half-maximal inhibitory concentration (IC50), were conducted following the methodology of Pavan et al.30 Briefly, MRC-5 cells (diploid cell line of fibroblast) were cultured in Dulbecco’s Modified Eagle’s Medium, DMEM (Vitrocell®), supplemented with 10% fetal bovine serum and fortified with 50 mg L-1 of gentamicin sulfate and 2 mg L-1 of amphotericin B. To ensure optimal growth and cellular propagation, MRC 5 cells were housed in culture flasks and maintained in controlled environment at 37 °C with 5% CO2 until complete confluence was attained. Subsequently, a concentration of 2.5 × 10⁵ cells mL-1 of MRC-5 was prepared and allocated across 96-well plates, ensuring consistent volume of 100 μL per well. After 24 h under the aforementioned conditions, proper cell adhesion was confirmed. Thereafter, compounds with concentrations ranging from 0.39 to 100 mg L-1, were introduced. In sequence, incubation stages were executed over intervals of 24, 48, and 72 h in 5% CO2 atmosphere, using media devoid of antimicrobial and antifungal agents. Upon completion of the incubation process, each well was supplemented with 50 μL of 0.01% resazurin solution. After 3 h, fluorescence quantification was undertaken using the Synergy H1 instrument from Biotek®. Following our biological protocol, the outcomes were the average of the three independent tests evaluated under identical conditions.
Results and Discussion
IR and Raman spectroscopy
Table 1 shows the main absorptions and the respective assignments, observed in ATR-FTIR and FT-Raman spectra of complexes (1-3) and of free ligands. The entire set of ATR-FTIR and FT-Raman spectra is included in Supplementary Information section. The band assigned to ν(CC + CN)DCQ appears at 1552 cm-1 in the ATR-FTIR spectrum of free DCQ and it is shifted to 1562 cm-1 in the complexes 1 and 3 and to 1559 cm-1 for (2), suggesting the coordination of DCQ by the nitrogen atom of the quinoline moiety to silver(I) ions. In similar way, in the FT-Raman spectra, the ν(CC + CN)DCQ band shifted from 1558 cm-1 of the free DCQ molecule to 1565 ± 2 cm-1 in the complexes (1-3). Strong ATR-FTIR bands in the 1322-1279 cm-1 range, assigned to νasym NO3-, confirm the presence of the NO3- ion in complexes 1-3. In the Raman spectra, the νsymNO3- bands are observed in 1041-1031 cm-1 range, for all three silver complexes. The band assigned to ν(AgN), falling at 352 cm-1, was observed in the FT-Raman spectra for complex 2 only. At variance, for complexes 1 and 3, ν(AgN) and ν(AgP) bands could not be observed in the Raman spectra due to their overlap with other absorptions assigned to the organic moiety. For complex 2, the ν(CC + CN)Bpy band falls very close to ν(CC + CN)DCQ, and was recognized to shift from the free Bpy values, 1576 cm-1 (ATR-FTIR) and 1573 cm-1 (FT-Raman) to 1590 and 1595 cm-1, for ATR-FTIR and FT-Raman, respectively. For complex 3, the ν(PPh3) stretching band of the free PPh3 found at 1473 cm-1 (ATR-FTIR) and at 1471 cm-1 (FT-Raman) shifted to 1488 and 1494 cm-1, respectively, suggesting that PPh3 coordination to silver(I).31
The main bands observed in the ATR-FTIR and FT-Raman spectra and its assignments for DCQ, Bpy, PPh3 and complexes 1-3
1H, 13C{1H}, {1H-15N} HMBC and 31P{1H} NMR analyses
The 1H, 13C{1H}, {1H-15N} HMBC and 31P{1H} NMR spectra of complexes (1-3) and of the free ligands were comparatively analyzed. The raw spectra and additional information are available in Supplementary Information section. For the DCQ moiety, only minor changes of the signals were observed when 1H or 13C{1H} NMR spectra of complexes (1-3) were compared to that of the free ligand.31 While such similarity might suggests that the DCQ ligands become detached, the conductivity measurements (later discussed) indicate that all complexes are substantially non-electrolytes. Considering the much lower basicity of nitrate counter ions (than DCQ, with pKa = 2.80), such observation suggests that the starting species are preserved in solution and that DCQ, despite the similarity (but not identity!) of the NMR resonances with the free molecule, is still bound to Ag(I) center. As described in Table 2, supporting this interpretation, the values of the 1H NMR T1 relaxation times for most protons of the free DCQ are considerably larger than those of the corresponding for complexes (1-3), as expected for a larger molecular volume of complexes (1 3) than for DCQ. The magnitude of T1 for the observed nucleus is directly affected by its surroundings, being it very sensitive to electronic and structural changes, especially after by organic moiety is coordinated to the metallic center.32 At variance, NMR signals related to 1H and 13C atoms of the secondary ligands change in a more significant manner upon coordination of PPh3 or Bpy to silver(I) ions (see Supplementary Information section). As expected, for complexes (1-3), {1H-15N} HMBC correlation maps point out the N-coordination of DCQ to silver(I) ion, as witnessed by 15N chemical shifts for the quinolinic nitrogen signal, in line with those reported in the literature for metal/nitrogen coordination. For complex 2, a second correlation spot was found in the {1H-15N} HMBC map and, on the basis of literature assignments, was assigned to the nitrogen atoms of the Bpy ligand.33 The 31P{1H} NMR experiments showed singlet at -6.76 ppm for free PPh3. As expected for the complex 3 where P is bound to silver, a signal at 11.19 ppm was characterized as wide doublet 1J (31P/107-109Ag), due to individual contributions of 109Ag and 107Ag nuclei.34 The coupling 1J (31P/107-109Ag) of 404.5 Hz indicates PPh3 ligand coordinated to silver(I) tetracoordinated center in dinuclear species such as [Ag(NO3)(PPh3)(DCQ)]2, indicating the non-dissociation of the nitrate ion to the silver(I) center in DMSO-d6 solution.35 Measurements of 1H, 31P{1H} NMR spectra and {1H-15N} HMBC of complexes (1-3), carried out in DMSO over time, indicate that the complexes are stable in DMSO for 72 h. No significant changes were observed for atoms close to the coordination center, as reported in the Supplementary Information section. Table 3 shows the main values observed and the respective assignments in 31P{1H} NMR spectra and {1H-15N} HMBC of complexes (1-3) and their free ligands.
{1H-15N} HMBC and 31P{1H} NMR chemical shifts for DCQ, Bpy, PPh3 and complexes (1-3), DMSO-d6
UV-Vis spectroscopy
UV-Vis spectra of complexes (1-3) show significant increase in molar absorptivity as well hyperchromic behavior of the DCQ bands due to the coordination to metal ion. Complex 3, for example, shows band centered at 337 nm with molar absorptivity 4038 M-1 cm-1 typical for Metal-Ligand Charge Transfer (MLCT) corroborating the coordination of PPh3 to the metal center.36 All UV-Vis spectra and spectrophotometric titrations are provided in the Supplementary Information section.
Conductimetric measurements
Molar conductivity measurements of complexes (1-3), performed in DMSO over time, indicate non-electrolytes species, even though the nitrate being labile in solvents as DMSO. The complexes remain stable in DMSO for more than 24 h, without significant changes.37,38 The conductivity values of complexes 1, 2 and 3 were 31.92 ± 0.08, 32.8 ± 0.4 and 22.6 ± 0.3 µS cm2 mol-1, respectively. Different solvents with different dielectric constants were used for studying the conductivity of 3 to support the fact that the dissociation of 3 heavily depends on the solvent nature,38 and that, in poorly coordinating and low dielectric constant solvents, complex 3 has the nitrate ion coordinated to the metal center. As later shown, 3 can be envisaged as a dimer in the solid state, and, in agreement with its low conductivity, the dimeric arrangement in non-polar solvents as well has been settled. Full data of molar conductivity of the three silver(I) complexes over time are presented in the Supplementary Information section.
Structural studies of complexes (1-3)
The main crystallographic data for complexes (1-3) are summarized in Table 4. Selected bond distances and angles for complexes (1-3) are described in Table 5 while the structural models of complexes (1-3) are drawn in Figure 2; further information are available in the Supplementary Information section.
The molecular complex 1 can be described by μ nitrate bridged dimer, with one bidentate bridging anti anti O-bound nitrate ligand, Figure 2a, presenting two metal centers with distinct coordination environments. The hydrated complex contains silver(I) ion coordinated by bridging nitrate ion, two DCQ ligands through the quinoline nitrogen atoms and water molecule. The second silver(I) ion is coordinated by bridging nitrate ion, a monodentate nitrate ion and two DCQ ligands through the quinoline nitrogen atoms. In both cases, the most linear sequence is dictated by the trans-DCQ nitrogen atoms (N-Ag-N angles falling in the 166-170° range). The supramolecular structure is stabilized by hydrogen bonds, with the shortest intermolecular O···O distance (linking the coordinated water oxygen to neighbouring nitrate) of 2.82 Å. Intermolecular π···π interactions, giving rise to infinite stacks of quinoline rings running parallel to the b axis, are also present, with ring centroid-to-centroid distances in the 3.63(4)-3.65(3) Å range. In complex 2, the silver(I) ion is coordinated by Bpy in chelate mode, forming the well-known five-membered [AgN2C2] ring, and also by single DCQ ligand. In this case, nitrate ion is considered as ligand since the shortest Ag-ONO2 distance being 2.71 Å. The Ag-N distances fall in the 2.31(1)-2.41(1) Å range, in line with literature data retrieved in the Cambridge Structural Database. The supramolecular stabilization, in the absence of truly acidic protons, is guaranteed by weak CH-O and CH-Cl interactions and by evident intermolecular π···π interactions between DCQ and Bpy ligands of adjacent complexes, less than 3.30 Å apart. The molecular complex 3 can be described by μ,μ-dinitrate-bridged dimer, with bifurcated bis-chelate mode with one of the oxygen atoms common to both chelate silver-nitrate groups, with X-Ag-X (X = N, O, P) angles in the 47.48(4)-150.81(4)° range (see Figure 2c). The silver-oxygen distances 2.5981(13) and 2.8167(13) Å are consistent with similar ones reported structures,39 while other supramolecular interactions stabilize the crystal, it means, intermolecular π···π interactions between the phenyl rings of different molecules (centroid-to-centroid distance of 3.79 Å). A summary of the relevant intramolecular (Ag-O/N/P) bond lengths and (P/O/N-Ag-O/N/P) angles for three structures appears in Table 5.
Desolvation of complex 3
As anticipated in the Experimental section, the structural model defined for complex 3, compared to the observed X-ray intensity data, indicates that some residual density, assigned to disordered solvent molecules in the crystal pores, is present.40 Several X-ray powder diffraction (XRPD) patterns have been simulated using Mercury,18 and the full list of coordinates of the well determined molecular fragments to understand which features in the diffraction pattern contain information on the amount, location and orientation of such molecules (if they exist at all). An additional atom, a fake bromine atom one (Z = 35) with large Uiso value (set at 0.1 Å2) and variable site occupancy factor (sof’s) with a single spherical atom and average (rotationally disordered) CH3OH/CH3CN molecules, was positioned in ½, 0, ½ (geometrical center of the largest cavity). The results of these simulations are presented in the Figure 3, for sof’s falling in the 0.0 1.0 range, in 0.2 steps. Noteworthy, the low-angle peak (001, at 7.72°) can be taken as a fingerprint for solvent inclusion.

Changes in the simulated XRPD patterns upon adding a single bromine atom in the center of the crystal cavity (at ½, 0, ½), highlighting the very significant change of some peak intensities for different sof’s. Color codes: black for sof = 0; orange for sof = 1; intermediate patterns are calculated in 0.2 steps.
As can be observed therein, thanks to the special location of the newly added atom, and depending on the index parity, some peaks change dramatically their intensity (see for example the relatively intense 202 reflection at 19.14°) while others are only marginally changed (010 and 011, falling at 8.00° and 9.35°, respectively). In the low-angle region, the 001 reflection belongs to the former set, its intensity being more than quadruple for full bromine occupancy, with respect to what simulated for a vacant site. Therefore, the intensity of this peak alone may act as a visible fingerprint for any desolvation process, if, for example, powders of (3) are exposed to gentle heat or vacuum. More information can be obtained by comparing experimentally measured XRPD data with structural models, as done in Figure 4. The Rietveld refinement performed with fixed fractional coordinates (taken from the single-crystal determination) and refinable instrumental parameters provided the very poor match with Rwp= 0.258; at variance, a much better fit with Rwp= 0.119 was obtained by introducing a constellation of six freely floating light atoms (here, the N form factor was employed), all being located in the crystal voids, far away from the already determined molecular model of the silver(I) complex. The quality of the data and the inherent disorder of the solvents make, however, impossible to proceed further and obtain a more detailed atomistic picture.

Rietveld refinement fits for complex 3 without (top) and with (bottom) the addition of additional electron density in the crystal cavity. Visual inspection and the very large peak intensity of the 001 peak clearly indicate that the crystal channels contain a large quantity of orientationally disordered residual solvents.
Infrared (IR) microscopy measurements also have been performed to elucidate the structural/compositional differences of complex 3, with or without clathrated solvent molecules. The IR spectra, recorded from the surface of single crystal freshly taken from the mother liquor (a), after 15 min standing in air (b), and from the crushed single crystal (c), are shown in Figure 5. In all three cases, the band assigned to the νasymNO3- stretching around 1279 cm-1 (green dashed lines) is visible, highlighting the stability of complex 3 in the measurements. The bands associated to ν(OH) and ν(CN) falling at 3453 cm-1 (brown dashed line) and at 2186 cm-1 (purple dashed line),41 assigned to methanol and acetonitrile solvents, respectively, appear only in the spectrum (Figure 5a). Indeed, these bands disappear in spectra (Figures 5b and 5c), indicating that solvent molecules left within minutes or by gentle crushing.

Experimental FTIR spectra of the surface of single crystal freshly taken from the mother solution (a), after 15 min standing in air (b), and of the crushed single crystal (c). (d) The IR microscopy image of the crystal.
Biological assays
In vitro biological tests were conducted to determine MIC90 and IC50 values for the silver-DCQ complexes, as well as for DCQ ligand. The biological outcomes are reported in Table 6. The results show that complexes 1 and 3 are promising agents against mycobacterial infections, especially for M. tuberculosis H37Rv.
Compounds 1, 3, and DCQ exhibit similar or superior antitubercular activity against M. tuberculosis when compared to some commonly used anti-tubercular agents. The MIC90 values for compounds 1, 3, and DCQ are 14 ± 3, 7 ± 1, and 4.6 ± 0.1 µg mL-1, respectively. In contrast, standard drugs such as cycloserine, tobramycin, and clarithromycin, indicating that our compounds have equivalent or better efficacy. The assays indicate that the silver-DCQ complex with PPh3 (compound 3) demonstrates better antitubercular activity than the one with Bpy (compound 2). Specifically, compound 3 shows MIC90 of 7 ± 1 µg mL-1, whereas compound 2 has a MIC90 of 25.0 ± 0.1 µg mL-1, indicating significantly lower activity for compound 2. Compounds 1 and 3 display promising activities with MIC90 values of approximately 14 ± 3 and 7 ± 1 µg mL-1, respectively. However, the selectivity index (SI) values for the synthesized complexes are not as high as desired. Compound 1 has an SI of 3.33, and compound 3 has an SI of 5.59, which are considerably lower than that of DCQ, which has an SI of 45.08. According to previous studies,43,44 compounds with an SI greater than 10 are considered highly selective, those between 1 and 10 indicate moderate selectivity, and values below 1 indicate low selectivity, and SI ca. 2.5 is acceptable. Therefore, compounds 1 and 3, with SI values of 3.33 and 5.59, respectively, exhibit moderate selectivity. Notably, compounds 1 and 3 have lower metal ion percentages (19.06 and 17.12%, respectively) compared to the commercially available drug silver sulfadiazine (AgSD), which has a metal content of 30.21%. The reduced silver content in these compounds could potentially make them less toxic to normal cells than AgSD. This is supported by their higher IC50 values (46 ± 1 µg mL-1 for compound 1 and 42 ± 1 µg mL-1 for compound 3) compared to AgNO3 (IC50 = 0.34 µg mL 1), indicating lower cytotoxicity. Therefore, the lower percentage of silver(I) ions in compounds 1 and 3 may contribute to their decreased toxicity, making them promising candidates for further development as antitubercular agents.
Conclusions
Three silver complexes were described and characterized by a set of analytical methods and spectroscopic techniques. Complexes 2 and 3 presented a metal-ligand ratio of 1:1:1 (M:L1:L2), while complex 1 presented a metal-ligand ratio of 1:2 (M:L1). The crystal and molecular structures of complexes 1 and 3 were solved by single crystal methods, while the crystallographic model of complex 2 was obtained by state-of-art structural powder diffraction method. All three silver(I) complexes belong to the triclinic system and space group. The nitrate ion is coordinated to silver(I) ion in the cases of (1) and (3). X-ray powder diffraction of complex 3 shows that the crystal structure of complex 3 does not collapse after losing solvent molecules. The biological activity of silver(I) complexes, evaluated against M. tuberculosis, shows very promising results, particularly for complexes 1 and 3, that possess MIC90 lower than 14 ± 3 and 7 ± 1 µg mL-1, respectively, and SI values indicating moderate selectivity for these compounds. Structural, chemical and biological results encourage further studies of coordination compounds with d10 metals containing DCQ ligand or DCQ/phosphine ligands.
Acknowledgments
The authors would like to thank the Brazilian agencies CAPES (Coordenação de Aperfeiçoamento de Pessoal de Nível Superior); CNPq (Conselho Nacional de Desenvolvimento Científico e Tecnológico), and FAPEMIG (Fundação de Amparo à Pesquisa do Estado de Minas Gerais) for financial support as well to UFJF - Federal University of Juiz de Fora; and NEEM - Núcleo de Espectroscopia e Estrutura Molecular for the technical support in spectroscopy measurements, and Chemistry Institute of the Federal University of Uberlândia (UFU) - F.R.G. Bergamini for technical support in elemental analysis. P.P. Corbi thanks FAPESP, grants No. 2021/087178 and No. 2021/10265-8, Cancer Theranostics Innovation Center (CancerThera), Centros de Pesquisa, Inovação e Difusão (CEPID).
References
-
1 Qi, C.-C.; Xu, L.-R.; Zhao, C.-J.; Zhang, H.-Y.; Li, Q.-Y.; Liu, M.-J.; Zhang, Y.-X.; Tang, Z.; Ma, X.-X.; BMC Infect. Dis 2023, 23, 584. [Crossref]
» Crossref -
2 World Health Organization; (WHO); Global Tuberculosis Report 2024; Geneva, 2024. [Link] accessed in March 2025
» Link -
3 Singh, M.; Batt, S. M.; Canales, C. S. C.; Pavan, F. R.; Kumar, S. A.; Akshatha, H. S.; Bhagyalalitha, M.; Pujar, K. G.; Besra, G. S.; J. Enzyme Inhib. Med. Chem. 2024, 39, 2403744. [Crossref]
» Crossref -
4 Silva, A. P. B.; Roque-Borda, C. A.; Canales, C. S. C.; Primo, L. M. D. G.; Silva, I. C.; Ribeiro, C. M.; Chorilli, M.; da Silva, P. B.; Silva, J. L.; Pavan, F. R.; Diseases 2023, 11, 150. [Crossref]
» Crossref -
5 Khan, H.; Gómez-Aguilar, J. F.; Alkhazzan, A.; Khan, A.; Math. Methods Appl. Sci. 2020, 43, 3786. [Crossref]
» Crossref -
6 Basak, A.; Abouelhassan, Y.; Norwood, V. M.; Bai, F.; Nguyen, M. T.; Jin, S.; Huigens, R.; Chem. Eur. J. 2016, 22, 9181. [Crossref]
» Crossref -
7 Facchinetti, V.; Gomes, C. R. B.; Aboud, K. C. L.; Fiorot, R. G.; de Carvalho, G. G. C.; Paier, C. R. K.; Pessoa, C. Ó.; Gomes, A. C. C.; de Souza, M. V. N.; Vasconcelos, T. R. A.; J. Braz. Chem. Soc. 2024, 35, e-20230139. [Crossref]
» Crossref -
8 Rustomjee, R.; Diacon, A. H.; Allen, J.; Venter, A.; Reddy, C.; Patientia, R. F.; Mthiyane, T. C. P.; De Marez, T.; van Heeswijk, R.; Kerstens, R.; Koul, A.; De Beule, K.; Donald, P. R.; McNeeley, D. F.; Antimicrob. Agents Chemother. 2008, 52, 2831. [Crossref]
» Crossref -
9 Nakahata, D. H.; Lustri, W. R.; Cuin, A.; Corbi, P. P.; J. Mol. Struct. 2016, 1125, 609. [Crossref]
» Crossref -
10 Zanvettor, N. T.; Abbehausen, C.; Lustri, W. R.; Cuin, A.; Masciocchi, N.; Corbi, P. P.; J. Mol. Struct. 2015, 1082, 180. [Crossref]
» Crossref -
11 Frei, A.; Zuegg, J.; Elliott, A. G.; Baker, M. V.; Braese, S.; Brown, C., Chen, F.; Downson, C.; Dujardin, G.; Jung, N.; King, P.; Mansour, A. M.; Massi, M.; Moat, J.; Mohamed, H. A.; Renfrew, A. K.; Rutledge, P. J.; Sadler, P. J.; Todd, M. H.; Willans, C. E.; Wilson, J. J.; Cooper, M. A.; Blaskovich, M. A. T.; Chem. Sci. 2020, 11, 2627. [Crossref]
» Crossref -
12 Paris Jr., J. A.; Cavicchioli, M.; Machado, R. T. A.; Pavan, F.; Nakahata, D. H.; Corbi, P. P.; Costa, A. M. F.; Pereira, D. H.; Massabni, A. C.; Quim. Nova 2021, 44, 278. [Crossref]
» Crossref -
13 Honorato, J.; Oliveira, K. M.; Leite, C. M.; Colina vegas, L.; Nóbrega, J. A.; Castellano, E. E.; Ellena, J.; Correa, R. S.; Batista, A. A.; J. Braz. Chem. Soc 2020, 31, 2237. [Crossref]
» Crossref -
14 Pich, C. T.; dos Santos, P. R.; Fortunato, T. V. O.; Chiarello, M.; de Oliveira, I. M.; Soares, B. Q.; Ghermani, N. E.; Machado, M.; Roesch-Ely, M.; Dumas, F.; Terenzi, H.; Henriques, J. A. P.; Moura, S.; J. Braz. Chem. Soc. 2019, 30, 597. [Crossref]
» Crossref -
15 Sheldrick, G. M.; Acta Cryst. Sect. A 2015, 71, 3. [Crossref]
» Crossref -
16 Sheldrick, G. M.; Acta Cryst. Sect. C 2015, 71, 3. [Crossref]
» Crossref -
17 Dolomanov, O. V.; Bourhis, L. J.; Gildea, R. J.; Howard, J. A. K.; Puschmann, H.; J. Appl. Cryst. 2009, 42, 339. [Crossref]
» Crossref -
18 Macrae, C. F.; Sovago, I.; Cottrell, S. J.; Galek, P. T. A.; McCabe, P.; Pidcock, E.; Paltings, M.; Shields, G. P.; Stevens, J. S.; Towler, M.; Wood, P. A.; J. Appl. Cryst. 2020, 53, 226. [Crossref]
» Crossref - 19 David, W. I. F.; Structure Determination from Powder Diffraction Data, International Union of Crystallography Monographs on Crystallography; David, W. I. F.; Shankland, K.; McCusker, L. B.; Baerlocher, Ch., eds.; Oxford University Press: London, UK, 2006.
-
20 Masciocchi, N.; Sironi, A.; Dalton Trans. 1997, 24, 4643. [Crossref]
» Crossref -
21 Masciocchi, N.; Sironi, A.; C. R. Chim. 2005, 8, 1617. [Crossref]
» Crossref -
22 De Wolff, P. M. A.; J. Appl. Cryst. 1968, 1, 108. [Crossref]
» Crossref -
23 Pawley, G. S.; J. Appl. Cryst. 1981, 14, 357. [Crossref]
» Crossref -
24 Coelho, A. A.; J. Appl. Cryst. 2003, 36, 86. [Crossref]
» Crossref - 25 TOPAS-R, v.4.2; Bruker AXS, Karlsruhe, Germany, 2009.
-
26 Merritt, L. L.; Schroeder, E.; Acta Cryst. 1956, 9, 801. [Crossref]
» Crossref -
27 Kulkarni, A. A.; King, C.; Butcher, R. J.; Fortunak, J. M. D.; Acta Cryst. 2012, 68, 1498. [Crossref]
» Crossref - 28 Young, R. A.; The Rietveld Method. (International Union of Crystallography Monographs on Crystallography); Young, R. A., ed.; Oxford University Press: New York, USA, 1981.
-
29 Palomino, J. C.; Martin, A.; Camacho, M.; Guerra, H.; Swings, J.; Portaels, F.; Antimicrob. Agents Chemother. 2002, 46, 2720. [Crossref]
» Crossref -
30 Pavan, F. R.; Maia, P. I. S.; Leite, S. R. A.; Deflon, V. M.; Batista, A. A.; Sato, D. N.; Franzblau, S. G.; Leite, C. Q. F.; Eur. J. Med. Chem. 2010, 45, 1898. [Crossref]
» Crossref -
31 Amaral, T. C.; Miguel, F. B.; Couri, M. R. C.; Corbi, P. P.; Carvalho, M. A.; Campos, D. L.; Pavan, F. R.; Cuin, A.; Polyhedron 2018, 146, 166. [Crossref]
» Crossref -
32 Kock, F. V. C.; Colnago, L. A.; J. Braz. Chem. Soc. 2022, 33, 509. [Crossref]
» Crossref -
33 Pereira, C. S.; Quadros, H. C.; Moreira, D. R. M.; Castro, W.; Da Silva, R. I. S. D.; Soares, M. B. P.; Fontinha, D.; Prudêncio, M.; Schmitz, V.; Dos Santos, H. F.; Gendrot, M.; Fonta, I.; Mosnier, J.; Pradines, B.; Navarro, M.; ChemMedChem 2020, 16, 662. [Crossref]
» Crossref -
34 Dammak, K.; Porchia, M.; De Franco, M.; Zancato, M.; Naïli, H.; Gandin, V.; Marzano, C.; Molecules 2020, 25, 5484. [Crossref]
» Crossref -
35 Kuchar, J.; Rust, J.; Lehmann, C. W.; Mohr, F.; Inorg. Chem. 2020, 59, 10557. [Crossref]
» Crossref -
36 Baranova, K. F.; Titov, A. A.; Filippov, O. A.; Smol’yakov, A. F.; Averin, A. A.; Shubina, E. S.; Crystals 2020, 10, 881. [Crossref]
» Crossref -
37 Santos, A. F.; Ferreira, I. P.; Pinheiro, C. B.; Santos, V. G.; Lopes, M. T. P.; Teixeira, L. R.; Rocha, W. R.; Rodrigues, G. L. S.; Beraldo, H.; ACS Omega 2018, 3, 7027. [Crossref]
» Crossref -
38 Ali, I.; Wani, W. A.; Saleem, K.; Synth. React. Inorg., Met.-Org., Nano-Met. Chem. 2013, 43, 1162. [Crossref]
» Crossref -
39 Moon, H.; Lim, S. W.; Kim, D.; Jung, O.S.; Lee, Y. A.; CrystEngComm 2021, 23, 1272. [Crossref]
» Crossref -
40 Noll, J.; Korb, M.; Lang, H.; Acta Cryst. Sect. E 2016, 72, 318. [Crossref]
» Crossref -
41 dos Santos, P. V. P.; Ribeiro, C. M.; Pavan, F. R.; Corbi, P. P.; Bergamini, F. R. G.; Carvalho, M. A.; D’Oliveria, K. A.; Cuin, A.; J. Mol. Struct. 2021, 1234, 130193. [Crossref]
» Crossref -
42 Colina-Vegas, L.; Dutra, J. L.; Villarreal, W.; Neto, J. H. A.; Cominetti, M. R.; Pavan, F.; Navarro, M.; Batista, A. A.; J. Inorg. Biochem 2016, 162, 135. [Crossref]
» Crossref -
43 D’Oliveira, K. A.; Souza, I. O.; Glanzmann, N.; Da Silva, A. D.; Bruziguini, C. E. T.; Ribeiro, M. A.; Canales, C. S. C.; Roque-Borda, C. A.; Pavan, F. R.; Cuin, A.; J. Coord. Chem. 2025, 78, 409. [Crossref]
» Crossref -
44 Campos, D. L.; Canales, C. S. C.; Demarqui, F. M.; Fernandes, G. F. S.; dos Santos, C. G.; Prates, J. L. B.; da Silva, I. G. M.; Barros-Cordeiro, K. B.; Báo, S. N.; de Andrade, L. N.; Abichabki N.; Zacharias, L. V.; de Campos, M. M. A.; dos Santos, J. L.; Pavan, F. R.; Front. Microbiol. 2024, 15, 1487829. [Crossref]
» Crossref
Edited by
-
Editor handled this article:
Izaura C. N. Diógenes (Executive)