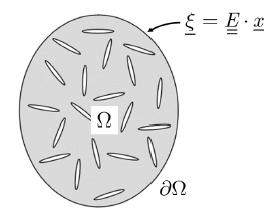
Figure 1
Representative elementary volume of the fractured medium and loading mode
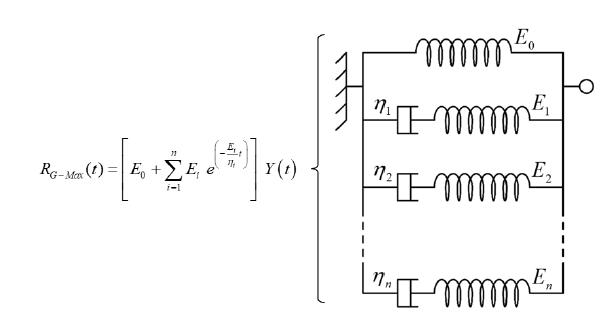
Figure 2
Generalized Maxwell model and its relaxation function (excerpt from Aguiar and Maghous, 2018Aguiar, C.B., Maghous, S., (2018). Micromechanical approach to effective viscoelastic properties of micro‐fractured geomaterials. International Journal for Numerical and Analytical Methods in Geomechanics 42(16): 2018-2046)
Figure 3
Generalized Maxwell model for viscoelastic moduli and (excerpt from Aguiar and Maghous, 2018Aguiar, C.B., Maghous, S., (2018). Micromechanical approach to effective viscoelastic properties of micro‐fractured geomaterials. International Journal for Numerical and Analytical Methods in Geomechanics 42(16): 2018-2046)
Figure 4
Elements of the discretized geometric model
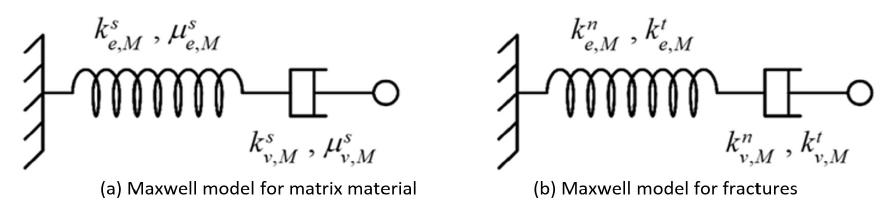
Figure 5
Rheological model elements for case 1 (Maxwell-Maxwell)
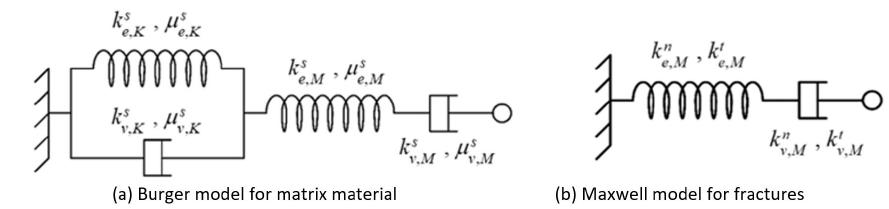
Figure 6
Rheological model elements for case 2 (Burger-Maxwell)
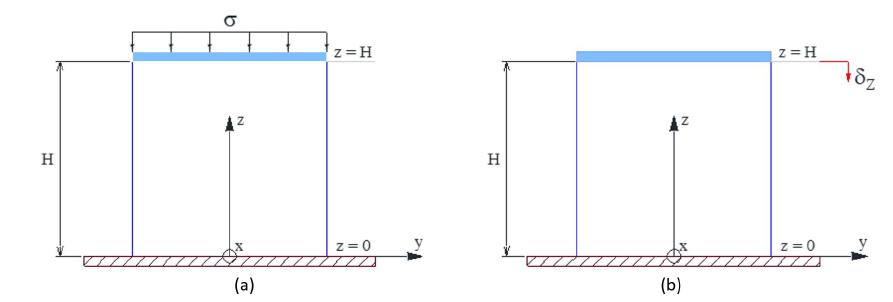
Figure 7
YZ-plane for specimen subjected to compressive stress (a) and imposed displacement (b)
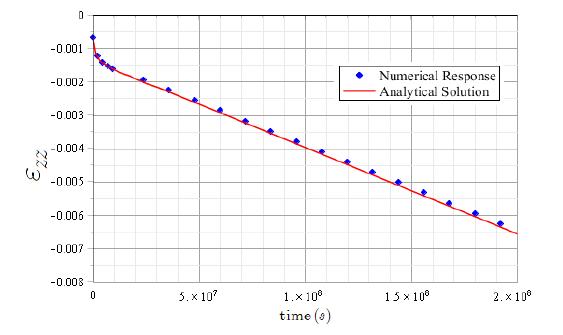
Figure 8
Comparison of delayed responses for vertical strain (Maxwell-Maxwell)
Figure 9
Comparison of delayed responses for horizontal strain (Maxwell-Maxwell)
Figure 10
Comparison of delayed responses for vertical strain (Burger-Maxwell)
Figure 11
Comparison of delayed responses for horizontal strain (Burger-Maxwell)
Figure 12
Relative Error between the numerical and the analytical strain predictions
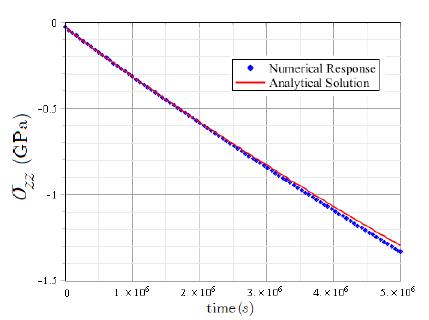
Figure 13
Comparison of delayed responses for stress (Maxwell-Maxwell)
Figure 14
Comparison of delayed responses for stress (Maxwell-Maxwell)
Figure 15
Comparison of delayed responses for stress (Burger-Maxwell)
Figure 16
Comparison of delayed responses for stress (Burger-Maxwell)
Figure 17
Relative Error between the numerical and the analytical stress predictions
Figure 18
YZ-plane for specimen subjected to constant vertical displacement rate
Figure 19
Comparison of delayed responses for stress (Maxwell-Maxwell)
Figure 20
Comparison of delayed responses for stress (Maxwell-Maxwell)
Figure 21
Comparison of delayed responses for stress (Burger-Maxwell)
Figure 22
Comparison of delayed responses for stress (Burger-Maxwell)
Figure 23
Relative Error between the numerical and the analytical stress predictions
Figure 24
Dimensions and boundary conditions for the geometric model
Figure 25
Finite element mesh for circular cross-section tunnel
Figure 26
Comparison of radial convergence (Maxwell-Maxwell)
Figure 27
Comparison of radial displacements as a function of (Maxwell-Maxwell)
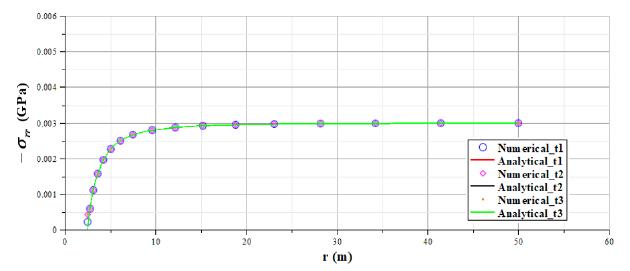
Figure 28
Comparison of radial stresses as a function of (Maxwell-Maxwell)
Figure 29
Comparison of radial convergence (Burger-Maxwell)
Figure 30
Comparison of radial displacements as a function of (Burger-Maxwell)
Figure 31
Comparison of radial stresses as a function of (Burger-Maxwell)
Figure 32
Displacement conditions and pressure on tunnel lining
Figure 33
Comparison of pressure exerted on tunnel lining (Maxwell-Maxwell)
Figure 34
Comparison of radial displacements as a function of (Maxwell-Maxwell)
Figure 35
Comparison of radial stresses as a function of (Maxwell-Maxwell)
Figure 36
Comparison of pressure exerted on tunnel lining (Burger-Maxwell)
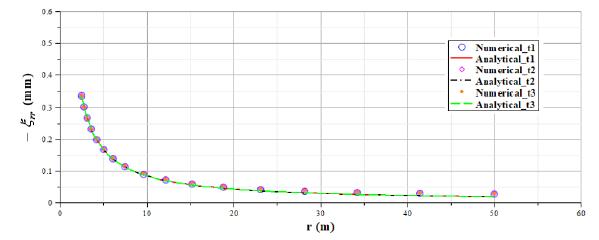
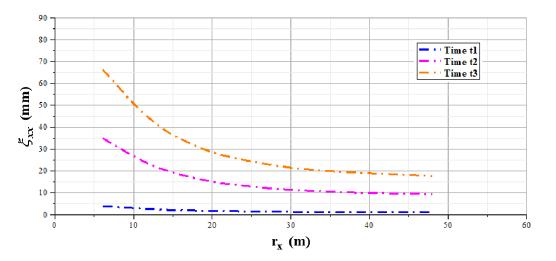
Figure 37
Comparison of radial displacements as a function of (Burger-Maxwell)
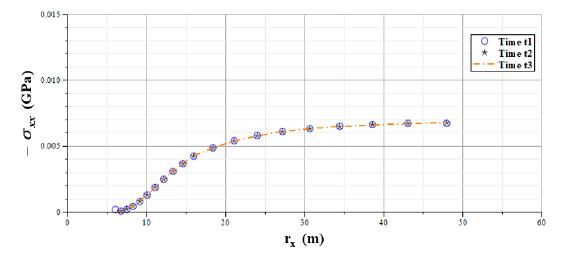
Figure 38
Comparison of radial stresses as a function of (Burger-Maxwell)
Figure 39
Geometric model dimensions and horseshoe cross-section analysis axes
Figure 40
Boundary conditions and finite element mesh for horseshoe cross-section tunnel
Figure 41
Vertical displacements in Y-axis (Maxwell-Maxwell)
Figure 42
Vertical stresses in Y-axis (Maxwell-Maxwell)
Figure 43
Horizontal displacements in X-axis (Maxwell-Maxwell)
Figure 44
Horizontal stresses in X-axis (Maxwell-Maxwell)
Figure 45
Vertical displacements in Y-axis (Burger-Maxwell)
Figure 46
Vertical stresses in Y-axis (Burger-Maxwell)
Figure 47
Horizontal displacements in X-axis (Burger-Maxwell)
Figure 48
Horizontal stresses in X-axis (Burger-Maxwell)