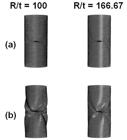
Figure 1
Visualization of (a) undeformed and (b) deformed cylindrical shells having a circumferential crack having different R/t.
Figure 2
Geometry of cone having crack imperfection subjected to axial compression.
Figure 3
Typical conical shell having 45° crack meshed using suggested meshing technique in the current study with crack length, A = 57 mm.
Figure 4
Experimental setup for axially compressed cone as exemplified for specimen 1.
Figure 5
Experimental and FE predicted axial load against crack percentage for imperfect conical shells with axial crack.
Figure 6
Experimental and FE predicted axial load against crack percentage for imperfect conical shells with circumferential crack.
Figure 7
Experimental and FE predicted axial load against crack percentage for imperfect conical shells with angular crack.
Figure 8
Graph of axial collapse load against crack angle, θ, for cone with thinness ratio, r1/t = 25, having different crack length, A.
Figure 9
Graph of axial collapse load against crack angle, θ, for cone with thinness ratio, r1/t = 250, having different crack length, A.
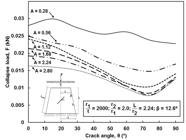
Figure 10
Graph of axial collapse load against crack angle, θ, for cone with thinness ratio, r1/t = 2000, having different crack length, A.
Figure 11
Graph of axial collapse load against crack length, A, for cone with thinness ratio, r1/t = 25, having different crack angle, θ.
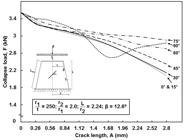
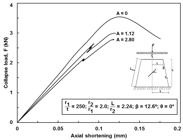
Figure 12
Graph of axial collapse load against crack length, A, for cone with thinness ratio, r1/t = 250, having different crack angle, θ.
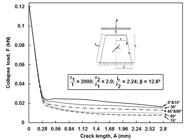
Figure 13
Graph of axial collapse load against crack length, A, for cone with thinness ratio, r1/t = 2000, having different crack angle, θ.
Figure 14
Graph of normalized axial collapse load versus crack length, A, for cracked cones with circumferential crack (0°) having different radius-thickness ratio, r1/t.
Figure 15
Graph of normalized axial collapse load versus crack length, A, for cracked cones with angled crack (75°) having different radius-thickness ratio, r1/t.
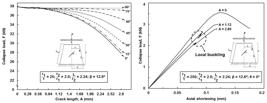
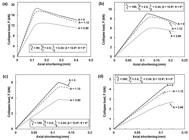
Figure 16
Graph of axial collapse load against axial shortening for perfect and imperfect cone with thinness ratio, r1/t = 25 having circumferential crack.
Figure 17
Graph of axial collapse load against axial shortening for perfect and imperfect cone with thinness ratio, r1/t = 250 having circumferential crack.
Figure 18
Graph of axial collapse load deformation curve for perfect and imperfect cone with different thinness ratio having circumferential crack.
Figure 4
Experimental setup for axially compressed cone as exemplified for specimen 1.
Figure 5
Experimental and FE predicted axial load against crack percentage for imperfect conical shells with axial crack.
Figure 6
Experimental and FE predicted axial load against crack percentage for imperfect conical shells with circumferential crack.
Figure 7
Experimental and FE predicted axial load against crack percentage for imperfect conical shells with angular crack.
Figure 8
Graph of axial collapse load against crack angle, θ, for cone with thinness ratio, r1/t = 25, having different crack length, A.
Figure 9
Graph of axial collapse load against crack angle, θ, for cone with thinness ratio, r1/t = 250, having different crack length, A.
Figure 10
Graph of axial collapse load against crack angle, θ, for cone with thinness ratio, r1/t = 2000, having different crack length, A.
Figure 11
Graph of axial collapse load against crack length, A, for cone with thinness ratio, r1/t = 25, having different crack angle, θ.
Figure 12
Graph of axial collapse load against crack length, A, for cone with thinness ratio, r1/t = 250, having different crack angle, θ.
Figure 13
Graph of axial collapse load against crack length, A, for cone with thinness ratio, r1/t = 2000, having different crack angle, θ.
Figure 14
Graph of normalized axial collapse load versus crack length, A, for cracked cones with circumferential crack (0°) having different radius-thickness ratio, r1/t.
Figure 15
Graph of normalized axial collapse load versus crack length, A, for cracked cones with angled crack (75°) having different radius-thickness ratio, r1/t.
Figure 16
Graph of axial collapse load against axial shortening for perfect and imperfect cone with thinness ratio, r1/t = 25 having circumferential crack.
Figure 17
Graph of axial collapse load against axial shortening for perfect and imperfect cone with thinness ratio, r1/t = 250 having circumferential crack.
Figure 18
Graph of axial collapse load deformation curve for perfect and imperfect cone with different thinness ratio having circumferential crack.

 Thumbnail
 Thumbnail
 Thumbnail
 Thumbnail
 Thumbnail
 Thumbnail
 Thumbnail
 Thumbnail
 Thumbnail
 Thumbnail
 Thumbnail
 Thumbnail
 Thumbnail
 Thumbnail
 Thumbnail
 Thumbnail
 Thumbnail
 Thumbnail


