Abstract
INTRODUCTION:
The objective was to identify space and space-time risk clusters for the occurrence of deaths in a priority city for the control of tuberculosis (TB) in the Brazilian Northeast.
METHODS:
Ecological research was undertaken in the City of São Luis/Maranhão. Cases were considered that resulted in deaths in the population living in the urban region of the city with pulmonary TB as the basic cause, between 2008 and 2012. To detect space and space-time clusters of deaths due to pulmonary TB in the census sectors, the spatial analysis scan technique was used.
RESULTS:
In total, 221 deaths by TB occurred, 193 of which were due to pulmonary TB. Approximately 95% of the cases (n=183) were geocoded. Two significant spatial clusters were identified, the first of which showed a mortality rate of 5.8 deaths per 100,000 inhabitants per year and a high relative risk of 3.87. The second spatial cluster showed a mortality rate of 0.4 deaths per 100,000 inhabitants per year and a low relative risk of 0.10. A significant cluster was observed in the space-time analysis between 11/01/2008 and 04/30/2011, with a mortality rate of 8.10 deaths per 100,000 inhabitants per year and a high relative risk (3.0).
CONCLUSIONS:
The knowledge of priority sites for the occurrence of deaths can support public management to reduce inequities in the access to health services and permit an optimization of the resources and teams in the control of pulmonary TB, providing support for specific strategies focused on the most vulnerable populations.
Pulmonary tuberculosis; Spatio-temporal and spatial analysis; Death
INTRODUCTION
Tuberculosis (TB) is one of the main causes of death among infectious contagious diseases and occurs mainly in developing countries(1)1 World Health Organization (WHO). Global tuberculosis report 2013. Geneva: WHO; 2013.. In 2012, 1.3 million people died of TB worldwide. Brazil ranked 16th in the number of cases and 109th in terms of incidence rate(1)1 World Health Organization (WHO). Global tuberculosis report 2013. Geneva: WHO; 2013., with 36.1 cases per 100,000 inhabitants and a mortality rate of 2.4 deaths per 100,000 inhabitants(2)2 Malta DC, França E, Abreu DX, Oliveira H, Monteiro RA, Sardinha LMV, et al. Atualização da lista de causas de mortes evitáveis (5 a 74 anos de idade) por intervenções do Sistema Único de Saúde do Brasil. Epidemiol Serv Saude 2011; 20:409-412..
It is notable that among the clinical forms of the disease, pulmonary tuberculosis (PTB)
is on the list of avoidable causes of death because if the local health services
established appropriate health promotion, protection and recovery actions for patients
and their families, deaths from TB would be less common(3)3 Ministério da Saúde. Secretaria Executiva. Departamento de Informática
do SUS (DATASUS).Cited 2014 January 10 2014. . Avaiable at:
http://www.datasus.saude.gov.br/.
http://www.datasus.saude.gov.br/....
.
Considered a social disease(4)4 San Pedro A, Oliveira RM. Tuberculose e indicadores socioeconômicos: revisão sistemática da literatura. Rev Panam Salud Pública 2013; 33:294-301., TB should be studied from a microregional, local and focal viewpoint, according to the spatial distribution(5)5 Teixeira GM. Aprofundar o conhecimento espacial da tuberculose para melhor combatê-la. Bol Pneum Sanit 2004; 12:141-143.. Therefore, a geo-epidemiological approach to the disease, using geoprocessing techniques, has been adopted in the international sphere(6)6 Shah L, Choi W, Berrang-Ford L, Henostroza G, Krapp F, Zamudio C, et al. Geographic predictors of primary multidrug-resistant tuberculosis cases in an endemic area of Lima, Peru Int J Tuberc Lung Dis 2014; 18:1307-1314. (7)7 Alvarez-Hernandez G, Lara-Valencia F, Reyes-Castro PA, Rascon-Pacheco RA. An analysis of spatial and socio-economic determinants of tuberculosis in Hermosillo, Mexico, 2000-2006 Int J Tuberc Lung Dis2010; 14:708-713. (8)8 Bai J, Zou G, Mu S, Ma Y. Using Spatial Analysis to Identify Tuberculosis Transmission and Surveillance. Computer Engineering and Networking, Lecture Notes in Electrical Engineering 2014; 277:337-344. (9)9 Zaragoza Bastida A, Hernandez Tellez M, Bustamante Montes LP, Medina T, Jaramillo Paniagua JN, Mendoza Martínez GD, et al. Spatial and Temporal Distribution of Tuberculosis in the State of Mexico, Mexico Scientific World J 2012; 12:1-7. (10)10 Jenkins HE, Plesca V, Ciobanu A, Crudu V, Galusca I, Soltan V, et al. Assessing spatial heterogeneity of multidrug-resistant tuberculosis in a high-burden country. Eur Respir J 2013; 42:1291-1301. (11)11 Li X-X, Wang L-X, Zhang J, Liu Y-X, Zhang H, Jiang S-W, et al. Exploration of ecological factors related to the spatial heterogeneity of tuberculosis prevalence in P. R. China. Glob Health Action 2014; 7:1-12 (12)12 Murray EJ, Marais BJ, Mans G, Beyers N, Ayles H, Godfrey-Faussett P, et al. A multidisciplinary method to map potential tuberculosis transmission 'hot spots' in high-burden communities. Int J Tuberc Lung Dis2009; 13:767-774. (13)13 Randremanana RV, Richard V, Rakotomanana F, Sabatier P, Bicout DJ. Bayesian mapping of pulmonar tuberculosis in Antananarivo, Madagascar. BMC Infectious Diseases 2010; 10:1-10. (14)14 Tiwari N, Adhikari CMS, Tewari A, Kandpal V. Investigation of geo-spatial hotspots for the occurrence of tuberculosis in Almora district, India, using GIS and spatial scan statistic. Int J Health Geog 2006; 5:1-11. (15)15 Tiwaria N, Kandpalb V, Tewaric A, Mohan Raod KR, Toliae VS. Investigation of tuberculosis clusters in Dehradun city of India. Asian Pacific J Trop Med 2010; 3:486-490. (16)16 Touray K, Adetifa IM, Jallow A, Rigby J, Jeffries D, Cheung YB, et al. Spatial analysis of tuberculosis in an urban West African setting: is there evidence of clustering? Tropical Med Int Health 2010; 15:664-672. (17)17 Wang T, Xue F, Chen Y, Yunbo Ma Y, Liu Y. The spatial epidemiology of tuberculosis in Linyi City, China, 2005-2010. BMC Public Health 2012; 12:1-8.. Nevertheless, the introduction of this technology to support the action planning and decision making of health managers and workers is still restricted(18)18 Guimarães RB, Ribeiro H. O tratamento cartográfico da informação em saúde do trabalhador. Rev Bras Epidemiol 2010; 13:577-586..
In Brazil, a series of studies was undertaken that considered the incidence of the disease and undoubtedly contributed to a better understanding of its dynamics in distinct territories(19)19 Araújo KMFA, Figueiredo TMRM, Gomes LCF, Pinto ML, Silva TC, Bertolozzi MR. Evolução da distribuição espacial dos casos novos de tuberculose no município de Patos (PB), 2001-2010. Cad Saude Coletiva 2013; 21:296-302. (20)20 Barbosa IR, Pereira LMS, Medeiros PFM, Valentim RS, Brito JM, Costa ICC. Análise da distribuição espacial da tuberculose na Região Nordeste do Brasil, 2005-2010. Epidemiol Serv Saude2013; 22:687-695. (21)21 Barroso CMR, Ferreira Neto JV. Análise do padrão de distribuição espacial dos casos de tuberculose em Arapiraca/AL, período 2000-2005. Revista Reflexões e Práticas Geográficas 2014; 1:1-15. (22)22 Daronco A, Borges TS, Sonda EC, Lutz B, Rauber A, Battisti F, et al. Distribuição espacial de casos de tuberculose em Santa Cruz do Sul, município prioritário do Estado do Rio Grande do Sul, Brasil, 2000-2010. Epidemiol Serv Saude2012; 21:645-654. (23)23 Hino P, Santos CB, Villa TCS. Evolução espaço-temporal dos casos de tuberculose em Ribeirão Preto (SP), nos anos de 1998-2002. J Bras Pneumol 2005; 31:523-527. (24)24 Melo TEMP, Resendes APC, Souza-Santos R, Basta PC. Distribuição espacial e temporal da tuberculose em indígenas e não indígenas de Rondônia, Amazônia Ocidental, Brasil. Cad Saude Publica 2012; 28:267-280. (25)25 Roza DL. Padrões espaço-temporais da incidência da tuberculose em Ribeirão Preto, SP: uso de um modelo bayesiano auto regressivo condicional.Faculdade de Medicina de Ribeirão Preto, Universidade de São Paulo, Ribeirao Preto; 2011.115 p. (26)26 Sales CMM, Figueiredo TAM, Zandonade E, Maciel ELN. Análise espacial da tuberculose infantil no Estado do Espírito Santo, 2000 a 2007. Rev Soc Bras Med Trop 2010; 43:435-439. (27)27 Santos CB, Hino P, Cunha TN, Villa TCS, Muniz JN. Utilização de um sistema de informação geográfica para descrição dos casos de tuberculose. Bol Pneum Sanit2004; 12:5-10. (28)28 Vieira RCA, Prado TN, Siqueira MG, Dietze R,. Maciel ELN Distribuição espacial dos casos novos de tuberculose em Vitória, Estado do Espírito Santo, no período entre 2000 e 2005. Rev Soc Bras Med Trop2008; 41:82-86.. However, few studies have considered other indicators of disease progress and/or impact in communities, such as deaths by PTB(29)29 Santos Neto M, Yamamura M, Garcia MCC, Popolin MP, Silveira TRS, Arcêncio RA. Análise espacial dos óbitos por tuberculose pulmonar em São Luis (MA). J Bras Pneumol2014; 40:543-551. (30)30 Mota FF, Vieira-da-Silva LM, Paim JS, Costa MCN. Distribuição espacial da mortalidade por tuberculose em Salvador, Bahia, Brasil. Cad Saude Publica2003; 19:915-922. (31)31 Vicentin G, Santo AH, Carvalho MS. Mortalidade por tuberculose e indicadores sociais no município do Rio de Janeiro. Cien Saude Colet 2002; 7:253-263..
Considering the newly approved target of the World Health Organization (WHO)(32)32 World Health Organization (WHO). Global tuberculosis report, 2014. WHO/HMT/TB/2014.08. Geneva: WHO; 2014. to reduce deaths from TB by 95% by 2035, and considering that TB mortality studies permit detection of flaws in the health system(33)33 Selig L, Kritski AL, Cascão AM, Braga JU, Trajman A, Carvalho RMG. Proposta de vigilância de óbitos por tuberculose em sistemas de informação. Rev Saude Publica 2010; 44:1072-1078. and permit a more in-depth understanding of the transmission of this disease(34)34 Sousa LMO, Pinheiro RS. Óbitos e internações por tuberculose não notificados no município do Rio de Janeiro. Rev Saude Publica2011; 45:31-39., it is relevant to conduct research to determine population areas or segments atgreater risk of death from PTB.
There is evidence that deaths have not occurred independently or randomly across territories but tend to cluster in specific regions where there is a lack of social support networks and low human and social development(35)35 Curtis S. Health and Inequality: Geographical Perspectives. London: Sage Publications; 2004. (36)36 Álvarez JL, Kunst AE, Leinsalu M, Bopp M, Strand BH, Menvielle G, et al. Educational inequalities in tuberculosis mortality in sixteen European populations. Int J Tuberc Lung Dis2011; 15:1461-1467..
Identifying problems in an environment or population and, in turn, assessing the risks involved are key steps to define a management program for these events. In view of the different conceptions of risk, the definition by Gondim(37)37 Gondim GMM. Do Conceito de Risco ao da Precaução: entre determinismos e incertezas. In: Fonseca AF, Corbo AMA, editors. O territorio e o processo saude-doença. Rio de Janeiro: EPSJV/FIOCRUZ; 2007. was chosen, which considers risk as the probability that an event will occur and the magnitude of damage or social consequences for a group or a community.
Based on the above background, the objective of this study is to understand some determinants of the TB transmission chain and to survey risk areas for deaths and therefore for vulnerable populations. This effort will support the workers and managers in making health decisions and planning. The approach consists of identifying space and space-time risk clusters for the occurrence of deaths in a priority city for TB control in Northeast Brazil.
METHODS
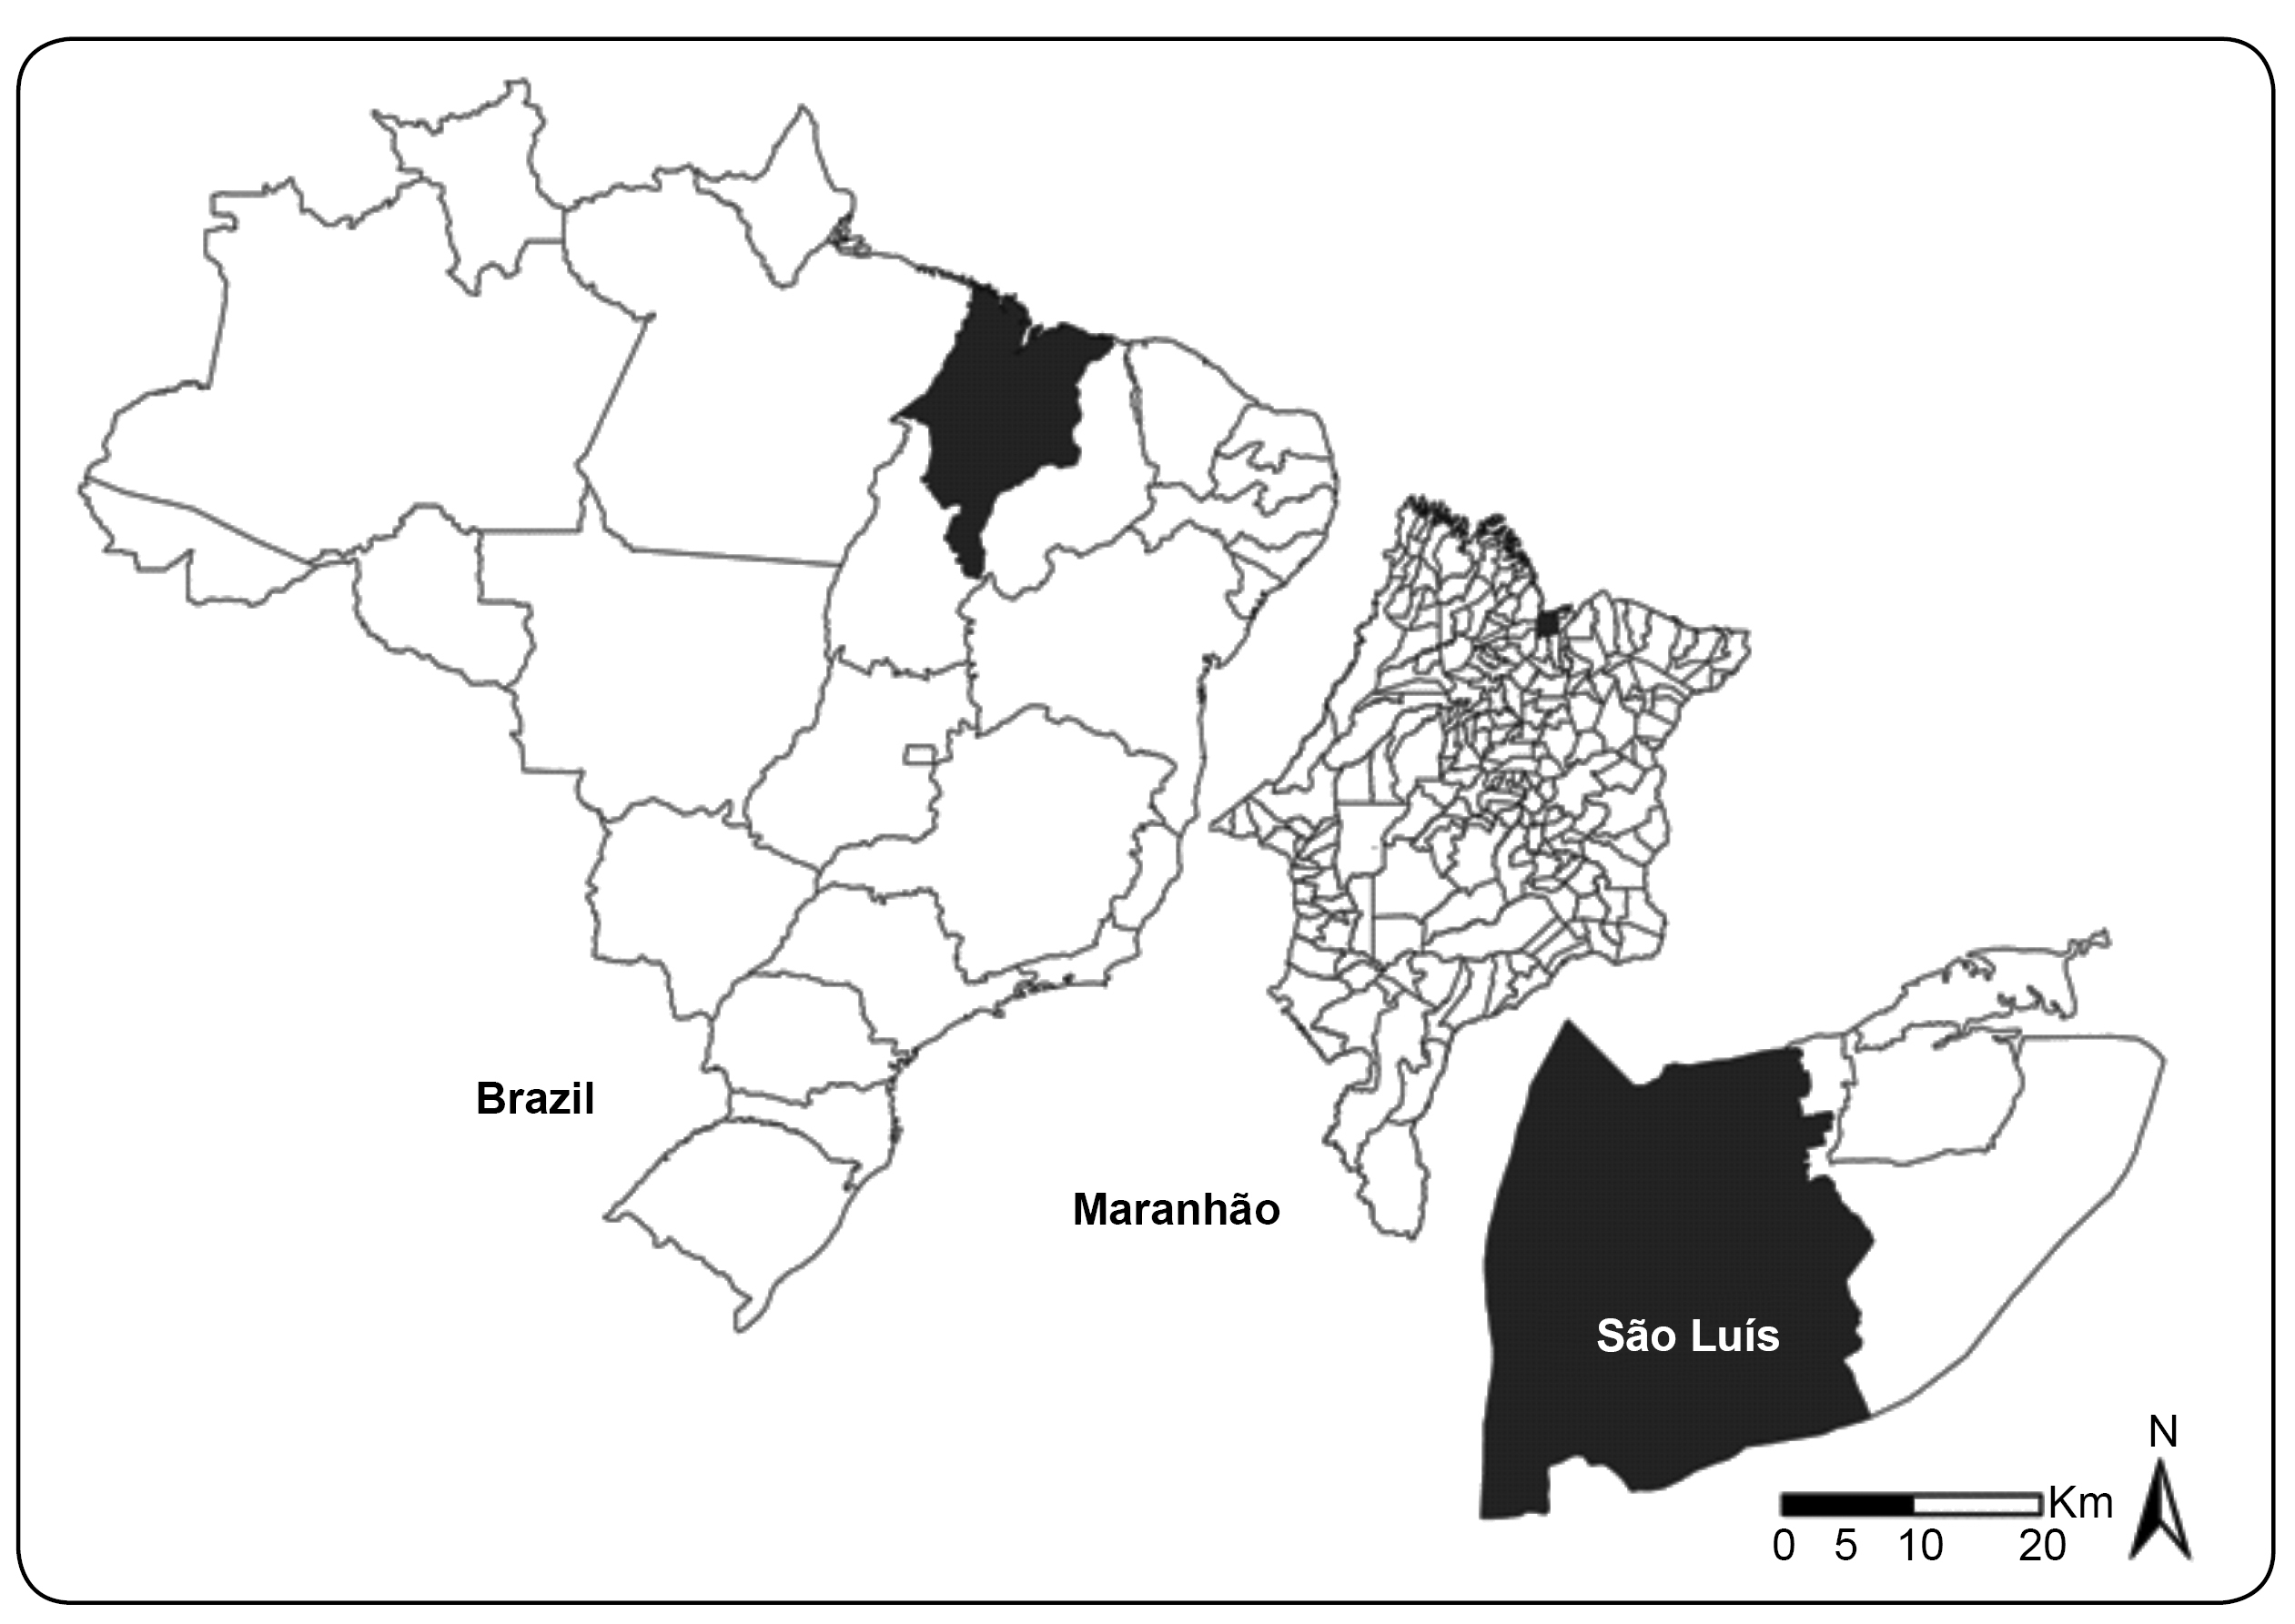
Ecological research was undertaken in the Cty of São Luis, the state capital of Maranhão, in the Northeast of Brazil.
Located in the north of the state, between the bays of São Marcos and São José de
Ribamar, on the Isle of Maranhão, popularly known as the Isle of São Luis, São Luis
(Figure 1)
(38)38 Instituto Brasileiro de Geografia e Estatística (IBGE) . Mapas: bases e
referenciais. Rio de Janeiro: IBGE, 2014. updated 2014 Jan 15 Avaiable at:
http://www.mapas.ibge.gov.br/bases-e-referenciais/bases-cartograficas/cartas/.
http://www.mapas.ibge.gov.br/bases-e-ref...
occupies the Western part of the Isle,
between the geographical coordinates 2° 31′ 51″latitude South and 44° 18′ 24″ longitude
West, with an area of 834.8km² and a population of 1,014,837 inhabitants(39)39 Instituto Brasileiro de Geografia e Estatística (IBGE) . Censo
Demográfico 2010. Rio de Janeiro: Cited 2013 Dez 27 IBGE, 2013 . Avaiable at:
http://www.cidades.ibge.gov.br/xtras/home.php/.
http://www.cidades.ibge.gov.br/xtras/hom...
.

Map of Brazil, highlighting the State of Maranhão and the City of São Luis. Source: Adapted from geographical bases(38)38 Instituto Brasileiro de Geografia e Estatística (IBGE) . Mapas: bases e referenciais. Rio de Janeiro: IBGE, 2014. updated 2014 Jan 15 Avaiable at: http://www.mapas.ibge.gov.br/bases-e-referenciais/bases-cartograficas/cartas/.
http://www.mapas.ibge.gov.br/bases-e-ref... .
Considered a priority city for TB control in Brazil, in 2012, São Luis had an incidence coefficient of 53.1/100,000 inhabitants and a mortality rate of 3.9 deaths/100,000 inhabitants(2)2 Malta DC, França E, Abreu DX, Oliveira H, Monteiro RA, Sardinha LMV, et al. Atualização da lista de causas de mortes evitáveis (5 a 74 anos de idade) por intervenções do Sistema Único de Saúde do Brasil. Epidemiol Serv Saude 2011; 20:409-412..
The study population consisted of cases that resulted in death among the population in the urban region of the city with PTB as the basic cause whose International Classification of Diseases (ICD)10 corresponded to A.15.0 to A.15.3 and A.16.0 to A.16.2 between 2008 and 2012.
The data were collected in July 2013 in the Mortality Information System (SIM) of the Superintendency of Epidemiological and Health Surveillance of the Municipal Health Department (SEMUS). Deaths of individuals living in other places and cases diagnosed as extra-PTB were excluded.
Initially, the geocoding of the cases (deaths by PTB) was processed in the TerraView version 4.2.2 software, wherein the addresses of the patients living in the urban region of São Luis/MA were standardized and aligned with a digital place segment map StreetBase(r) in Latlong projection/WGS84, available in the Shapefile extension purchased from the companyImagem Soluções de Inteligência Geográfica. In addition, the tool Batch Geocode (available from http://batchgeo.com/br/) was used for the death registers not located in the cartographic base, which looks for the address coordinates in Google Earth.
The cartographic base of the census sectors in São Luis was obtained on the website of
the Brazilian Institute of Geography and Statistics (IBGE) and consisted of 1,126
sectors, 1,052 of which were considered because they are located in the urban region of
the city and possess a resident population(39)39 Instituto Brasileiro de Geografia e Estatística (IBGE) . Censo
Demográfico 2010. Rio de Janeiro: Cited 2013 Dez 27 IBGE, 2013 . Avaiable at:
http://www.cidades.ibge.gov.br/xtras/home.php/.
http://www.cidades.ibge.gov.br/xtras/hom...
.
To detect space and space-time clusters of deaths by PTB, the census sector was used as an ecological analysis unit, with the advantage of being the most disaggregated form of the nationally standardized, systematical and periodically collected population and socioeconomic groups(40)40 Hino P, Villa TCS, Cunha TN,. Santos CB Padrões espaciais da tuberculose e sua associação à condição de vida no município de Ribeirão Preto. Cien Saude Coletiva 2011; 16:4795-4802..
The spatial analysis technique called scan, developed by Kulldorff and Nagarwalla(41)41 Kulldorf M, Nagarwalla N. Spatial disease clusters: Detection and inference. Stat Med 1995; 14:799-810., was used to detect clusters in space as well as in space and time.
The analysis technique departs from the null hypothesis (H0) that there is no cluster in the regions or areas of São Luis (all individuals in the population have the same probability of death by PTB) and from the alternative hypothesis (H1) that thez region is a cluster (individuals from a given area have a greater probability of death by TB than the others).
SaTScan 9.2 software was used to identify spatial clusters. As the events studied (deaths) are counts and rare in the population, Poisson's discrete model was used.The following conditions were adopted: no geographical overlapping of clusters, the maximum cluster size equals 50% of the population exposed, and the cluster has a circular form and 999 replications. It should be highlighted that, in this phase, the information about the year when the event occurred was not used.
In addition to permitting the spatial analysis, the scan statistics also permit the incorporation of the time factor, in which the simultaneous identification of event clusters(42)42 Lucena SEF, Moraes RM. Detecção de agrupamentos espaço-temporais para identificação de áreas de risco de homicídios por arma branca em João Pessoa, PB. Bol Ciênc Geod 2012; 18:605-623. (43)43 Coulston JW, Ritters KH. Geographic analysis of forest health indicators using spatial scan statistics. Environ Manage 2003; 31:764-773.in space and time is of interest. Therefore, SaTScan 9.2 software was also used to detect space-time clusters, in the same conditions as defined above for the spatial clusters, but considering a maximum time cluster size equal to 50% of the study period and a precise day, month and year with a time period between 2008 and 2012.
Both the space and the space-time scan techniques were processed by controlling the occurrence of deaths by the population size in the census sectors, by age and gender distribution, with attempts to detect high and low relative risk clusters. The significance test of the identified clusters was based on the comparison between the likelihood ratio test statistics against a null distribution obtained according to the Monte Carlo simulation(41)41 Kulldorf M, Nagarwalla N. Spatial disease clusters: Detection and inference. Stat Med 1995; 14:799-810..
The relative risk (RR), in turn, allows the comparison of information from distinct areas, standardizing and removing the effect of different populations, therefore showing the intensity of the occurrence of a given phenomenon with regard to all study regions(44)44 Medronho RA. Epidemiologia. Sao Paulo: Editora Atheneu; 2006..Thesignificance leveladopted was 5%. In addition, thematic maps were constructed, using ArcGIS 10.1 software, of the scan analyses that contained the RR of the obtained clusters.
Approval for the study was obtained from the Research Ethics Committee at EERP/USP, in compliance with the Guidelines and Regulatory Standards for Research Involving Human Beings, National Health Council Resolution 196/96, under Certificate of Submission for Ethical Evaluation number 12494113.0.0000.5393, issued on April 30th, 2013.
RESULTS
In the period between January 2008 and December 2012, 221 deaths by TB were registered, 193 of which were due to PTB. In this group, 190 (98.4%) records were observed with PTB as the basic cause, without any mention of bacteriological or histological confirmation (ICD 16.1). One (0.5%) death was caused by PTB with histological confirmation (ICD A15.2), and finally, one (0.5%) was classified as PTB with confirmation through a microscopic expectoration examination, with or without culture (ICD A15.0).
The geocoded percentage of deaths by PTB corresponded to 94.8% (183 deaths). In this group, 179 (98%) were geocoded using the cartographic base of addresses and TerraView software, and 4 (2%) were geocoded using the tool Batch Geocode. The losses that occurred in the geocoding process (n=10; 5%) were related to incomplete addresses in the SIM (n=4; 2%), street dwellers (n= 2; 1%) and addresses from the rural region of the city (n = 4; 2%).
The use of statistical space scan tools permitted thedetection of both spatial clusters as a significant space-time of deaths from PTB, controlled by age and size of the population in each census tract.
In the caseof spatial analysis, there were two significant spatial clusters of deaths by PTB ( Figure 2 ). Space cluster 1 (p-value<0.01) included 536 census sectors, a population of 491,490 inhabitants, a mortality rate of 5.8 deaths per 100,000 inhabitants per year and a relative risk of death by PTB equal to 3.87, a coefficient that is considered high. Space cluster 2 (p-value<0.01) involved 123 census sectors, a population of 102,403 inhabitants, a mortality rate of 0.4 deaths per 100,000 inhabitants per year and an RR of 0.10 (coefficient considered low), suggesting that living in this area protected individuals against death by
PTB in relation to the other census sectors of the city.

Space clusters of deaths by PTB, controlled by the population in the census sectors and their gender and age distribution. São Luis, State of Maranhão (2008-2012). RR: relative risk; PTB: pulmonary tuberculosis.
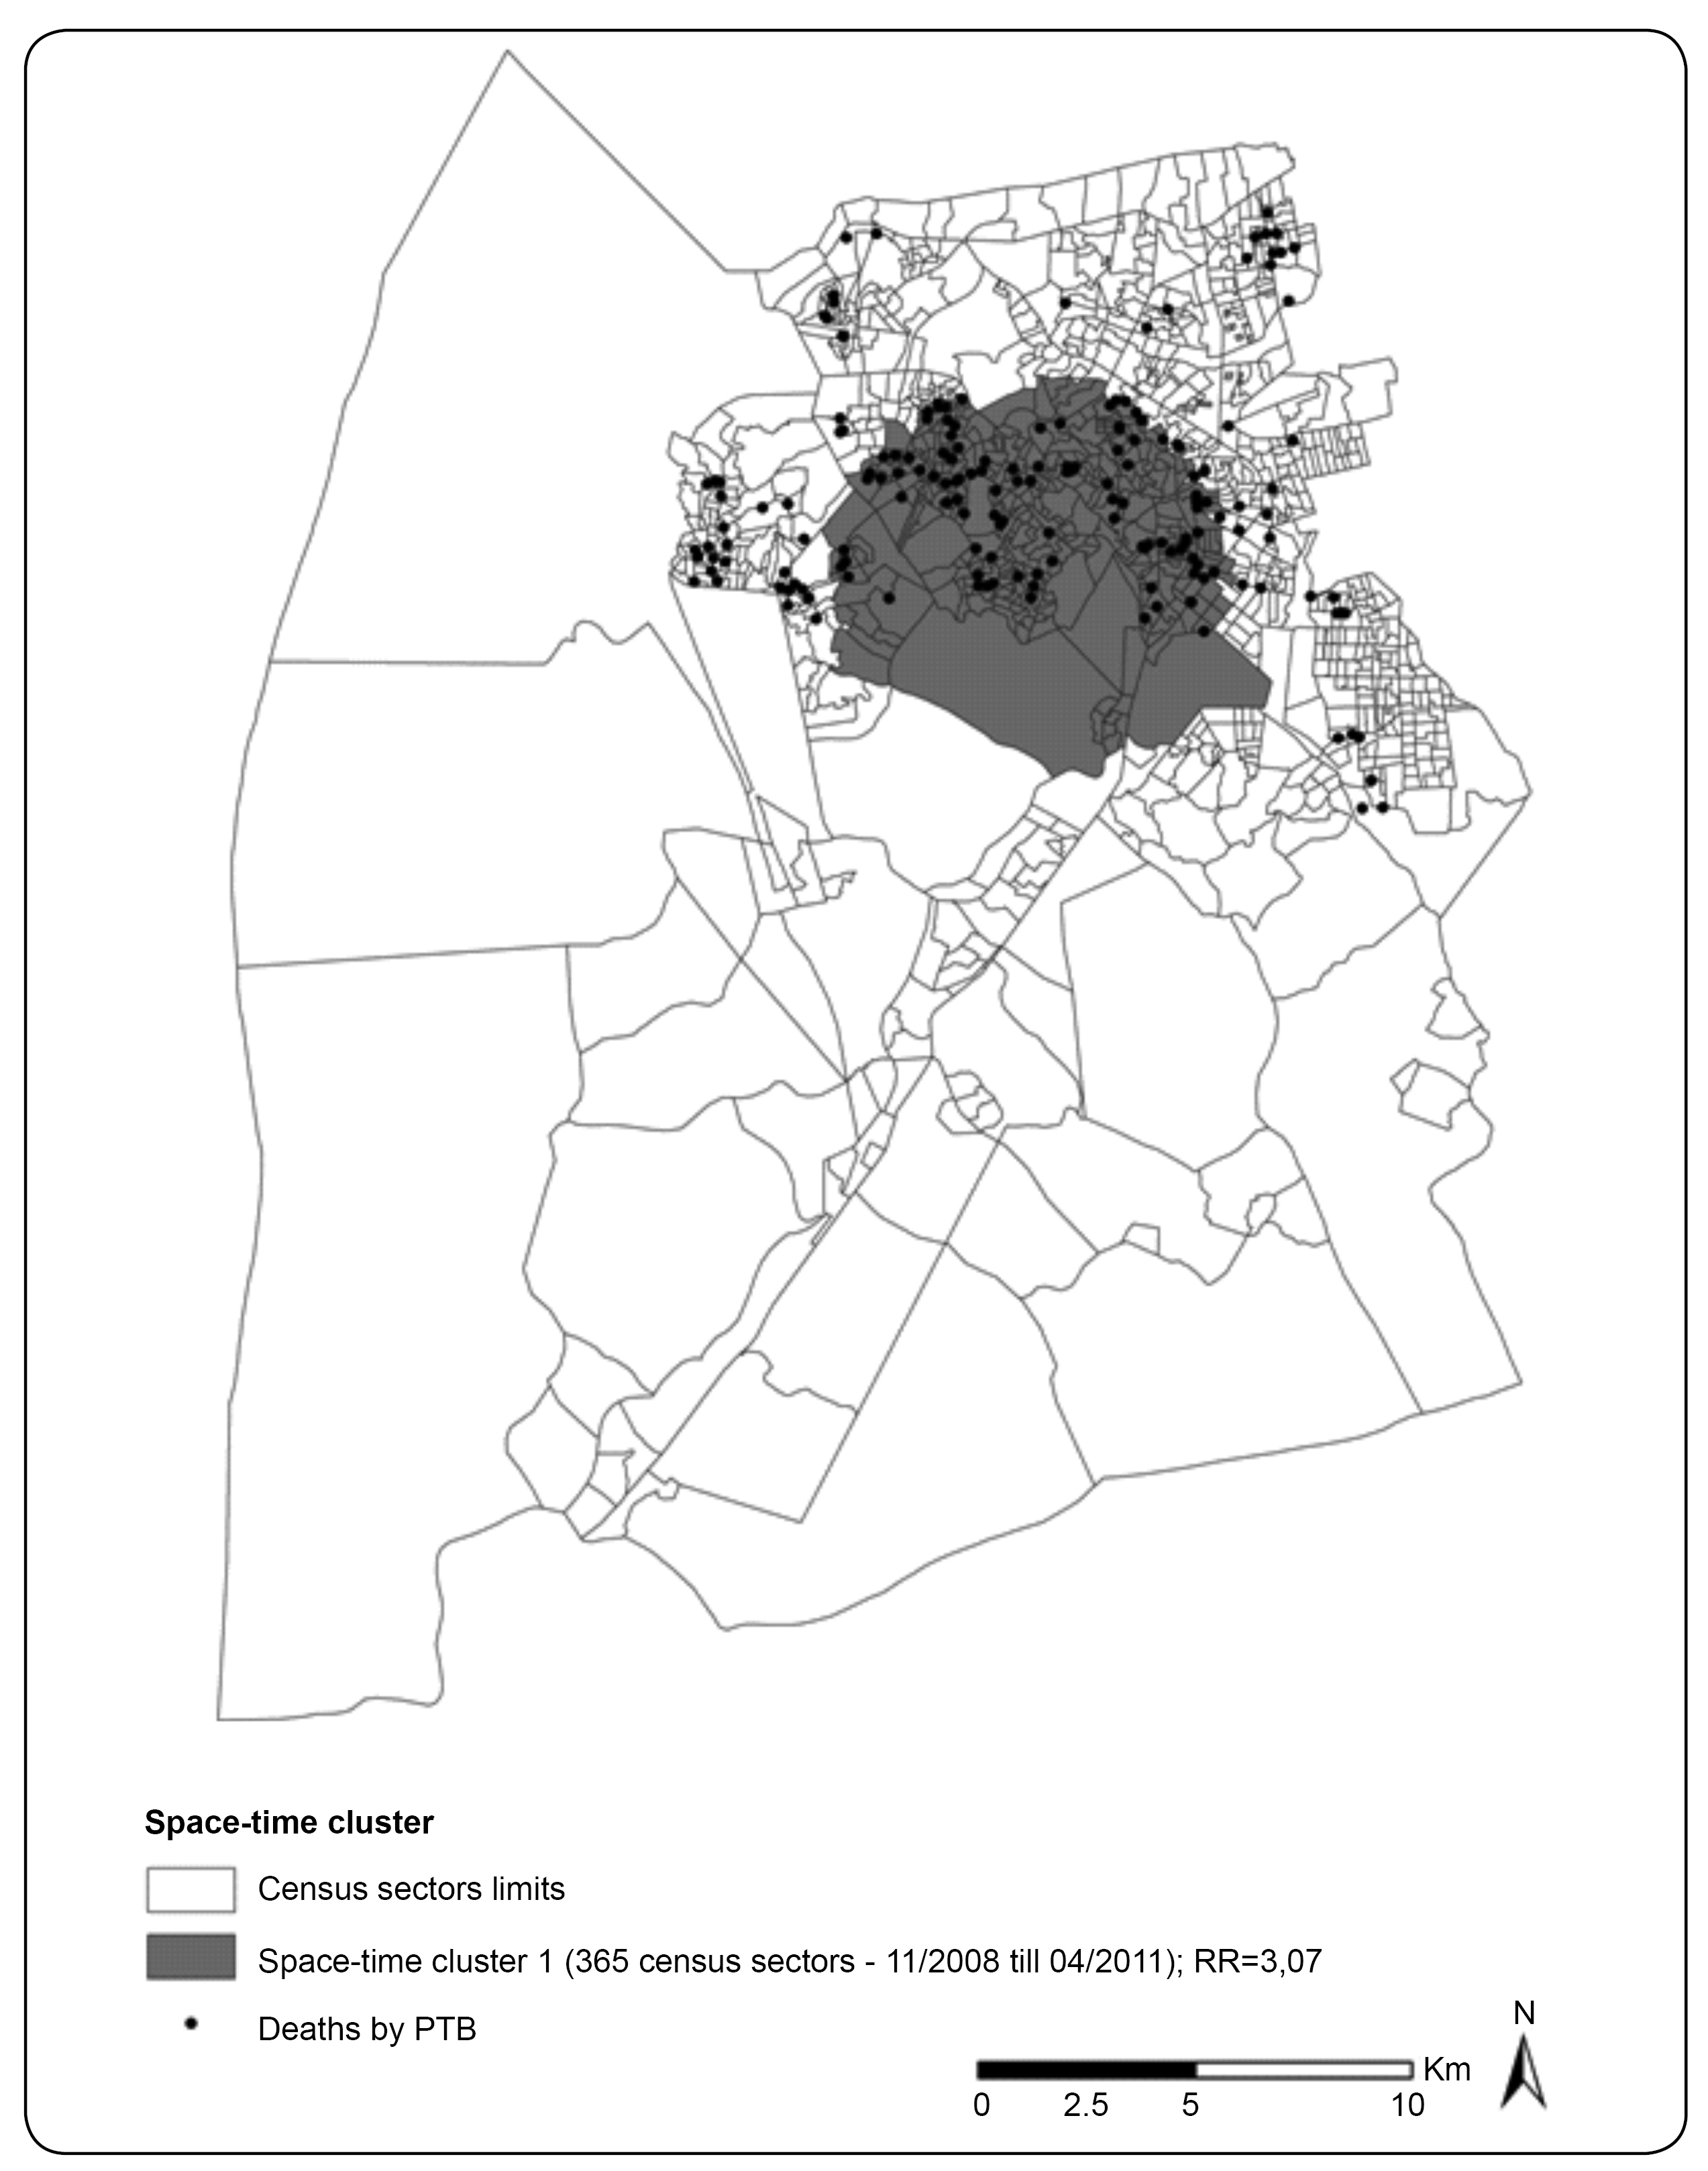
Regarding the space-time analysis of deaths by PTB, a significant cluster (p-value<0.01) was observed with 365 census sectors, a population of 331,728 inhabitants and a mortality rate of 8.10 deaths per 100,000 inhabitants per year, between 11/01/2008 and 04/30/2011. For the inhabitants in this cluster, the risk of dying of PTB was equivalent to 3.0 times the risk coefficient for the other study areas (high RR) ( Figure 3 ).

Space-time clusters of deaths by PTB, controlled by the population in the census sectors and their gender and age distribution. São Luis State of Maranhão, detected between November 2008 and April 2011. RR: relative risk; PTB: pulmonary tuberculosis.
DISCUSSION
Initially, many deaths were observed with PTB as the basic cause, without any mention of bacteriological or histological confirmation, similar to studies undertaken in Campo Grande, State of Mato Grosso do Sul(45)45 Espindola LCD. Estudo da mortalidade por tuberculose em Campo Grande - MS, 2001 a 2008. . : (Tese de Mestre) Escola Nacional de Saúde Pública; 2010. 44 p. and in the State of Rio de Janeiro(46)46 Selig L, Belo M, Cunha AJLA, Teixeira EG, Brito R, Luna AL, et al. Óbitos atribuídos à tuberculose no Estado do Rio de Janeiro. J Bras Pneumol2004; 30:417-424.. This result identifies a critical area that health services need to investigate in view of the possibility of false positives. The explanatory hypotheses for the research findings include the lack of registries of this information(47)47 Oliveira GP, Pinheiro RS, Coeli CM, Barreira D, Codenotti SB. Uso do sistema de informação sobre mortalidade para identificar subnotificação de casos de tuberculose no Brasil. Rev Bras Epidemiol2012; 15:468-477. and the non-prioritization of sputum smears in the hospital(48)48 Cecílio HPM, Fernandes CAM, Mathias TAF, Marcon SS. Perfil das internações e óbitos hospitalares por tuberculose. Acta Paulista de Enfermagem 2013; 26:250-255. .
Studies analyzing mortality rates by transmissible diseases reflect the inefficacy of prevention and control measures(49)49 Rede Interagencial de Informações para Saúde (RIPSA). Demografia e saúde: contribuição para análise de situação e tendências. Brasília: Organização Pan-Americana da Saúde; 2009. . It should also be remembered that this analysis is restricted whenever a high proportion of deaths occur without medical aid or by poorly defined causes2. This discussion is related to the importance of a health system that permits equal health service access and thus the timely diagnosis of TB cases, especially in Primary Health Care (PHC), which aims to reduce deaths. This implication suggests the importance of health actions changes that focus on specific groups and are sensitive to the reality evidenced in this study.
Only considering the health service organization in the analysis of deaths by PTB would mean rejecting determinant social and environmental aspects in the occurrence of PTB, considering that space strongly influences the behavior of this disease. Therefore, it is necessary to include the spatial distribution perspective in the analysis, integrating health data available in the health information systems with environmental and social data, based on the geographical information system(50)50 Barcellos C, Ramalho W. Situação atual do geoprocessamento e da análise de dados espaciais em saúde no Brasil. Informática Pública 2002; 4:221-230. (51)51 Ministério da Saúde. Secretaria de Vigilância em Saúde. Fundação Oswaldo Cruz. Abordagens espaciais na saúde pública. Brasília: Ministério da Saúde; 2006., thus permitting a better understanding of PTB deaths and their possible determinants.
The death geocoding results were satisfactory because they exceeded 90%. This percentage is considered of excellent quality when the data survey involves addresses, as incomplete data and incompatible addresses can cause an underestimation of the number of events in certain areas(27)27 Santos CB, Hino P, Cunha TN, Villa TCS, Muniz JN. Utilização de um sistema de informação geográfica para descrição dos casos de tuberculose. Bol Pneum Sanit2004; 12:5-10. . In this study, the quality of the address variable obtained from the SIM was fundamental to automatically locate most events, permitting analyses of the distribution patterns of deaths by PTB in space and in space-time.
With respect to the spatial scan technique, in São Luis, census sectors were identified that are prone to clusters of deaths by PTB in space and in space-time, confirming the areas identified in the Kernel analysis developed in an earlier study(29)29 Santos Neto M, Yamamura M, Garcia MCC, Popolin MP, Silveira TRS, Arcêncio RA. Análise espacial dos óbitos por tuberculose pulmonar em São Luis (MA). J Bras Pneumol2014; 40:543-551., which determined the hot areas in the city in which these deaths occurred with rates ranging between 0 and 8.12 deaths per km2.
These analyses also permitted the stratification of the city into high- and low-risk areas, permitting the visualization of space and space-time clusters that can outline homogeneous areas, measure the risk of deaths by PTB and monitor them in time and space, minimizing possible damage to the exposed population(52)52 Bavia ME, Carneiro DDMT, Gurgel HC, Madureira Fº C, Barbosa MGR. Remote sensing and geographic information system and risk of American Visceral Leishmaiasis in Bahia, Brazil. Parasitol 2005; 47:165-169. (53)53 Clements ACA, Lwambo NJS, Blair L, Nyandindi U, Kaatano G, Kinung'hi S, et al. Bayesian spatial analysis and disease mapping: tools to enhance planning and implementation of a schistosomiasis control programme in Tanzania. Trop Med Int Health 2006; 11: 490-503. and suggesting improvements in health surveillance actions.
Considering the current urban growth process, the capital of Maranhão has produced new areas built for growing populations. This change has led to the continuous residence of low-income and poorly educated populations in peripheral areas that completely lack infrastructure and show greater socioeconomic vulnerability(54)54 Rodrigues ZMR. Sistema de indicadores e desigualdade socioambiental intraurbana de São Luis-MA, Brasil. Revista Geogr Am Centr 2011; 2:1-15..
In a study by Pereira, Cutrim Júnior and Rodrigues(55)55 Pereira PRM, Cutrim Júnior V,. Rodrigues ZMR Desigualdades intraurbanas dos indicadores de saneamento em São Luis - MA. In: VIJornada Internacional de Políticas Públicas, 2013, São Luis. Resumos. São Luis: UFMA; 2013. p. 1-10., which aimed to analyze indicators of the intra-urban habitability conditions in São Luis/MA and highlight its internal inequalities, neighborhoods with the worst percentages were shown to be concentrated in the peripheral areas of São Luis, especially the neighborhoods of Coroadinho, Bairro de Fátima, Sacavém, Anil, Santo Antonio, Vila Luizão, Vila Embratel, Sá Viana, and Divinéia and areas of Cidade Operária. The authors also noted that urban growth without previous planning resulted in areas that are considered subnormal, revealing social inequities in the state capital. These places coincide exactly to the census sectors that showed a high relative risk of death by PTB in the space and space-time analysis.
The analysis of the mortality rates found in the high-risk space and space-time clusters during the analysis period showed rates superior to the Brazilian average(56)56 Carneiro de Oliveira D, Salgado Barreira A, Taracido Trunk M, Figueias Guzmán A. Impact of socioeconomic inequities on the mortality of the City of Fortaleza, Ceara, Brazil during 2007. Rev Esp Salud Publica 2010; 84:443-452.. Therefore, the larger number of deaths by PTB in certain regions of the city justifies the intensification of the search for respiratory symptoms with goals of early detection, the establishment of treatment and the achievement of cures.
The space cluster of low relative risk detected in the space analysis showed a mortality rate by PTB below the national average. These census sectors with a lower density of cases per km2 belonged to the neighborhoods of Cohab, Itapiracó and Cohatrac(29)29 Santos Neto M, Yamamura M, Garcia MCC, Popolin MP, Silveira TRS, Arcêncio RA. Análise espacial dos óbitos por tuberculose pulmonar em São Luis (MA). J Bras Pneumol2014; 40:543-551.. However, clusters with a lower than expected mortality rate can indicate underreported deaths, an important problem that Brazil needs to overcome.
Furthermore, populations in unfavorable socioeconomic situations have higher mortality rates than those in better living conditions(56)56 Carneiro de Oliveira D, Salgado Barreira A, Taracido Trunk M, Figueias Guzmán A. Impact of socioeconomic inequities on the mortality of the City of Fortaleza, Ceara, Brazil during 2007. Rev Esp Salud Publica 2010; 84:443-452. (57)57 Choi M-H, Cheong K-S, Cho B-M, Hwang I-K, Kim C-H, Kim M-H, et al. Deprivation and mortality at the town level in Busan, Korea: an ecological study. J Prev Med Public Health 2011; 44:242-248. (58)58 McCartney D, Scarborough P, Webster P, Rayner M. Trends in social inequalities for premature coronary heart disease mortality in Great Britain, 1994-2008: a time trend ecological study. BMJ Open 2012; 2:1-8. (59)59 Núñez N. Perfiles diferenciales de mortalidadsegún condiciones de vida. Venezuela 1983 y 1990. Gac Méd Caracas 1997; 105:189-201., revealing differences in the epidemiological profiles among different regions and social groups. Therefore, it is necessary to analyze whether these events are closely related to social indicators, which requires further research.
Curtis(35)35 Curtis S. Health and Inequality: Geographical Perspectives. London: Sage Publications; 2004., in turn, indicates that areas lacking dignified housing and basic sanitation tend to experience health services with low problem-solving abilities and limitations in the service supply and range. Although the health service network in São Luis was not investigated in this study, there are reasons to believe that PTB deaths are related to the areas in which the patients lived and the health systems and services present there.
Moreover, Barreto and Carmo(60)60 Barreto ML, Carmo EH. Padrões de adoecimento e de morte da população brasileira: os renovados desafios para o Sistema Único de Saúde.Cien Saude Coletiva 2007; 12 (supl): 1179-1790. affirm that the lower a social group's social and economic level, the higher is the frequency of any disease, with rare exceptions. The same authors add that among places with similar economic levels, those with higher social inequity have lower health levels, and modest improvements in the pattern of these inequities strongly affect the populations' health.
Thus, the results demonstrate the need to redirect public policies in an attempt to better adapt investments in poorer urban regions through progress in the supply of public services, implementation of social inclusion programs, qualification programs for the job market and better housing conditions.
The existence of confounding variables that are hard to control is one research limitation, which was related to the type of study. In addition, the ecological fallacy should be highlighted in which no causal inferences are possible at the individual level. In addition, when excluded, incomplete or missing secondary data could also result in some research bias.
The space and space-time scan statistics applied in this study undoubtedly contributed to the identification of geographic areas in which deaths occurred due to PTB and which therefore need further preventive or curative attention, with an aim of reorganizing health services to attend to the population's health needs and reduce the social inequities in access to health services.
Finally, the knowledge of priority sites for the occurrence of deaths, as demonstrated in this study, can help reduce the social inequities in healthcare by permitting the optimization of PTB control resources and teams, offering support for the choice of specific strategies and interventions focused on the most vulnerable populations.
ACKNOWLEDGMENTS
We acknowledge the Superintendency of Epidemiological and Health Surveillance of the Municipal Health Department of São Luis (MA) for the authorization to develop this research and for providing the data.
-
1World Health Organization (WHO). Global tuberculosis report 2013. Geneva: WHO; 2013.
-
2Malta DC, França E, Abreu DX, Oliveira H, Monteiro RA, Sardinha LMV, et al. Atualização da lista de causas de mortes evitáveis (5 a 74 anos de idade) por intervenções do Sistema Único de Saúde do Brasil. Epidemiol Serv Saude 2011; 20:409-412.
-
3Ministério da Saúde. Secretaria Executiva. Departamento de Informática do SUS (DATASUS).Cited 2014 January 10 2014. . Avaiable at: http://www.datasus.saude.gov.br/.
» http://www.datasus.saude.gov.br/. -
4San Pedro A, Oliveira RM. Tuberculose e indicadores socioeconômicos: revisão sistemática da literatura. Rev Panam Salud Pública 2013; 33:294-301.
-
5Teixeira GM. Aprofundar o conhecimento espacial da tuberculose para melhor combatê-la. Bol Pneum Sanit 2004; 12:141-143.
-
6Shah L, Choi W, Berrang-Ford L, Henostroza G, Krapp F, Zamudio C, et al. Geographic predictors of primary multidrug-resistant tuberculosis cases in an endemic area of Lima, Peru Int J Tuberc Lung Dis 2014; 18:1307-1314.
-
7Alvarez-Hernandez G, Lara-Valencia F, Reyes-Castro PA, Rascon-Pacheco RA. An analysis of spatial and socio-economic determinants of tuberculosis in Hermosillo, Mexico, 2000-2006 Int J Tuberc Lung Dis2010; 14:708-713.
-
8Bai J, Zou G, Mu S, Ma Y. Using Spatial Analysis to Identify Tuberculosis Transmission and Surveillance. Computer Engineering and Networking, Lecture Notes in Electrical Engineering 2014; 277:337-344.
-
9Zaragoza Bastida A, Hernandez Tellez M, Bustamante Montes LP, Medina T, Jaramillo Paniagua JN, Mendoza Martínez GD, et al. Spatial and Temporal Distribution of Tuberculosis in the State of Mexico, Mexico Scientific World J 2012; 12:1-7.
-
10Jenkins HE, Plesca V, Ciobanu A, Crudu V, Galusca I, Soltan V, et al. Assessing spatial heterogeneity of multidrug-resistant tuberculosis in a high-burden country. Eur Respir J 2013; 42:1291-1301.
-
11Li X-X, Wang L-X, Zhang J, Liu Y-X, Zhang H, Jiang S-W, et al. Exploration of ecological factors related to the spatial heterogeneity of tuberculosis prevalence in P. R. China. Glob Health Action 2014; 7:1-12
-
12Murray EJ, Marais BJ, Mans G, Beyers N, Ayles H, Godfrey-Faussett P, et al. A multidisciplinary method to map potential tuberculosis transmission 'hot spots' in high-burden communities. Int J Tuberc Lung Dis2009; 13:767-774.
-
13Randremanana RV, Richard V, Rakotomanana F, Sabatier P, Bicout DJ. Bayesian mapping of pulmonar tuberculosis in Antananarivo, Madagascar. BMC Infectious Diseases 2010; 10:1-10.
-
14Tiwari N, Adhikari CMS, Tewari A, Kandpal V. Investigation of geo-spatial hotspots for the occurrence of tuberculosis in Almora district, India, using GIS and spatial scan statistic. Int J Health Geog 2006; 5:1-11.
-
15Tiwaria N, Kandpalb V, Tewaric A, Mohan Raod KR, Toliae VS. Investigation of tuberculosis clusters in Dehradun city of India. Asian Pacific J Trop Med 2010; 3:486-490.
-
16Touray K, Adetifa IM, Jallow A, Rigby J, Jeffries D, Cheung YB, et al. Spatial analysis of tuberculosis in an urban West African setting: is there evidence of clustering? Tropical Med Int Health 2010; 15:664-672.
-
17Wang T, Xue F, Chen Y, Yunbo Ma Y, Liu Y. The spatial epidemiology of tuberculosis in Linyi City, China, 2005-2010. BMC Public Health 2012; 12:1-8.
-
18Guimarães RB, Ribeiro H. O tratamento cartográfico da informação em saúde do trabalhador. Rev Bras Epidemiol 2010; 13:577-586.
-
19Araújo KMFA, Figueiredo TMRM, Gomes LCF, Pinto ML, Silva TC, Bertolozzi MR. Evolução da distribuição espacial dos casos novos de tuberculose no município de Patos (PB), 2001-2010. Cad Saude Coletiva 2013; 21:296-302.
-
20Barbosa IR, Pereira LMS, Medeiros PFM, Valentim RS, Brito JM, Costa ICC. Análise da distribuição espacial da tuberculose na Região Nordeste do Brasil, 2005-2010. Epidemiol Serv Saude2013; 22:687-695.
-
21Barroso CMR, Ferreira Neto JV. Análise do padrão de distribuição espacial dos casos de tuberculose em Arapiraca/AL, período 2000-2005. Revista Reflexões e Práticas Geográficas 2014; 1:1-15.
-
22Daronco A, Borges TS, Sonda EC, Lutz B, Rauber A, Battisti F, et al. Distribuição espacial de casos de tuberculose em Santa Cruz do Sul, município prioritário do Estado do Rio Grande do Sul, Brasil, 2000-2010. Epidemiol Serv Saude2012; 21:645-654.
-
23Hino P, Santos CB, Villa TCS. Evolução espaço-temporal dos casos de tuberculose em Ribeirão Preto (SP), nos anos de 1998-2002. J Bras Pneumol 2005; 31:523-527.
-
24Melo TEMP, Resendes APC, Souza-Santos R, Basta PC. Distribuição espacial e temporal da tuberculose em indígenas e não indígenas de Rondônia, Amazônia Ocidental, Brasil. Cad Saude Publica 2012; 28:267-280.
-
25Roza DL. Padrões espaço-temporais da incidência da tuberculose em Ribeirão Preto, SP: uso de um modelo bayesiano auto regressivo condicional.Faculdade de Medicina de Ribeirão Preto, Universidade de São Paulo, Ribeirao Preto; 2011.115 p.
-
26Sales CMM, Figueiredo TAM, Zandonade E, Maciel ELN. Análise espacial da tuberculose infantil no Estado do Espírito Santo, 2000 a 2007. Rev Soc Bras Med Trop 2010; 43:435-439.
-
27Santos CB, Hino P, Cunha TN, Villa TCS, Muniz JN. Utilização de um sistema de informação geográfica para descrição dos casos de tuberculose. Bol Pneum Sanit2004; 12:5-10.
-
28Vieira RCA, Prado TN, Siqueira MG, Dietze R,. Maciel ELN Distribuição espacial dos casos novos de tuberculose em Vitória, Estado do Espírito Santo, no período entre 2000 e 2005. Rev Soc Bras Med Trop2008; 41:82-86.
-
29Santos Neto M, Yamamura M, Garcia MCC, Popolin MP, Silveira TRS, Arcêncio RA. Análise espacial dos óbitos por tuberculose pulmonar em São Luis (MA). J Bras Pneumol2014; 40:543-551.
-
30Mota FF, Vieira-da-Silva LM, Paim JS, Costa MCN. Distribuição espacial da mortalidade por tuberculose em Salvador, Bahia, Brasil. Cad Saude Publica2003; 19:915-922.
-
31Vicentin G, Santo AH, Carvalho MS. Mortalidade por tuberculose e indicadores sociais no município do Rio de Janeiro. Cien Saude Colet 2002; 7:253-263.
-
32World Health Organization (WHO). Global tuberculosis report, 2014. WHO/HMT/TB/2014.08. Geneva: WHO; 2014.
-
33Selig L, Kritski AL, Cascão AM, Braga JU, Trajman A, Carvalho RMG. Proposta de vigilância de óbitos por tuberculose em sistemas de informação. Rev Saude Publica 2010; 44:1072-1078.
-
34Sousa LMO, Pinheiro RS. Óbitos e internações por tuberculose não notificados no município do Rio de Janeiro. Rev Saude Publica2011; 45:31-39.
-
35Curtis S. Health and Inequality: Geographical Perspectives. London: Sage Publications; 2004.
-
36Álvarez JL, Kunst AE, Leinsalu M, Bopp M, Strand BH, Menvielle G, et al. Educational inequalities in tuberculosis mortality in sixteen European populations. Int J Tuberc Lung Dis2011; 15:1461-1467.
-
37Gondim GMM. Do Conceito de Risco ao da Precaução: entre determinismos e incertezas. In: Fonseca AF, Corbo AMA, editors. O territorio e o processo saude-doença. Rio de Janeiro: EPSJV/FIOCRUZ; 2007.
-
38Instituto Brasileiro de Geografia e Estatística (IBGE) . Mapas: bases e referenciais. Rio de Janeiro: IBGE, 2014. updated 2014 Jan 15 Avaiable at: http://www.mapas.ibge.gov.br/bases-e-referenciais/bases-cartograficas/cartas/.
» http://www.mapas.ibge.gov.br/bases-e-referenciais/bases-cartograficas/cartas/ -
39Instituto Brasileiro de Geografia e Estatística (IBGE) . Censo Demográfico 2010. Rio de Janeiro: Cited 2013 Dez 27 IBGE, 2013 . Avaiable at: http://www.cidades.ibge.gov.br/xtras/home.php/.
» http://www.cidades.ibge.gov.br/xtras/home.php/ -
40Hino P, Villa TCS, Cunha TN,. Santos CB Padrões espaciais da tuberculose e sua associação à condição de vida no município de Ribeirão Preto. Cien Saude Coletiva 2011; 16:4795-4802.
-
41Kulldorf M, Nagarwalla N. Spatial disease clusters: Detection and inference. Stat Med 1995; 14:799-810.
-
42Lucena SEF, Moraes RM. Detecção de agrupamentos espaço-temporais para identificação de áreas de risco de homicídios por arma branca em João Pessoa, PB. Bol Ciênc Geod 2012; 18:605-623.
-
43Coulston JW, Ritters KH. Geographic analysis of forest health indicators using spatial scan statistics. Environ Manage 2003; 31:764-773.
-
44Medronho RA. Epidemiologia. Sao Paulo: Editora Atheneu; 2006.
-
45Espindola LCD. Estudo da mortalidade por tuberculose em Campo Grande - MS, 2001 a 2008. . : (Tese de Mestre) Escola Nacional de Saúde Pública; 2010. 44 p.
-
46Selig L, Belo M, Cunha AJLA, Teixeira EG, Brito R, Luna AL, et al. Óbitos atribuídos à tuberculose no Estado do Rio de Janeiro. J Bras Pneumol2004; 30:417-424.
-
47Oliveira GP, Pinheiro RS, Coeli CM, Barreira D, Codenotti SB. Uso do sistema de informação sobre mortalidade para identificar subnotificação de casos de tuberculose no Brasil. Rev Bras Epidemiol2012; 15:468-477.
-
48Cecílio HPM, Fernandes CAM, Mathias TAF, Marcon SS. Perfil das internações e óbitos hospitalares por tuberculose. Acta Paulista de Enfermagem 2013; 26:250-255.
-
49Rede Interagencial de Informações para Saúde (RIPSA). Demografia e saúde: contribuição para análise de situação e tendências. Brasília: Organização Pan-Americana da Saúde; 2009.
-
50Barcellos C, Ramalho W. Situação atual do geoprocessamento e da análise de dados espaciais em saúde no Brasil. Informática Pública 2002; 4:221-230.
-
51Ministério da Saúde. Secretaria de Vigilância em Saúde. Fundação Oswaldo Cruz. Abordagens espaciais na saúde pública. Brasília: Ministério da Saúde; 2006.
-
52Bavia ME, Carneiro DDMT, Gurgel HC, Madureira Fº C, Barbosa MGR. Remote sensing and geographic information system and risk of American Visceral Leishmaiasis in Bahia, Brazil. Parasitol 2005; 47:165-169.
-
53Clements ACA, Lwambo NJS, Blair L, Nyandindi U, Kaatano G, Kinung'hi S, et al. Bayesian spatial analysis and disease mapping: tools to enhance planning and implementation of a schistosomiasis control programme in Tanzania. Trop Med Int Health 2006; 11: 490-503.
-
54Rodrigues ZMR. Sistema de indicadores e desigualdade socioambiental intraurbana de São Luis-MA, Brasil. Revista Geogr Am Centr 2011; 2:1-15.
-
55Pereira PRM, Cutrim Júnior V,. Rodrigues ZMR Desigualdades intraurbanas dos indicadores de saneamento em São Luis - MA. In: VIJornada Internacional de Políticas Públicas, 2013, São Luis. Resumos. São Luis: UFMA; 2013. p. 1-10.
-
56Carneiro de Oliveira D, Salgado Barreira A, Taracido Trunk M, Figueias Guzmán A. Impact of socioeconomic inequities on the mortality of the City of Fortaleza, Ceara, Brazil during 2007. Rev Esp Salud Publica 2010; 84:443-452.
-
57Choi M-H, Cheong K-S, Cho B-M, Hwang I-K, Kim C-H, Kim M-H, et al. Deprivation and mortality at the town level in Busan, Korea: an ecological study. J Prev Med Public Health 2011; 44:242-248.
-
58McCartney D, Scarborough P, Webster P, Rayner M. Trends in social inequalities for premature coronary heart disease mortality in Great Britain, 1994-2008: a time trend ecological study. BMJ Open 2012; 2:1-8.
-
59Núñez N. Perfiles diferenciales de mortalidadsegún condiciones de vida. Venezuela 1983 y 1990. Gac Méd Caracas 1997; 105:189-201.
-
60Barreto ML, Carmo EH. Padrões de adoecimento e de morte da população brasileira: os renovados desafios para o Sistema Único de Saúde.Cien Saude Coletiva 2007; 12 (supl): 1179-1790.
-
Fundação de Amparo à Pesquisa do Estado de São Paulo (FAPESP) Grant # 13/03756-9 and Coordenação de Aperfeiçoamento de Pessoal de Nível Superior (CAPES).
Publication Dates
-
Publication in this collection
Feb 2015
History
-
Received
28 Nov 2014 -
Accepted
10 Feb 2015