Abstracts
This is a comparative study between manual volumetry (MV) and voxel based morphometry (VBM) as methods of evaluating the volume of brain structures in magnetic resonance images. The volumes of the hippocampus and the amygdala of 16 panic disorder patients and 16 healthy controls measured through MV were correlated with the volumes of gray matter estimated by optimized modulated VBM. The chosen structures are composed almost exclusively of gray matter. Using a 4 mm Gaussian filter, statistically significant clusters were found bilaterally in the hippocampus and in the right amygdala in the statistical parametric map correlating with the respective manual volume. With the conventional 12 mm filter,a significant correlation was found only for the right hippocampus. Therefore,narrowfilters increase the sensitivity of the correlation procedure, especially when small brain structures are analyzed. The two techniques seem to consistently measure structural volume.
magnetic resonance imaging; manual volumetry; voxel based morphometry
Trata-se de estudo comparativo entre a volumetria manual(VM) e a morfometria baseada no vóxel (MBV), como métodos de avaliação do volume de estruturas cerebrais. Os volumes do hipocampo e da amídala de 16 pacientes de pânico e 16 controles sadios medidos através da VM foram correlacionados com os volumes de matéria cinzenta estimados pela MBV.As estruturas escolhidas são constituídas quase exclusivamente de matéria cinzenta. Utilizando um filtro Gaussiano de 4 mm, encontram-se, bilateralmente, aglomerados significativos de correlação nas duas estruturas no mapa estatístico paramétrico, correspondendo ao respectivo volume manual. Com o filtro convencional de 12 mm, apenas uma correlação significativa foi encontrada no hipocampo direito. Portanto, filtros estreitos aumentam a sensibilidade do procedimento de correlação,especialmente quando estruturas pequenas são analisadas. Ambas as técnicas parecem medir consistentemente o volume estrutural.
imagens de ressonância magnética; volumetria manual; morfometria baseada no vóxel
BIOMEDICAL AND MEDICAL SCIENCES
Correlation between voxel based morphometry and manual volumetry in magnetic resonance images of the human brain
Ricardo R. UchidaI, IV; Cristina M. Del-BenI; David AraújoII; Geraldo Busatto-FilhoIII; Fábio L.S. DuranIII; José A.S. CrippaI; Frederico G. GraeffI
IDivisão de Psiquiatria, Faculdade de Medicina de Ribeirão Preto, Universidade de São Paulo, FMRPUSP Hospital das Clínicas, 3° andar, Av. dos Bandeirantes, 3900, 14049-900 Ribeirão Preto, SP, Brasil
IIDivisão de Neurologia, Faculdade de Medicina de Ribeirão Preto, Universidade de São Paulo, FMRPUSP Hospital das Clínicas, 4° andar, Av. dos Bandeirantes, 3900, 14049-900 Ribeirão Preto, SP, Brasil
IIIDepartamento de Psiquiatria, Faculdade de Medicina, Universidade de São Paulo, FMUSP Rua Dr. Ovídio Pires de Campos, 785, 01060-970 São Paulo, SP, Brasil
IVFaculdade de Ciências Médicas da Santa Casa de São Paulo, FCMSCSP Rua Major Maragliano, 241, 06754-020 São Paulo, SP, Brasil
Correspondence to Correspondence to: Prof. Frederico G. Graeff E-mail: hegog@hotmail.com
ABSTRACT
This is a comparative study between manual volumetry (MV) and voxel based morphometry (VBM) as methods of evaluating the volume of brain structures in magnetic resonance images. The volumes of the hippocampus and the amygdala of 16 panic disorder patients and 16 healthy controls measured through MV were correlated with the volumes of gray matter estimated by optimized modulated VBM. The chosen structures are composed almost exclusively of gray matter. Using a 4 mm Gaussian filter, statistically significant clusters were found bilaterally in the hippocampus and in the right amygdala in the statistical parametric map correlating with the respective manual volume. With the conventional 12 mm filter,a significant correlation was found only for the right hippocampus. Therefore,narrowfilters increase the sensitivity of the correlation procedure, especially when small brain structures are analyzed. The two techniques seem to consistently measure structural volume.
Key words: magnetic resonance imaging, manual volumetry, voxel based morphometry.
RESUMO
Trata-se de estudo comparativo entre a volumetria manual(VM) e a morfometria baseada no vóxel (MBV), como métodos de avaliação do volume de estruturas cerebrais. Os volumes do hipocampo e da amídala de 16 pacientes de pânico e 16 controles sadios medidos através da VM foram correlacionados com os volumes de matéria cinzenta estimados pela MBV.As estruturas escolhidas são constituídas quase exclusivamente de matéria cinzenta. Utilizando um filtro Gaussiano de 4 mm, encontram-se, bilateralmente, aglomerados significativos de correlação nas duas estruturas no mapa estatístico paramétrico, correspondendo ao respectivo volume manual. Com o filtro convencional de 12 mm, apenas uma correlação significativa foi encontrada no hipocampo direito. Portanto, filtros estreitos aumentam a sensibilidade do procedimento de correlação,especialmente quando estruturas pequenas são analisadas. Ambas as técnicas parecem medir consistentemente o volume estrutural.
Palavras-chave: imagens de ressonância magnética, volumetria manual, morfometria baseada no vóxel.
INTRODUCTION
Structural studies with magnetic resonance imaging(MRI) of the brain increasingly use the automatedmethod of segmentation known as voxel based morphometry (VBM). The VBM technique allows the investigation of differences in regional volumes along the whole brain. Structural MRI scans are spatially normalized to an anatomical template, and segmented into gray matter, white matter and cerebrospinal fluid (CSF) compartments (Ashburner and Friston 2000). Subsequently, between-group comparisons are performed at each brain voxel and statistical parametric maps (SPMs) are produced in stereotactic space showing the locations where significant group differences are detected.
An alternative procedure for measuring the size of brain structures is manual volumetry (MV), which is time-consuming and does not allow segmentation between grey and white matter. MV can only be performed in regions of interest (ROI) and, as a consequence, there is the need of defining anatomical borders a priori. In addition, there is intra and inter-rater variability in the measurements (Wright et al. 1995, Ashburner and Friston 2000). In spite of these shortcomings, MV has the advantage of being a more direct measurement with clear face validity.
So far, few studies have compared VBM with MV. Some studies have obtained concordant results (Maguire et al. 2000, Keller et al. 2002, Kubicki et al. 2002), whereas others have shown inconsistency between the two methods (Good et al. 2002, Job et al. 2002, 2003). A possible reason for such discrepancies may be methodological. For instance, the studies which got the best concordance between the two procedures (Maguire et al. 2000, Kubicki et al. 2002) used a relatively narrow Gaussian filter. The latter device smoothes the image borders and normalizes image parameters by taking into account the influence of neighbor voxels. The full width at half maximum (FWHM), in mm, measures the filter width, and represents the diameter of the space that influences the voxel values after smoothing (Ashburner and Friston 2000). Another factor that increases accuracy is optimization, which consists in the creation of study-specific templates of brain images, together with modulation, an additional step that allows the evaluation of gray matter or white matter volume, rather than mere density (Good et al. 2001, Lochhead et al. 2004).
Since we have previously carried out two studies comparing MR images of panic disorder patients with those of healthy controls, one using MV (Uchida et al. 2003) and the other VBM (Uchida et al. in press), there is the opportunity of analyzing the images of the same participants by the two procedures. As a consequence, the present study is aimed at correlating VBM and MV measurements of gray matter volume by assessing the amygdala and the hippocampus. These structures have been selected because they are almost entirely composed of gray matter. In order to assess the influence of Gaussian filter width, the correlations were measured using either a wide (12 mm) or a narrow (4 mm) FWHM Gaussian filter.
MATERIALS AND METHODS
PARTICIPANTS
The sample studied consisted of 16 patients aged 23 to 58 years (mean 36.9 years, SD 9.4 years) with a current or past history of Panic Disorder (PD) based on the Structured Clinical Interview for DSM-IV-SCID-IV (First et al. 1997), translated into Portuguese (Del-Ben et al. 2001) and 16 matched healthy controls matched for sex, age, socioeconomic status, years of education and handedness. Participants with age under 18 or above 60 years old, other psychiatric disorder, apart from agoraphobia and depressive disorders, general medical condition that could interfere in the interpretation of the results and one potentially incompatible with MRI have been excluded from the study. The comparison between gray matter volumes of panic patients and healthy controls has been reported elsewhere (Uchida et al. in press).
The study was approved by the local Research Ethics Committee and written informed consent was obtained from each volunteer.
BRAIN IMAGING PROCEDURES
Images were acquired using a 1.5 T Magneton Vision scanner (Siemens, Germany). Contiguous 1.0 mm sagittal images were acquired across the entire brain, using a T1-weighted fast field echo sequence (TE = 4 ms, TR = 9.7 ms, flip angle = 12º, field of view = 25.6 mm, 256 ×256 matrix).
VBM was performed using the SPM2 package (Wellcome Department of Imaging Neuroscience, London), executed in Matlab (Mathworks, Sherborn, MA). A standard template set was created specifically for the study, consisting of a mean T1-weighted image, and a priori gray matter, white matter and cerebrospinal fluid (CSF) templates, consisting of mean images averaging the data of all PD and healthy control subjects. The use of customized templates in VBM is aimed to match more closely the population under investigation and the image acquisition protocols used in the study (Good et al. 2001). The inclusion of PD patients in our template set was intended to prevent biases during the spatial transformations, as a template based exclusively on images from healthy controls would lead to a greater degree of warping of the PD scans during normalization. Images were spatially normalized to the standard T1-MRI template provided in the SPM2 program, based on 152 healthy subjects from the Montreal Neurological Institute (MNI) (Mazziotta et al. 1995). Such spatial normalization procedure is intended to fit the overall shape of each brain structure in individual subjects to the standard coordinate system of the SPM2 program template, as well as to correct the imaging data of each subject by a fixed factor in order to account for individual differences in whole brain size. Such spatial normalization step was restricted to 12-parameter affine linear transformations, in order to minimize deformations of the original images. Spatially normalized images were then segmented into gray matter, white matter and CSF compartments, by using a modified mixture model cluster analysis technique (Good et al. 2001). This used the prior probability maps provided in the SPM2 package (derived from the MNI dataset), overlaid onto the images in order to classify voxels in terms of their probability of belonging to a particular tissue class. The segmentation method also included: an automated brain extraction procedure to remove non-brain tissue and an algorithm to correct for image intensity non-uniformity, in order to control for image intensity variations caused by different positions of cranial structures within the MRI head coil. Finally, images were smoothed with an isotropic Gaussian filter of the 8 mm Full Width at Half Maximum (FWHM), and averaged to provide the gray, white matter and CSF templates in stereotactic space.
The processing of the original images from all PD patients and healthy controls using the above template set involved, initially, the segmentation of images using the a priori gray matter, white matter and CSF images. Extracted gray matter images were then spatially normalized to the customized gray and white matter templates, using 12-parameter linear as well as nonlinear (7×9×7 basis functions) transformations. The parameters resulting from the spatial normalization of the extracted gray matter images were then reapplied to the original structural images, and images were re-sliced using tri-linear interpolation to a final voxel size of 2×2×2 mm. These fully normalized images were then segmented into gray matter, white matter and CSF partitions. Voxel values in the segmented gray matter images were then subject to an SPM2 processing step named ''image modulation'' (Good et al. 2001), whereby individual voxel values are modified using the Jacobian determinants derived from the spatial normalization. The absolute value of the Jacobian determinant gives the factor by which the transformation function F expands or shrinks volumes. Thus the image modulation step allows brain structures that had their volumes reduced after spatial normalization to have their total counts decreased by an amount proportional to the degree of volume shrinkage. Statistical analyses performed on modulated images test for between-group regional differences in the absolute volume of gray matter shrinkage (Good et al. 2001), rather than differences in gray matter concentration. In order to evaluate the possible influence of the Gaussian filter width, we initially used a 12 mm FWHM Gaussian filter, repeated the VBM analyses after smoothing the images with a narrower filter size (4 mm FWHM) and inspected the resulting SPMs for the presence of findings specifically located in the medial temporal region.
MV was carried out in the amygdala and hippocampus of 16 PD patients and 16 controls, according to the ROI-based methods described in Uchida et al. (2003). The original MRI data of each subject were reformatted to contiguous 2-mm thick, coronal slices perpendicular to the main axis of the hippocampus. The anatomical landmarks of amygdala and hippocampus were defined according to Watson et al. (1992). The rostral limit of the amygdala was defined by the end of the lateral sulcus and the beginning of the entorhinal sulcus, the medial limit by the entorhinal cortex, the ventrolateral border by the neighboring white matter and the ventral horn of the lateral ventricle, and the dorsal limit by a straight line from the dorsolateral optical tract to the bottom of the circular sulcus of the insula. The inferior horn of the lateral ventricle was used to separate the posterior amygdala from the head of the hippocampus. The ventral limit of the hippocampus was the angle determined by the medial subiculum and the parahippocampal gyrus. The body of the hippocampus included the subiculum, dentate gyrus and alveus, in addition to the hippocampus proper. Caudally, the hippocampus was measured up to the last slice in which the lamina quadrigemina was visible.
A single rater (RRU), blind to the subject identity, delineated the structures manually, using the Image J software (Scion Corp., Frederick, MD, USA). The volumes were calculated multiplying the area by the slice thickness. The reliability of the measurements was tested in a sub-sample of 7 participants whose measures were compared with the measures made by a neuroradiologist with large experience with MV methodology (DA). The inter-rater reliability, as assessed by intra-class correlation coefficient (ICC), equaled 0.75 for the amygdala and 0.84 for the hippocampus. The measures of other group of 7 participants were repeated, intra-rater reliability ICCs being equal to 0.97 for the right amygdala, 1.00 for the left amygdala, 1.00 for the right hippocampus and 0.93 for the left hippocampus.
DATA ANALYSIS
In order to compare the two image analysis methods, SPMs showing linear correlations between MV measurements and VBM-based gray matter volumes were calculated, after co-varying out the effect of the total amount of gray matter in the brain. Additionally, we used the small volume correction tool in the SPM2 package for restricting the comparisons to specific voxels located inside the amygdala and hippocampus. These regions were delimited by applying spatially normalized volumes onto the SPMs, based on the anatomical volumes of interest that are available within the automatic anatomical labeling SPM toolbox. Search volumes were, respectively: 220 voxels for the right and 248 voxels for the left amygdala; 946 voxels for the right and 932 voxels for the left hippocampal region. Voxel clusters within each structure of interest were compared by the surviving family-wise error (FWE) multiple comparison test (Becker and Knapp 2004). Differences were considered significant for P < 0.05. The SVC approach allows hypothesis-driven analyses to be performed with correction for the pre-specified region of interest rather than with correction for the whole brain. In all analyses, MNI coordinates of maximal statistical significancevoxels were converted to the Talairach and Tournoux's (1988) system, using the method described by Brett et al. (2002).
RESULTS
Table I shows the correlations between MV measurements and optimized VBM with SVC in all subjects(n = 32).
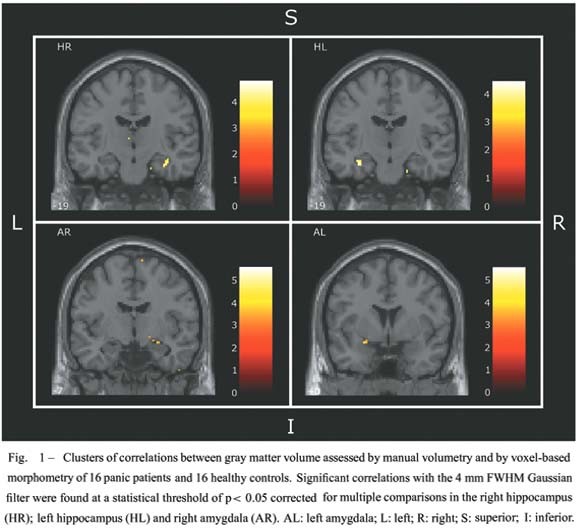
With the 12 mm filter, there was a highly significant correlation between right hippocampus MV and the right anterior hippocampus of SPM. However, the main SPM correlation cluster of the manual volume of the left hippocampus was placed laterally, rather than inside the left hippocampus. With the 4 mm Gaussian filter, statistically significant or nearly significant correlation clusters for the right and left hippocampal MV measurements were located in the right anterior hippocampus and the left anterior hippocampus of the SPM, respectively. These correlations are illustrated in Figure 1.
There was no correlation cluster between manual volume of either the left or the right amygdala and optimized VBM, when the 12 mm FWHM Gaussian filter was used. With the 4 mm filter, there was a small cluster in SPM located in right amygdala correlated with the right amygdala MV (Fig. 1). A cluster was observed in the left amygdala by visual inspection, but was located outside the left amygdala volume of interest of automatic anatomic labeling of the SPM2 used in the small volume correction function, or in the Talaraich and Tournoux (1988) atlas.
DISCUSSION
Overall, the present results show a good agreement between hippocampal volume measured by MV and VBM when the narrow (4 mm) Gaussian filter wasused; to a lesser extent, the same agreement was found in the amygdala. However, with the wide filter (12 mm), concordance between the two measurements occurred only in the right hippocampus.
In the former VBM study (Uchida et al. in press), an intermediate filter width (8 mm) proved to be the best to detect between-group differences; the main findings were an increase in gray matter volume in the left insula, left superior temporal gyrus and upper brain stem, as well as gray matter deficit in the right anterior cingulate cortex of panic patients as compared to controls.
As in the present study, previously reported results have shown an agreement between brain volumes assessed by MV and by VBM. In a classical study, Maguire et al. (2000) have analyzed MR images from taxi drivers that had been extensively trained to memorize the streets of London, in order to compare the volume of their hippocampi with those of untrained controls. With MV, it was found that the volume of the anterior portion of the hippocampus was smaller, that of the middle portion was equal, and that of the posterior portion was larger in the taxi drivers as compared to controls, and similar results were obtained with VBM. A comparative study between MV and VBM has also been made in the caudate nucleus using Pearson's correlation coefficient. In the transformed grey matter maps, voxel values at the location of the caudate nuclei were significantly correlated with region-of-interest measurements of caudate area in native image space in both schizophrenic patients and their relatives (Wright et al. 1999). In another study, Keller et al. (2002) analyzed patients with temporal lobe epilepsy having hippocampal atrophy and have found that both the MV and the VBM detected a reduction of hippocampal gray matter density in these patients, compared to healthy controls. Also, the decrease of the left hippocampal volume in first-episode schizophrenic patients, reported by Hirayasu et al. (1998) using MV has been confirmed by Kubicki et al. (2002) by analyzing the same MR images with VBM.
In spite of the above examples of concordance, differences between volumes of brain structures assessed by the two methods of image analysis have also been reported. Using MV, Lawrie et al. (2001) have found volume decrease of the amygdala-hippocampal complex in first-episode schizophrenics compared to normal individuals and, to a smaller extent, in a genetic group having high-risk for schizophrenia. However, further analysis of the same groups with VBM found no such differences (Job et al. 2002, 2003). Disagreement between the results of the two techniques has also been reported in right hippocampus by Good et al. (2002), who performed a comparative study among three experimental groups, namely Alzheimer dementia patients, semantic dementia patients and healthy controls, with the explicit purpose of validating the VBM procedure.
As pointed out in the Introduction, methodological factors, such as optimization and filter width, may be the reason of such discrepancies. The latter feature is likely to be critical, since the studies which got the best concordance between the two procedures (Maguire et al. 2000, Kubicki et al. 2002) have used a relatively narrow Gaussian filter. The present findings showing that the 4 mm, but not the 12 mm filter showed good concordance between MV and VBM considerably strengthen the argument. In agreement, the results of reported VBM studies indicate that the Gaussian smoothing at 10-12 mm FWHM prevents the detection of volume changes in small brain structures, such as the hippocampus (Maguire et al. 2000, Kubicki et al. 2002), and narrow Gaussian filters have been particularly recommended for analyzing small brain structures, such as the amygdala and the hippocampus (Salmond et al. 2002).
Finally, it is worth remarking that among the studies of concordance between VBM and MV so far performed, the present is the only one that used statistical correlation analysis.
It may be concluded from the present as well aspreviously reported results that both MV and VBM reliably measure the volume of brain structures, provided that optimization and the Gaussian filter width appropriate for the size of the brain structures studied are used in the VBM procedure.
ACKNOWLEDGMENTS
This work was supported by a grant from Fundação de Amparo à Pesquisa do Estado de São Paulo (FAPESP), (2002/13197-2). FGG is recipient of research fellowships from Conselho Nacional de Desenvolvimento Científico e Tecnológico (CNPq) and Fundação de Apoio ao Ensino, Pesquisa e Asssistência (FAEPA) do Hospital das Clínicas da FMRPUSP. We thank Antonio Carlos dos Santos and Francisco Silveira Guimarães for helpful comments and suggestions concerning data collection and analysis.
Manuscript received on September 13, 2007; accepted for publication on January 21, 2008; contributed by FREDERICO G. GRAEFF* * Member Academia Brasileira de Ciências
- ASHBURNER J AND FRISTON KJ. 2000. Voxel-based morphometry-the methods. Neuroimage 11: 805821.
- BECKER T AND KNAPP M. 2004. A powerful strategy to account for multiple testing in the context of haplotype analysis. Am J Hum Genet 75: 561570.
- BRETT M, JOHNSRUDE IS AND OWEN AM.2002. The problem of functional localization in the human brain. NatRev Neurosci 3: 243249.
- DEL-BEN CM, VILELA JAA, CRIPPA JA, HALLAK JEC, LABATE CM AND ZUARDI AW.2001. Confiabilidade da "Entrevista Clínica Estruturada para o DSM IV Versão Clínica" traduzida para o português. Rev Bras Psiquiat 23: 156159.
- FIRST MB, SPITZER RL, WILLIAMS JBW AND GIBBON M. 1997. Structured Clinical Interview for DSM-IV axis I disorders clinician version (SCID-CV). Washington (DC): American Psychiatric Press, 84 p.
- GOOD CD, JOHNSRUDE IS, ASHBURNER J, HENSON RN, FRISTON KJ AND FRACKOWIAK RS. 2001. A voxel-based morphometric study of ageing in 465 normal adult human brains. Neuroimage 14: 2136.
- GOOD CD, SCAHILL RI, FOX NC, ASHBURNER J, FRISTON KJ, CHAN D, CRUM WR, ROSSOR MN AND FRACKOWIAK RS. 2002. Automatic differentiation of anatomical patterns in the human brain: validation with studies of degenerative dementias. Neuroimage 17: 2946.
- HIRAYASU Y ET AL. 1998. Lower left temporal lobe MRI volumes in patients with first-episode schizophrenia compared with psychotic patients with first-episode affective disorder and normal subjects. Am J Psychiatry 155: 13841391.
- JOB DE, WHALLEY HC, MCCONNELL S, GLABUS M, JOHNSTONE EC AND LAWRIE SM. 2002. Structural gray matter differences between first-episode schizophrenics and normal controls using voxel-based morphometry. Neuroimage 17: 880889.
- JOB DE, WHALLEY HC, MCCONNELL S, GLABUS M, JOHNSTONE EC AND LAWRIE SM. 2003. Voxel-based morphometry of grey matter densities in subjects at high risk of schizophrenia. Schizophr Res 64: 113.
- KELLER SS, MACKAY CE, BARRICK TR, WIESHMANN UC, HOWARD MA AND ROBERTS N. 2002. Voxel-based morphometric comparison of hippocampal and extrahippocampal abnormalities in patients with left and right hippocampal atrophy. Neuroimage 16: 2331.
- KUBICKI M, SHENTON ME, SALISBURY DF, HIRAYASU Y, KASAI K, KIKINIS R, JOLESZ FA AND MCCARLEY RW. 2002. Voxel-based morphometric analysis of gray matter in first episode schizophrenia. Neuroimage 17: 17111719.
- LAWRIE SM, WHALLEY HC, ABUKMEIL SS, KESTELMAN JN, DONNELLY L, MILLER P, BEST JJ, OWENS DG AND JOHNSTONE EC. 2001. Brain structure, genetic liability, and psychotic symptoms in subjects at high risk of developing schizophrenia. Biol Psychiatry 49: 811823.
- LOCHHEAD RA, PARSEY RV, OQUENDO MA AND MANN JJ. 2004. Regional brain gray matter volume differences in patients with bipolar disorder as assessed by optimized voxel-based morphometry. Biol Psychiatry 55: 11541162.
- MAGUIRE EA, GADIAN DG, JOHNSRUDE IS, GOOD CD, ASHBURNER J, FRACKOWIAK RS AND FRITH CD. 2000. Navigation-related structural change in the hippocampioftaxidrivers. Proc Natl Acad Sci 97: 43984403.
- MAZZIOTTA JC, TOGA AW, EVANS A, FOX P AND LANCASTER J.1995. A probabilistic atlas of the human brain: theory and rationale for its development. The International Consortium for Brain Mapping (ICBM). Neuroimage 2: 89101.
- SALMOND CH, ASHBURNER J, VARGHA-KHADEM F, CONNELLY A, GADIAN DG AND FRISTON KJ. 2002. Distributional assumptions in voxel-based morphometry. Neuroimage 17: 10271030.
- TALAIRACH J AND TOURNOUX P. 1988. Co-Planar Stereotaxic Atlas of the Human Brain. NewYork: Thieme Medical Publishers Inc, 122 p.
- UCHIDA RR, DEL-BEN CM, SANTOS AC, ARAÚJO D, CRIPPA JA, GUIMARÃES FS AND GRAEFF FG. 2003. Decreased volume of left temporal lobe in panic patients measured through magnetic resonance imaging. Braz J Med Biol Res 36: 925929.
- UCHIDA RR, DEL-BEN CM, BUSATTO GF, DURAN FLS, GUIMARÃES FS, CRIPPA JAS, ARAÚJO D, SANTOS AC AND GRAEFF FG. In press. Regional grey matter abnormalities in panic disorder: a voxel-based morphometry study. Psychiatry Res Neuroimaging.
- WATSON C, ANDERMANN F, GLOOR P, JONES-GOTMAN M, PETERS T, EVANS A, OLIVIER A, MELANSON D AND LEROUX G. 1992. Anatomic basis of amygdaloid andhippocampalvolumemeasurementbymagneticresonance imaging. Neurology 42: 17431750.
- WRIGHT IC, MCGUIRE PK, POLINE JB, TRAVERE JM, MURRAY RM, FRACKOWIAK RSJ AND FRISTON KJ. 1995. A voxel-based method for the statistical analysis of grey and white matter density applied to schizophrenia. Neuroimage 2: 244252.
- WRIGHT IC, ELLISON ZR, SHARMA T, FRISTON KJ, MURRAY RM AND MCGUIRE PK. 1999. Mapping of grey matter changes in schizophrenia. Schizophr Res 35: 114.
Correspondence to:
Publication Dates
-
Publication in this collection
10 Mar 2008 -
Date of issue
Mar 2008
History
-
Accepted
21 Jan 2007 -
Received
13 Sept 2007