Abstracts
This paper presents gravimetric and morphologic analyses based on the satellite-derived data set of EGM2008 and TOPEX for the area of the oceanic mantle massif of the Saint Peter and Saint Paul peridotite ridge, Equatorial Atlantic Ocean. The free-air anomaly indicates that the present plate boundary is not situated along the longitudinal graben which cuts peridotite ridge, but about 20 km to the north of it. The high Bouguer anomaly of the peridotite ridge suggests that it is constituted mainly by unserpentinised ultramafic rocks. The absence of isostatic compensation and low-degree serpentinisation of the ultramafic rocks indicate that the peridotite ridge is sustained mainly by active tectonic uplift. The unparallel relation between the transform fault and the relative plate motion generates near north-south compression and the consequent tectonic uplift. In this sense, the peridotite massif is a pressure ridge due to the strike-slip displacement of the Saint Paul Transform Fault.
mantle exhumation; Saint Peter and Saint Paul peridotite ridge; satellite gravimetry; serpentinization; submarine geomorphology
Este trabalho apresenta análises gravimétricas e morfológicas com base nos dados de satélites de EGM2008 e TOPEX para a área do maciço do manto oceânico da cadeia peridotítica de São Pedro e São Paulo, Oceano Atlântico Equatorial. A anomalia ar-livre indica que o contato atual das placas não se situa ao longo da graben longitudinal que se cruza com a cadeia peridotítica, mas em cerca de 20 km ao norte dessa. A alta anomalia Bouguer da cadeia peridotítica sugere que o maciço é constituído principalmente por rochas ultramáficas não serpentinizadas. A ausência de compensação isostática e o baixo grau de serpentinização das rochas ultramáficas indicam que a cadeia peridotítica é sustentada principalmente pelo soerguimento tectônico ativo. A relação não paralela entre a falha transformante e o movimento relativo das placas gera a compressão quase norte-sul e o consequente soerguimento tectônico. Neste sentido, o maciço peridotítico é uma cadeia de pressão devido ao deslocamento lateral da Falha Transformante de São Paulo.
exumação do manto; cadeia peridotítica de São Pedro e São Paulo; gravimetria de satélite; serpentinização; geomorfologia submarina
INTRODUCTION
Satellite-derived gravimetry is an efficient instrument for geotectonic and structural studies of oceanic regions. This technique is based on the analyses of the orbit disturbance of artificial satellites which is caused by gravity heterogeneities of the Earth. The first world-wide gravimetric map and the satellite-derived bathymetric map were released at the end of the 20thcentury (Smith and Sandwell 1994Smith WH and Sandwell DT. 1994. Bathymetric prediction from dense satellite altimetry and sparse shipboard bathymetry. J Geophys Res 99-B2: 21803-21824., 1997Smith WH and Sandwell DT. 1997. Global sea floor topography from satellite altimetry and ship depth soundings. Science 277: 1957-1962.) and the technique is still in rapid evolution. In recent years, the data have been improved remarkably because of technical innovation (Sandwell and Smith 2009Sandwell DT and Smith WH. 2009. Global marine gravity from retracked Geosat and ERS-1 altimetry: Ridge segmentation versus spreading rate. J Geophys Res 114: B01411.) and consecutive accumulation of new satellite data and recent shipborne data.
The satellite gravimetry and bathymetry have low resolution in relation to the shipborne ones, but they can cover a very wide oceanic area. Therefore, the satellite-derived data are suitable for regional geotectonic studies of plate boundaries, abyssal fracture zones, and volcanic seamounts (e.g. Calmant 1994Calmant S. 1994. Seamount topography by least-squares inversion of altimetric geoid heights and shipborne profiles of bathymetry and/or gravity anomalies. Geophys J Int 119: 428-452., Binard et al. 1996Binard N, Stoffers P, Hekinian R and Searle RC. 1996. Intraplate en echelon volcanic ridges in the South Pacific west of the Easter microplate. Tectonophysics 263: 23-37., Wessel 1997Wessel P. 1997. Sizes and Ages of Seamounts Using Remote Sensing: Implications for Intraplate Volcanism. Science 277: 802-805., De Alteriis et al. 1998, Etnoyer 2005Etnoyer P. 2005. Seamount resolution in satellite-derived bathymetry. Geochem Geophys Geosyst 6: Q03004, 8 p.). This technique was introduced to Brazil and adopted by recent scientific researches (e.g. Motoki et al. 2009Motoki A, Sichel SE, Campos TFC, Srivastava NK and Soares RS. 2009. Present-day uplift rate of the Saint Peter and Saint Paul Islets, Equatorial Atlantic Ocean. REM-Revista Escola de Minas, Ouro Preto 62: 331-342., 2012aMotoki A, Motoki KF and Melo DP. 2012a. Submarine morphology characterization of the Vitória-Trindade Chain and the adjacent areas, State of Espírito Santo, Brazil, based on the predicted bathymetry of the TOPO version 14.1. Rev Bras Geomorfol, Brasília 13: 403-415.). Among them, those for the Saint Peter and Saint Paul Rocks (Arquipélago de São Pedro e São Paulo) are highlighted (e.g. Sichel et al. 2008Sichel SE, Esperança S, Motoki A, Maia M, Horan MF, Szatmari P, Alves EC and Mello SLM. 2008. Geophysical and geochemical evidence for cold upper mantle beneath the Equatorial Atlantic Ocean. Rev Bras Geofís 26: 69-86., 2011, Motoki et al. 2009Motoki A, Sichel SE, Campos TFC, Srivastava NK and Soares RS. 2009. Present-day uplift rate of the Saint Peter and Saint Paul Islets, Equatorial Atlantic Ocean. REM-Revista Escola de Minas, Ouro Preto 62: 331-342., Campos et al. 2010Campos TFC, Bezerra FHR, Srivastava NK, Vieira MM and Vita-Finzi C. 2010. Holocene tectonic uplift of the St Peter and St Paul Rocks (Equatorial Atlantic), consistent with emplacement by extrusion. Mar Geol 271: 177-186.).
The Saint Peter and Saint Paul Rocks are situated at 00°55′N, 29°21′W, northwest corner of the Saint Paul transform fault zone, Equatorial Atlantic Ocean (Figure 1). They are situated close to the boundary between the South American Plate and African Plate, exposing serpentinised abyssal mantle peridotite (e.g. Campos et al. 2003Campos TFC, Virgens Neto J, Amorim VA, Hartmann LA and Petta RA. 2003. Modificações metassomáticas das rochas milonitizadas do complexo ultramáfico do Arquipélago de São Pedro e São Paulo, Atlântico Equatorial. Geochim Bras 17: 81-90., Sichel et al. 2008Sichel SE, Esperança S, Motoki A, Maia M, Horan MF, Szatmari P, Alves EC and Mello SLM. 2008. Geophysical and geochemical evidence for cold upper mantle beneath the Equatorial Atlantic Ocean. Rev Bras Geofís 26: 69-86.). The mantle rocks crop out at the top surface of a large and steep submarine hill, called Saint Peter and Saint Paul peridotite ridge (Figure 2, cadeia peridotítica de São Pedro e São Paulo). In contrast to the mantle xenoliths in the alkaline mafic rocks (e.g. Sial et al. 1981Sial AN, Long LE, Pessôa DAR and Kawashita K. 1981. Potassium-argon ages and strontium isotope geochemistry of Mesozoic and Tertiary basaltic rocks, northeastern Brazil. An Acad Bras Cienc 53: 115-122., Rivalenti et al. 2000Rivalenti G, Mazzucchelli M, Girardi VAV, Vannucci RV, Barbieri MA, Zanetti A and Goldstein SL. 2000. Composition and processes of the mantle lithosphere in northeastern Brazil and Fernando de Noronha: evidence from mantle xenoliths. Contributions to Mineralogy and Petrology 138: 308-325., Schilling et al. 2005Schilling M, Conceição RV, Mallmann G, Koester E, Kawashita K, Hervé F, Morata D and Motoki A. 2005. Spinel-facies mantle xenoliths from Cerro Redondo, Argentine Patagonia: Petrographic, geochemical, and isotopic evidence of interaction between xenoliths and host basalt. Lithos 82: 485-502.), these ultramafic rocks occur in in-situ outcrops. The Saint Peter and Saint Paul Rocks are the only locality of the Atlantic Ocean in which the mantle exposure breaks the sea surface.
Topographic map of the studied area based on the satellite-derived bathymetry of Global Topography ver. 14.1 of TOPEX. The plate boundary is after Sichel et al. (2011). ASPSP - Saint Peter and Saint Paul Rocks; TFBC, TFCD, TFDD - transform fault; TFBC*, TFCD* - inactive abyssal fracture zone. The rectangular areas 1, 2, and 3 are MCI (Massive Concavity Index) calculations data areas of Figure 16. The rectangular area 3 also indicates the data area for the gravimetric interpretation diagram of Figure 11B.
Composite cross-section of submarine morphology for the Saint Peter and Saint Paul peridotite ridge, compiled from six deep dives performed by the scientific submersible Nautile (Hekinian et al. 2000Hekinian R, Juteau T, Gracia E, Udintsev G, Sichler B, Sichel SE and Apprioual R. 2000. Submersible observations of Equatorial Atlantic Mantle: The St. Paul Fracture Zone region. Mar Geophys Res 21: 529-560.).
Motoki et al. (2009)Motoki A, Sichel SE, Campos TFC, Srivastava NK and Soares RS. 2009. Present-day uplift rate of the Saint Peter and Saint Paul Islets, Equatorial Atlantic Ocean. REM-Revista Escola de Minas, Ouro Preto 62: 331-342. and Campos et al. (2010)Campos TFC, Bezerra FHR, Srivastava NK, Vieira MM and Vita-Finzi C. 2010. Holocene tectonic uplift of the St Peter and St Paul Rocks (Equatorial Atlantic), consistent with emplacement by extrusion. Mar Geol 271: 177-186. determined that the Saint Peter and Saint Paul Rocks are currently being uplifted at a rate of 1.5 mm/year. The peridotite ridge is composed of ultramafic rocks of abyssal mantle and its uplift needs a strong compression stress. However, the Saint Paul Transform Fault Zone (Zona de Falhas Transformantes de São Paulo) is characterized by strike-slip tectonism and the compression tectonism is unlikely.
The authors have performed gravimetric and morphologic analyses for the northwest corner of the Saint Paul Transform Fault Zone based on the satellite-derived data sets of EGM2008 and TOPEX. This article reports the results and discusses the gravimetric structure of the peridotite ridge, the mantle exhumation process, and the genesis of the uplift tectonism.
Saint Paul Transform Fault Zone
The studied area is situated at the northwest corner of the Saint Paul transform fault zone, which is 540 km long and 100 km wide. It is constituted by at least three short ridge segments and four transform faults of east-west direction (Figure 1). The ridge segments are specified, from south to north, Segment A, B, and C. Sichel et al. (2011) proposed Segment D at 20 km to the north of Segment C.
The transform faults are specified in accordance with the ridge segments in contact. For example, the transform fault between Segment A and B is called TFAB. The southernmost transform fault is called TFAA, and the northernmost one, TFDD. These transform faults have abyssal fracture zones extending beyond the ends of the faults. The fracture zone linked to the transform fault TFBD is called TFBC*, and the others following the same rule. They are highly linear, being a characteristic of the area underlain by abnormally low temperature abyssal mantle, namely a cold-spot (e.g. Bonatti et al. 1993Bonatti E, Seyler M and Sushevskaya N. 1993. A Cold Suboceanic mantle belt at the Earth's Equator. Science 261: 315-320., Hekinian et al. 2000Hekinian R, Juteau T, Gracia E, Udintsev G, Sichler B, Sichel SE and Apprioual R. 2000. Submersible observations of Equatorial Atlantic Mantle: The St. Paul Fracture Zone region. Mar Geophys Res 21: 529-560., Gung and Romanowicz 2004Gung Y and Romanowicz B. 2004. Q tomography of the upper mantle using three component long period waveforms. Geophys J Int 157: 813-830., Sichel et al. 2008Sichel SE, Esperança S, Motoki A, Maia M, Horan MF, Szatmari P, Alves EC and Mello SLM. 2008. Geophysical and geochemical evidence for cold upper mantle beneath the Equatorial Atlantic Ocean. Rev Bras Geofís 26: 69-86.).
These linear depressions are deeper than 4000 m and some sites more than 5000 m deep. To the west of Segment C between the transform fault TFCD and abyssal fracture zone TFBC*, there is an east-west linear ridge which has a relative depth of 1800 m, called CSGH (C-Segment Gravimetric High). On the other hand, the morphologic depression with a relative depth of 600 m along the TFCD* is not so relevant.
The western half of the transform fault TFDD, the span between the Point B and C, called the Oblique Path, shows notable morphologic depression with a relative depth of 800 m and four spots deeper than 4000 m. On the other hand, the eastern half of the TFDD, between the Point C and D, is called the Straight Path, and has relative depth of 400 m. This area has scarce shipborne bathymetric data, and therefore, the morphology is ambiguous.
The mid-ocean ridge Segment C (Point A) is characterised by the remarkably deep valley. Its depth ranges from 4200 m to 5300 m as per the satellite-derived data. The elevation difference between the eastern end of the CSGH and the valley bottom is about 2200 m. Mid-ocean ridge Segment D, which was proposed by Sichel et al. (2011), shows ambiguous morphology in the satellite data (Point D). It could be due to the scarce shipborne data at this site. The southern terminus of Segment D, which is in contact with the transform fault TFCD, has shipborne data, which shows a notable morphologic depression, so-called Saint Paul Deep (SPD, Figure 1).
The Saint Peter and Saint Paul Peridotite Ridge is 80 km long, 25 km wide, and 3500 m high, with a base area of 666 km2. This mantle massif is very large in comparison with the adjacent morphologic features. The deep dives by the scientific submersible Nautile determined that the ridge flanks are extremely steep and the typical declivity in the upper half of the morphologic elevation is more than 45° (Hekinian et al. 2000Hekinian R, Juteau T, Gracia E, Udintsev G, Sichler B, Sichel SE and Apprioual R. 2000. Submersible observations of Equatorial Atlantic Mantle: The St. Paul Fracture Zone region. Mar Geophys Res 21: 529-560.). At the eastern and southern slopes, there are subvertical cliffs with respective relative heights of 2500 m and 1500 m (Figure 2). These peculiar morphologic features indicate young and intense uplift.
Geologic and Tectonic Settings
Tilley (1947)Tilley CE. 1947. Dunite mylonite of St. Paul's rocks (Atlantic). Am J Sci 245: 483-491.considered that the ultramafic rocks exposed at the Saint Peter and Saint Paul Rocks to be mylonitic dunite originated from ultramafic magma. However, later studies revealed that they are, in fact, peridotitic rocks of the mantle (e.g. Melson 1967, Hekinian et al. 2000Hekinian R, Juteau T, Gracia E, Udintsev G, Sichler B, Sichel SE and Apprioual R. 2000. Submersible observations of Equatorial Atlantic Mantle: The St. Paul Fracture Zone region. Mar Geophys Res 21: 529-560., Campos et al. 2005Campos TFC, Virgens Neto J, Srivastava NK, Petta RA, Harmann LA, Moraes JFS, Mendes L and Silveira SRM. 2005. Arquipélago de São Pedro e São Paulo e São Paulo, soerguimento tectônico de rochas infracrustais no Oceano Atlântico. Sítios Geológicos e Paleontológicos do Brasil, SIGEP 002, UNB, 12 p. http://www.unb.br/ig/sigep/sitio002/sitio002.pdf. Access: Dec. 31, 2006.
http://www.unb.br/ig/sigep/sitio002/siti...
, Sichel et al. 2008Sichel SE, Esperança S, Motoki A, Maia M, Horan MF, Szatmari P, Alves EC and Mello SLM. 2008. Geophysical and geochemical evidence for cold upper mantle beneath the Equatorial Atlantic Ocean. Rev Bras Geofís 26: 69-86.), that is, the Saint Peter and Saint Paul Peridotite Ridge is an exhumed massif of abyssal mantle.
The ultramafic rocks are constituted mainly by mylonitic peridotite with intercalations of kaersutite-rich mylonite. The degrees of serpentinisation are widely variable (Figure 3). Most of the samples show a strong ductile deformation with olivine and pyroxene porphyroclasts. Some of the samples exhibit highly plastic deformation (Sichel et al. 2011). The field observations indicate that the mylonitic texture was formed before the serpentinisation.
Geologic map of the Saint Peter and Saint Paul Rocks, Equatorial Atlantic Ocean, after Campos et al. (2005)Campos TFC, Virgens Neto J, Srivastava NK, Petta RA, Harmann LA, Moraes JFS, Mendes L and Silveira SRM. 2005. Arquipélago de São Pedro e São Paulo e São Paulo, soerguimento tectônico de rochas infracrustais no Oceano Atlântico. Sítios Geológicos e Paleontológicos do Brasil, SIGEP 002, UNB, 12 p. http://www.unb.br/ig/sigep/sitio002/sitio002.pdf. Access: Dec. 31, 2006.
http://www.unb.br/ig/sigep/sitio002/siti... .
The western end of the Belmont Island exposes unserpentinised peridotite (Figure 4A). Some outcrops exhibit serpentinisation along fractures, showing macro-scale kernel-like structure (Figure 4B). Micro-scale kernel texture is observed in thin sections of some apparently well-serpentinised rock samples (Figure 4C, D). Because of the incomplete serpentinisation, the average density of the constituent rocks of the Peridotite Ridge is significantly higher than the case of completely serpentinised peridotite.
Abyssal mantle ultramafic rocks of the Saint Peter and Saint Paul Rocks: A) Unserpentinised peridotite; B) Macro-scale kernel-like structure; C) Micro-scale kernel texture; D) Highly serpentinised mylonitic peridotite. The photos B, C, and D are after Sichel et al. (2011). P - unserpentinised peridotite; S - serpentinised peridotite.
The northern half of the Peridotite Ridge, called North Elevation, is constituted mainly by highly deformed peridotite of mylonitic texture and the southern half, South Elevation, by undeformed peridotite (Figure 5). The unserpentinised rocks of the North Elevation and undeformed ones of the South Elevation have a small variation in MgO, 36% to 37%. On the other hand, the serpentinised peridotite shows a wide variation in MgO, 36% to 49%. Both types of the peridotitic rocks are enriched in U, Th, Ba, and light rare earth elements. The osmium isotopic ratio shows that the materials originated from depleted mantle have model ages of 0.32 and 1.1 Ga. (Sichel et al. 2008Sichel SE, Esperança S, Motoki A, Maia M, Horan MF, Szatmari P, Alves EC and Mello SLM. 2008. Geophysical and geochemical evidence for cold upper mantle beneath the Equatorial Atlantic Ocean. Rev Bras Geofís 26: 69-86., 2011).
Abyssal mantle peridotite collected from the deep dives (A, B) and the sampling trajectories (C). The relief map shows multi-beam bathymetry around the Saint Peter and Saint Paul Peridotite Ridge. The figure is modified from Sichel et al. (2011).
The peridotite ridge is currently undergoing intense uplift tectonism. The present altitude of the Flandrian wave-cut bench and the 14C datings for the carbonates on the Saint Peter and Saint Paul Rocks indicate an uplift rate of 1.5 mm/year for the last 6000 years (Motoki et al. 2009Motoki A, Sichel SE, Campos TFC, Srivastava NK and Soares RS. 2009. Present-day uplift rate of the Saint Peter and Saint Paul Islets, Equatorial Atlantic Ocean. REM-Revista Escola de Minas, Ouro Preto 62: 331-342., Campos et al. 2010Campos TFC, Bezerra FHR, Srivastava NK, Vieira MM and Vita-Finzi C. 2010. Holocene tectonic uplift of the St Peter and St Paul Rocks (Equatorial Atlantic), consistent with emplacement by extrusion. Mar Geol 271: 177-186.), which is the highest rate in the Brazilian territory.
Highlighted Research Methods
The present paper introduces two highlighted research method: 1) Satellite-derived bathymetry and gravimetry; 2) Macro Concavity Index. The distribution areas of the submarine morphologies have been measured by the pixel counting method (Motoki et al. 2007Motoki A, Petrakis GH, Soares RS, Sichel SE and Aires JR. 2007. New method of semi-automatic modal analyses for phenocrysts of porphyritic rocks based on quantitative digital colour specification technique. REM-Revista Escola de Minas, Ouro Preto 60: 13-20., 2012bMotoki A, Geraldes MC, Iwanuch W, Vargas T, Motoki KF, Balmant A and Ramos MN. 2012b. Pyroclastic dyke and welded crystal tuff of the Morro dos Gatos alkaline intrusive complex, State of Rio de Janeiro, Brazil. REM-Revista Escola de Minas, Ouro Preto 65: 35-45.), using the original software Wilbur ver. 1.0 (Motoki et al. 2005Motoki A, Neves JLP and Vargas T. 2005. Quantitative colour analyses using digital specification technique for Mármore Bege Bahia, a representative Brazilian ornamental limestone of breccia-like texture. REM-Revista Escola de Minas. Ouro Preto 58: 113-120., 2006Motoki A, Zucco LL, Sichel SE, Neves JL and Aires JR. 2006. Development of the technique for digital colour specification and the new nomenclatures of ornamental rock based on the measured colours. Geociências, Rio Claro 26: 151-160.).
Satellite-Derived Bathymetry and Gravimetry
There are some satellite-derived bathymetry data sets, such as IBCAO, GINA, J-EGG, JODC, RIDGE, ETOPO2, ETOPO1, ETOPO30, GEBCO, and TOPEX. Among them GEBCO and TOPEX are adopted frequently by scientists. The bathymetric and gravimetric data of TOPEX are distributed from the UCSD-SIO (Scripps Institution of Oceanography of the University of California, San Diego), and the bathymetric data of GEBCO (General Bathymetric Chart of the Oceans), from the IHO (International Hydrographic Organization). The NGA (U.S. National Geospatial-Intelligence Agency) distributes free-air and Bouguer anomaly data, called EGM2008 (Earth Gravitational Model 2008, Pavlis et al. 2012Pavlis NK, Holmes SA, Kenyon SC and Factor JK. 2012. The development and evaluation of the Earth Gravitational Model 2008 (EGM2008). J Geophys Res: Solid Earth 177-B4: 4406.). For the present paper, the authors adopted EGM2008 for the gravimetric data and TOPEX ver. 14.1 for morphologic ones.
The first version of the world-wide satellite-derived bathymetry map was elaborated according to the method of Smith and Sandwell (1997)Smith WH and Sandwell DT. 1997. Global sea floor topography from satellite altimetry and ship depth soundings. Science 277: 1957-1962.. It had an apparent resolution of 3.7 km covering the oceanic areas between 72°N and 72S°. This resolution is true along the shipborne benchmark trajectories, but in the other areas it was lower being about 10 km. According to the continuous accumulation of the satellite and shipborne data, the quality of the compiled data has improved remarkably, especially in recent years. Therefore, since 2002 GEBCO has adopted satellite-derived bathymetric data as the main instrument for world-wide mapping.
The bathymetry data of TOPEX, called Global Topography ver. 14.1, has an apparent resolution of 1.85 km. It covers the areas between 80.7°N and 80.7S°. A better resolution of 0.9 km is also available. In the areas removed from benchmark trajectories, the real resolution ranges from 5 km to 10 km. According to the apparent depth of guyots, the absolute real vertical resolution is estimated to be about 50 m.
The free-air data of TOPEX, called Global Gravity Anomaly ver. 18, have apparent resolution of 1.85 km and estimated real resolution is about 5 km. On the other hand, EGM2008 provides free-air and Bouguer anomaly data with resolution of 4.63 km.
Although these data sets are excellent for most of the oceanic areas, they have some technical limitations. The real resolution of Global Topography has local heterogeneities. False topographic peaks of artificial effect are rarely observed. They are characterised by perfectly conical form, very small diameter, very large relative height, and absence of local free-air anomaly. Between Global Gravity Anomaly ver. 18 and EGM2008, there are some free-air data discordances. The satellite gravimetry will be improved in the near future according to the new data of Goce, which is an artificial satellite of European Space Agency for high precision gravimetric mapping.
Macro Concavity Index
The Saint Paul transform fault zone is situated at a cold-spot and has many geologic and geophysical differences from conventional magmatic spreading centres. A geomorphologic parameter MCI (Macro Concavity Index) can characterise three-dimensional morphologic features of this cold spot. This parameter was created to distinguish the massifs of intrusive body and extinct volcano, by means of erosive resistance difference (Petrakis et al. 2010Petrakis GH, Motoki A, Sichel SE, Zucco LL, Aires JR and Mello SLM. 2010. Ore geology of special quality gravel and artificial sand: examples of alkaline syenite of Nova Iguaçu, State of Rio de Janeiro, and rhyolite of Nova Prata, State of Rio Grande do Sul, Brazil. Geociências, Rio Claro 29: 21-32., Motoki et al. 2012cMotoki A, Campos TFC, Fonseca VP and Motoki KF. 2012c. Subvolcanic neck of Cabugi Peak, State of Rio Grande do Norte, Brazil, and origin of its landform. REM-Revista Escola de Minas. Ouro Preto 65: 195-206.).
The MCI expresses quantitatively general three-dimensional form of a massif, if it is convex or concave. A massif with negative MCI has concave form and that with positive MCI, convex form. The calculation of this parameter needs the techniques of summit level (seppômen), base level (sekkokumen), and relief amount (kifukuryô), which are used generally for geomorphologic analyses. They have been developed in Japan and have been recently introduced to Brazil (Motoki et al. 2008Motoki A, Petrakis GH, Sichel SE, Cardoso CE, Melo RC, Soares RS and Motoki KF. 2008. Landform origin of the Mendanha Syenitic Massif, State of Rio de Janeiro, Brazil, based on the geomorphological analyses by summit level map technique. Geociências, Rio Claro 27: 99-115., Silva 2010Silva S. 2010. Interpretação morfológica baseada nas técnicas de seppômen e sekkokumen dos maciços alcalinos do Estado do Rio de Janeiro. Tese de Mestrado, Departamento de Geologia, Universidade Federal Fluminense, Niterói, Brasil, 123 p. (Unpublished)., Couto et al. 2012Couto EVM, Frotes E, Sordi MV, Marques AJ and Camolezi BA. 2012. Seppômen maps for geomorphic developments analysis: the case of Paraná plateau border, Faxinal, State of Paraná, Brazil. Technology, Maringá, Acta Sci 34: 71-78., Aires et al. 2012Aires JR, Motoki A, Motoki KF, Motoki DF and Rodrigues JG. 2012. Geomorphological analyses of the Teresópolis Plateau and Serra do Mar Cliff, State of Rio de Janeiro, Brazil with the help of summit level technique and ASTER GDEM, and its relation to the Cenozoic tectonism. Anuário de Instituto de Geociências da Universidade Federal do Rio de Janeiro 35: 105-123.). Currently, they are still fairly unknown in Brazil and the authors present a brief explanation.
The summit level map fills virtually small valleys and sea-bottom channels. The base level map virtually shaves small areas of positive relief. The difference between summit level and base level, called relief amount, shows general declivity of the target massif. These virtual maps are created by the following steps: 1) Divide the original topographical map in small squares by a grid of defined interval (Figure 6A); 2) Mark the highest point of each square for summit level and the lowest one for the base level; 3) Create new topographic maps using only the selected points (Figure 6B). For the creation of the virtual map, the authors developed the original software Baz ver.1.0 (Motoki et al. 2012cMotoki A, Campos TFC, Fonseca VP and Motoki KF. 2012c. Subvolcanic neck of Cabugi Peak, State of Rio Grande do Norte, Brazil, and origin of its landform. REM-Revista Escola de Minas. Ouro Preto 65: 195-206.)
Confection procedures of summit level map with grid interval of 500 m (A, B) and effect of grid interval to the summit level and base level surface (C), modified from Motoki et al. (2008)Motoki A, Petrakis GH, Sichel SE, Cardoso CE, Melo RC, Soares RS and Motoki KF. 2008. Landform origin of the Mendanha Syenitic Massif, State of Rio de Janeiro, Brazil, based on the geomorphological analyses by summit level map technique. Geociências, Rio Claro 27: 99-115..
The grid interval of the summit level and base level map is an important factor for geomorphologic interpretation. The summit level surface of a wide grid presents low-resolution surface filling wide erosive channels (Figure 6, curve P1). That of a narrow grid shows relatively high-resolution surface filling only narrow erosive channels (Figure 6, curve P2). The base level maps have similar tendencies in relation to the grid interval (Figure 6, curves K1, 2).
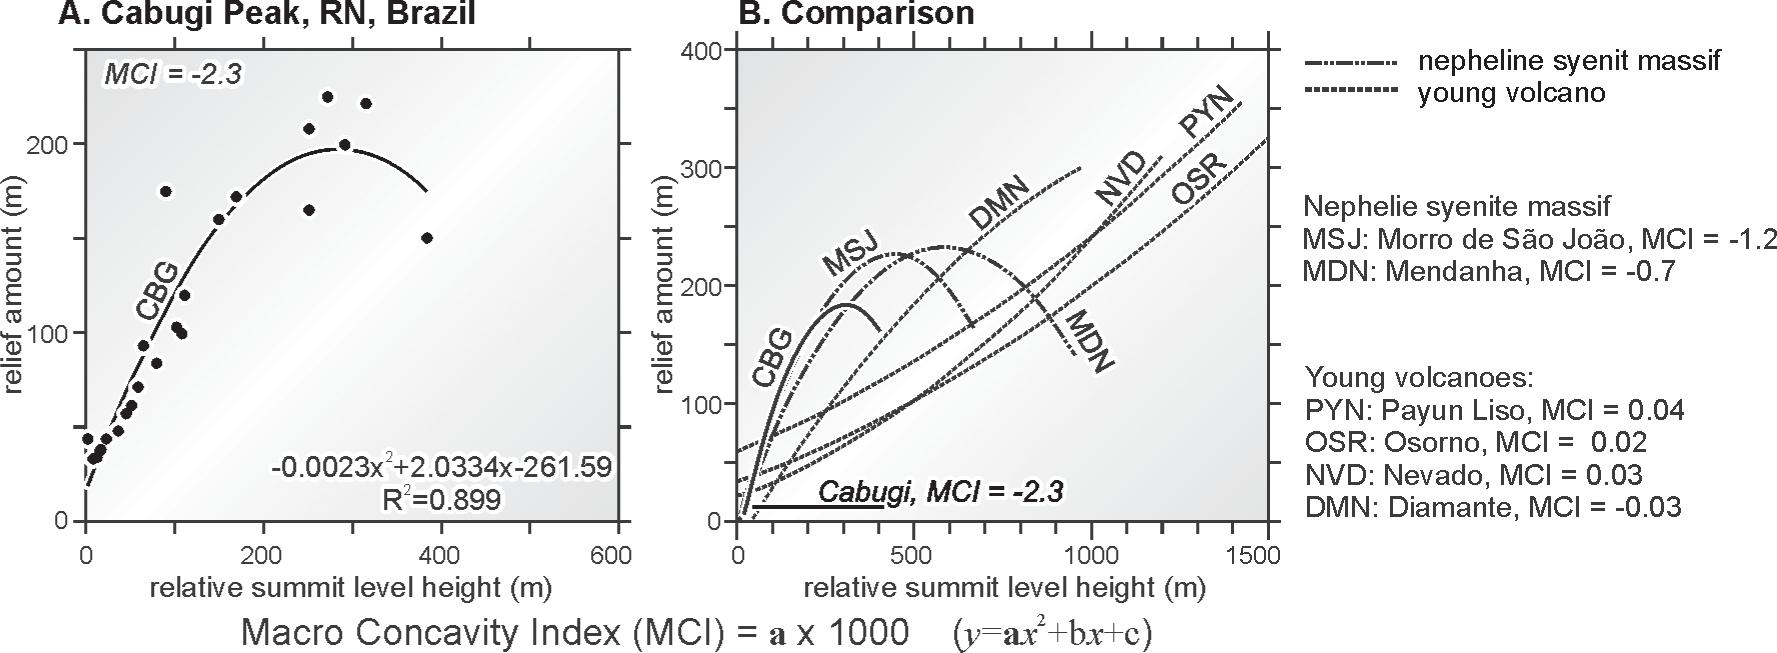
The three-dimensional form of a massif is expressed by the diagram of summit level (horizontal axis) vs. relief amount (vertical axis). The “a” constant of the quadric equation (y=ax2+bx+c) of the second order polynomial regression for the projected points is the key parameter. The MCI is defined to be 1000 times of the “a” constant (Figure 7).
The diagram for the calculation of MCI (Macro Concavity Index) using second order polynomial regression, after Motoki et al. (2012cMotoki A, Campos TFC, Fonseca VP and Motoki KF. 2012c. Subvolcanic neck of Cabugi Peak, State of Rio Grande do Norte, Brazil, and origin of its landform. REM-Revista Escola de Minas. Ouro Preto 65: 195-206., 2014)Motoki A, Silva, S, Sichel SE and Motoki KF. 2014. Morphologic analyses by summit level and base level maps based on the ASTER GDEM for Morro de São João felsic alkaline massif, State of Rio de Janeiro, Brazil. Geociências, Rio Claro 32: 11-25.. CBG - Cabugi Peak (Rio Grande do Norte, Brazil); MSJ - Morro de São João massif; MDN - Mendanha alkaline massif (Rio de Janeiro, Brazil); DMN - Cerro de Diamante volcano, NVD - Nevado volcano; PYN - Payún Liso volcano (Mendoza, Argentina), OSR - Osorno volcano (Chile).
The utility of MCI parameter is indicated for the purpose of geomorphological comparison between intrusive massifs and volcanic edifices. Although it is useful to distinguish cold-spots form normal spreading zones, a more adequate geomorphologic index is in development.
Free-Air Anomaly
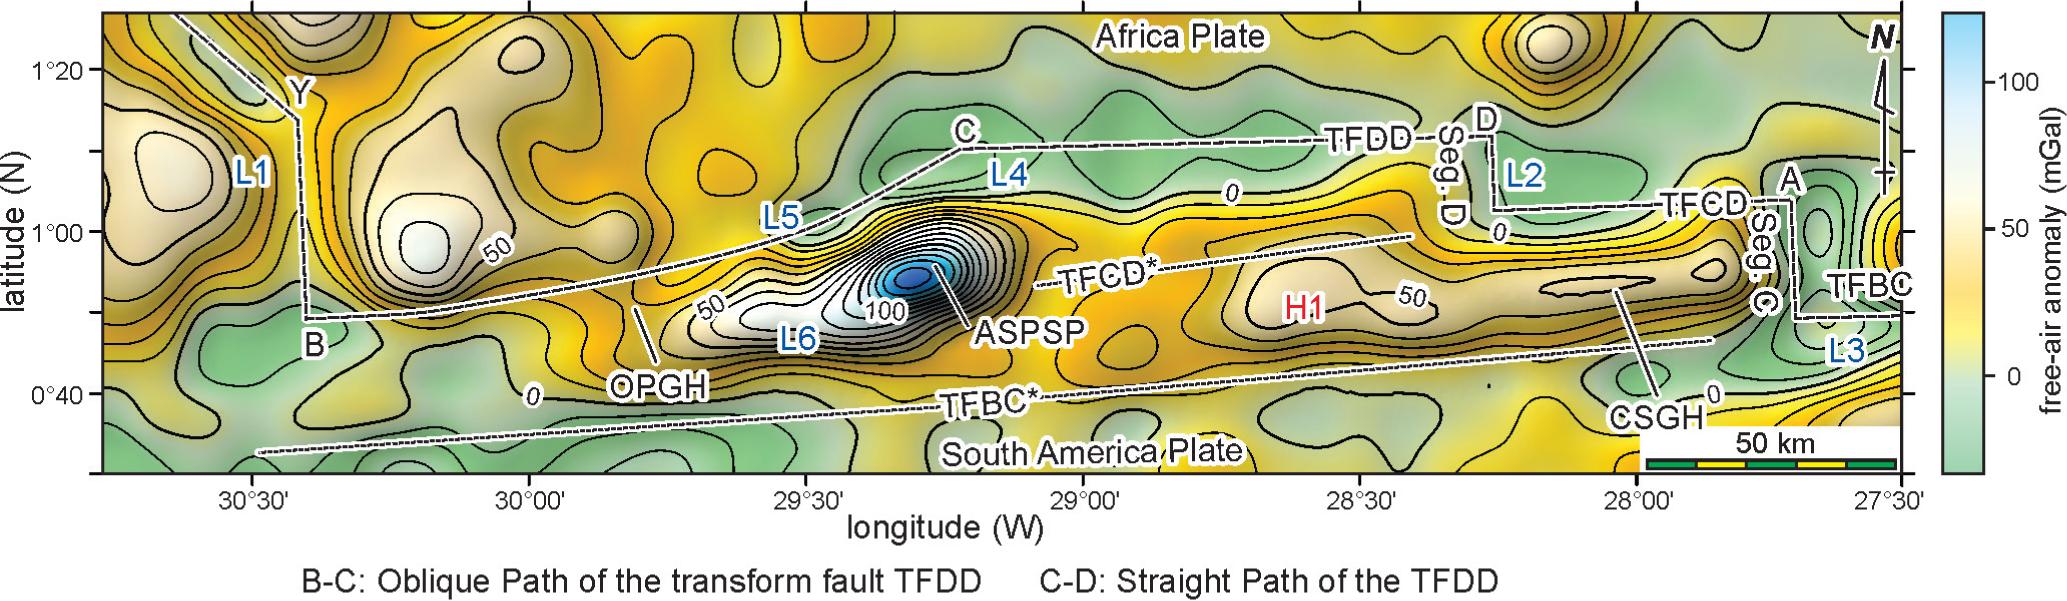
Figure 8 shows free-air anomaly map for the studied area based on EGM2008. The free-air anomaly is low along the mid-ocean ridge (Point B-Y, L1, 30°25′W), being about 0 mGal. The ridge segments (e.g. Point A, L3, Segment C, 28°40′W) and transform fault (e.g. TFCD, L2, 1°14′N, TFBC, L3, 1°05′N) also show low free-air anomalies, ranging from -30 to -40 mGal. The abyssal fracture zones (e.g. TFBC*, 0°40′N) have low free-air anomaly of about -10 mGal.
Free-air anomaly map in mGal based on EGM2008 data set. The plate boundary is according to the proposal of Sichel et al. (2011). The name of the transform faults, abyssal fracture zones, and mid-ocean ridge segments are the same of Figure 1.
Along the B-C span of the transform fault TFDD (Figure 8), low free-air zones of about -20 mGal are found close do Point B and Point C (L4, L5). These low free-air zones corroborate the idea that the TFDD is an active transform fault.
Previous papers considered that TFCD* would be an active transform fault (e.g. Hekinian et al. 2000Hekinian R, Juteau T, Gracia E, Udintsev G, Sichler B, Sichel SE and Apprioual R. 2000. Submersible observations of Equatorial Atlantic Mantle: The St. Paul Fracture Zone region. Mar Geophys Res 21: 529-560.). However, the free-air data supports that the plate boundary is situated along TFDD (B-C-D; Sichel et al. 2011). The low free-air anomaly along the C-D span can be attributed to: 1) Deep zone with little amount of sediment fill which does not appear in the satellite-derived topographic map due to the limited map resolution; 2) Basement depression filled by thick sedimentary deposits. The low free-air zone along the C-D span is wide, about 30 km. Therefore, the absence of linear morphologic depression in Global Topography ver. 14.1 cannot be attributed to low data resolution. In this case, the low free-air anomaly can be attributed to sedimentary cover of 2000 to 3000 m of thickness. The low free-air anomaly zone close to Point D (L2) is also attributed to thick sedimentary cover for the same reason.
The central part of B-C span has relatively high free-air anomaly, which is called Oblique Path Gravimetric High (OPGH, Figure 8). In spite of the high free-air anomaly, a little superior to 30 mGal, this site is deep, more than 4000 m (Figure 1).
The Saint Peter and Saint Paul peridotite ridge shows a strongly high free-air anomaly of about 140 mGal. It is attributed, at least partially, to the morphologic elevation of 3500 in relative height. However, the effect of topographic high is not enough to justify this high free-air anomaly. Therefore, the free-air anomaly is also attributed to dense mantle rocks which constitute the peridotite ridge.
To the south of TFCD*, that is, to the west of Segment C, there is an east-west trend range with high free-air anomaly zone of 50 mGal, called C-Segment Gravimetric High (CSGH, Figure 8). The high free-air anomaly cannot be justified only by the topographic elevation of this hill with relative height of 1800 m, suggesting dense basement rocks.
Bouguer Anomaly
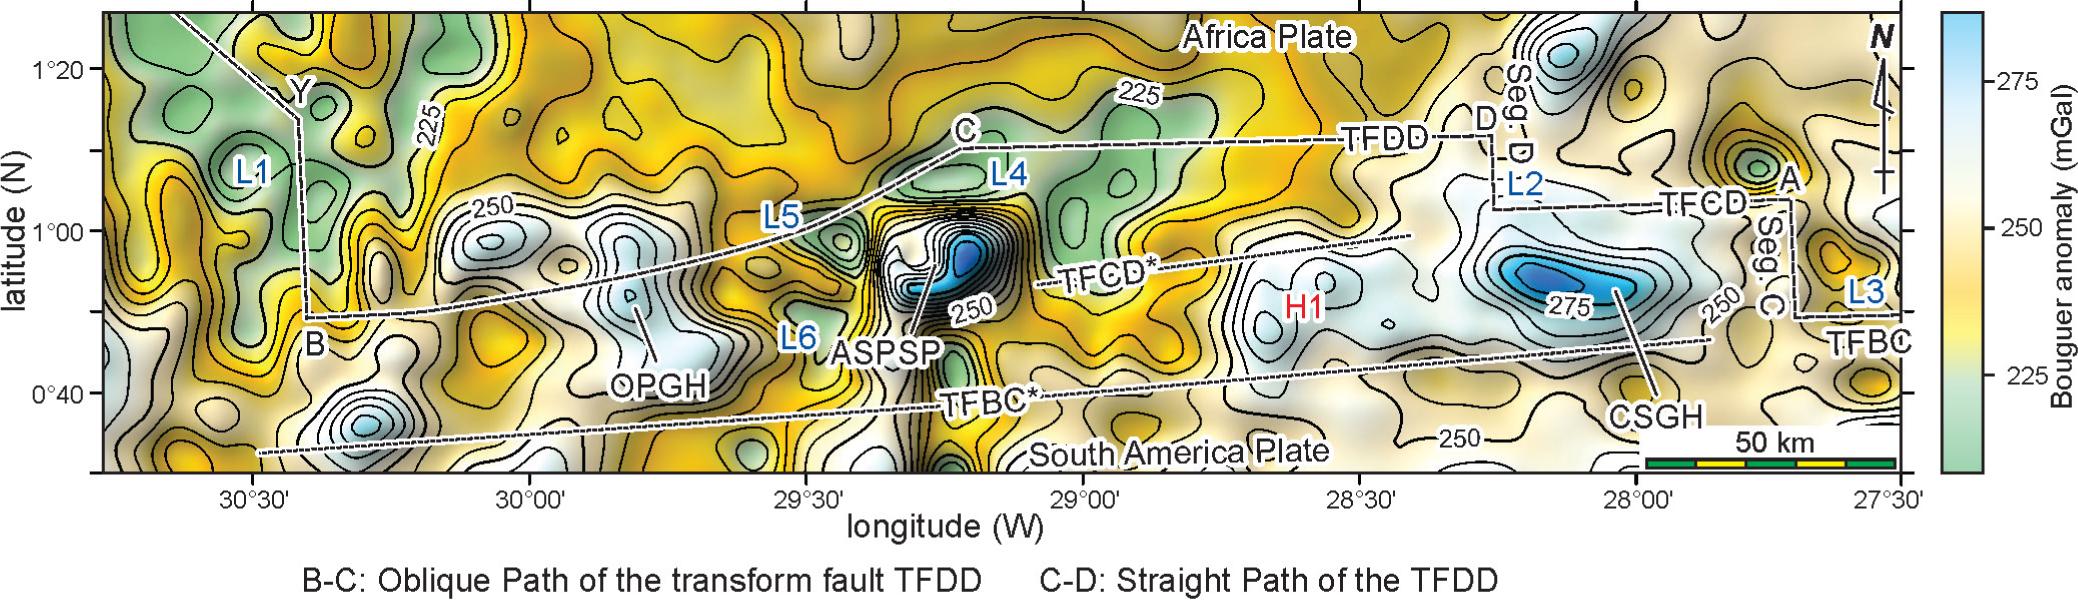
Figure 9 presents Bouguer gravity anomaly map based on EGM2008. The low Bouguer sites L4 and L5 are situated along the transform fault TFDD. These sites are deep basement and oceanic crust is thin. However, the TFDD structure on the Bouguer map is less relevant than that on the free-air (Figure 9) and topographic maps (Figure 1). In addition, the Bouguer anomaly map shows no feature along Segment D. The low free-air anomaly spot L2 has relatively high Bouguer anomaly. At this locality, there is a deep spot of 4500 m, called Saint Paul Deep (Figure 1).
Bouguer anomaly map based on EGM2008 database in mGal. The name of the transform faults, abyssal fracture zones, and mid-ocean ridge segments are the same of Figure 1. The plate boundary is after Sichel et al. (2011). The L1, L3, L4, L5, and L6 are low Bouguer sites and the H1 is high Bouguer site. The L2 is low in free-air but high in Bouguer.
In the studied area, there are three sites with characteristically high Bouguer Anomaly: 1) Saint Peter and Saint Paul peridotite ridge, at 29°10′W (ASPSP); 2) The high gravimetric site at about 50 km to the west of Segment C, 28°10′W (CSGH); 3) The gravimetric high site along the Oblique Path of the transform fault TFDD, 29°50′ (OPGH).
The peridotite ridge (ASPSP; Figure 9) has a Bouguer anomaly of 280 mGal, which is 45 mGal higher than the adjacent area. The high Bouguer spot (ASPSP) is present on the east-northeastern half of the Peridotite Ridge, which corresponds to the North Elevation. This site is underlain mainly by highly deformed dense mylonitic peridotite with limited serpentinisation (Figure 5B). The western half of the Peridotite Ridge has a low Bouguer anomaly (L6). This locality corresponds to the South Elevation. This hill is constituted mainly by undeformed serpentinised peridotite, which is less dense than the unserpentinised peridotite.
The CSGH has a 280 mGal Bouguer anomaly, which is 35 mGal higher than the adjacent area. This site is situated at about 50 km to the west of Segment C. Another high Bouguer site, 265 mGal (H1), occurs at about 50 km to the west (H1). This high Bouguer zone correlates with the high free-air zone (Figure 8). The gravimetric and geomorphologic features suggest that the carapace-shaped linear topographic elevation to the west of Segment C, could be a megamullion with base area of 1060 km2.
The OPGH has a Bouguer anomaly of 270 mGal. It occurs at a topographic low (Figure 1) with high free-air anomaly (Figure 8), suggesting possible presence abyssal mantle exposure on the transform fault wall.
Close to the mid-ocean ridge at 30°25′W (Point B, L1), there is a low Bouguer zone which is 25 to 30 mGal lower than the adjacent areas. The anomaly is not located exactly at the rift valley, but about 15 km to the west (Figure 9). The reason is unknown at this moment.
Gravimetric Data Interpretations
A hill sustained entirely by mechanical strength of the basement has free-air anomaly higher than the adjacent areas. If the hill is constituted by the same materials of the crust, the Bouguer anomaly has a flat pattern (Figure 10A). Between altitudes and free-air anomalies of the area around the hill, there is a positive correlation trend (Figure 10A-1). The gradient is defined by the density of the hill. A hill sustained by active tectonic uplift also has the same characteristics.
Geologic structure models suggested by topographic and gravimetric data, modified from Motoki (2013)Motoki KF. 2013. Gravimetria da cadeia peridotítica de São Pedro e São Paulo, Oceano Atlantico Equatorial com base nos dados de satélites. Monografia de Graduação, Departamento de Geologia, Universidade Federal Fluminense, Niterói, Brasil, 38 p. (Unpublished).: A) Hill sustained entirely by mechanical strength of the basement or active tectonic uplift; B) Hill sustained also by small effect of isostatic compensation; C) Hill with large effect of isostatic compensation.
When a small effect of isostatic compensation occurs, Bouguer anomaly on the hill becomes lower than the adjacent areas (Figure 10B). The gradient on the free-air anomalies vs. altitudes diagram becomes steeper (Figure 10B-1) and the Bouguer anomalies show a negative correlation to the free air anomalies (Figure 10B-2). When the isostatic effect is large, these diagrams show sub-vertical trends (Figure 10C-1, C-2).
In fact, most of the seamounts are volcanic edifices constituted by extrusive bodies, such as pillow lava and hyaloclastite, which are less dense than oceanic crust. Although the isostatic compensation effect is not present, volcanic seamounts have Bouguer anomaly depression like the pattern of Figure 10B.
Thus, the satellite-derived bathymetric and gravimetric data projected on the diagrams of free-air vs. altitude and free-air vs. Bouguer provide interpretative models for local and regional geologic structures. In this sense, these diagrams are called gravimetric interpretation diagrams (Motoki 2013Motoki KF. 2013. Gravimetria da cadeia peridotítica de São Pedro e São Paulo, Oceano Atlantico Equatorial com base nos dados de satélites. Monografia de Graduação, Departamento de Geologia, Universidade Federal Fluminense, Niterói, Brasil, 38 p. (Unpublished)., Motoki et al. 2014).
Figure 11 shows interpretation diagrams for the studied area (A) and around Saint Peter and Saint Paul peridotite ridge (B). The line of basement strength sustention is calculated adopting the density of submarine hill as 2.83 and that of seawater as 1.03. These areas show similar plot patterns and diagram B presents detailed local characteristics.
Satellite-derived topographic and gravimetric data projected on the gravimetric interpretation diagrams: A) Whole studied area; B) Around Saint Peter and Saint Paul peridotite ridge. The data area for diagram B is indicated by Figure 1 as Area 3.
The diagram of free-air vs. depth shows q data trend sub-parallel to the line of the basement strength sustention, represented by the gentle curve SPSP. Most of the data of this trend are originated from the slopes of the Saint Peter and Saint Paul Peridotite Ridge. These diagrams indicate that the landform of the peridotite ridge is sustained by mechanical strength of the basement or dynamic process of the active uplift. The curvature of the SPSP span suggests that the upper portion of the peridotite ridge is slightly less dense than the lower portion, probably due to serpentinisation on the massif surface.
The data of the sites deeper than 3500 m are originated from ridge segments (RGS, Figure 11A), transform faults (L5), and abyssal fracture zones. Their subvertical trends on these diagrams suggest that these morphologic depressions are supported with the help of a strong effect of isostatic compensation.
Structure of the Peridotite Ridge
The Saint Peter and Saint Paul Rocks expose highly deformed mylonitic peridotite, which is exposed along an old transform fault (Figure 6B). However, the mylonitic structure is not oriented parallel to the transform faults, but is highly irregular, suggesting a recent deformation event. The peridotite ridge is high and dense however, active uplift is unlikely for a transform fault zone.
An opinion which can explain the genesis of peridotite ridges is serpentine protrusion model (Bonatti 1976Bonatti E. 1976. Serpentine protrusions in the oceanic crust. Earth Planet Sc Lett 32: 107-113., 1978Bonatti E. 1978. Vertical tectonism in oceanic fracture zones. Earth Planet Sc Lett 37: 369-379.). If the peridotite ridge is made up almost completely of serpentinised mantle peridotite, the serpentinite-rich mantle rock massif can rise up by isostatic compensation.
This model requires high-grade serpentinisation of the mantle rocks, but the actual state of serpentinisation appears to be only partial. At Belmont Island of Saint Peter and Saint Paul Rocks, there is an unserpentinised peridotite core with an extension of 100 m (Figure 4; 5A). Even in the serpentinised zones, some outcrops show serpentinisation only along the fractures, exhibiting macro-scale kerner structure (Figure 5B). Some apparently serpentinised samples have micro-scale kernel texture, remaining unserpentinised cores (Figure 5C). The observed serpentinisation grade seems to be too low to advocate Bonatti's model.
The satellite-derived Bouguer anomaly map demonstrates that there is a high Bouger locality at the eastern end of the ridge, where the Saint Peter and Saint Paul Rocks occur (Figure 9). This observation indicates that the highest part of the Peridotite Ridge is made up mainly of unserpentinised peridotite and that the serpentinisation could be limited to the surface zone and along deep fractures (Figure 12).
Schematic cross section for the serpentinisation of Saint Peter and Saint Paul peridotite ridge, Equatorial Atlantic Ocean. The scale is not exact.
If the Peridotite Ridge was formed by means of serpentine protrusion, it should be in isostatic equilibrium. However, the free-air anomaly is remarkably high, about 150 mGal, which is far from the isostatic compensation value of -70 mGal (Figure 9, 11B). The peridotite ridge is in fact dense and should be subsiding. Thus, it may be sustained mainly by the driving force of uplift (Sichel et al. 2011).
The serpentinisation of the exhumed abyssal mantle massif develops from the surface zone to the nucleus. The volume expansion of serpentinisation creates fractures of random directions. They can help sea water percolation and consequent advance of serpentinisation into the peridotite massif. However, in the deep within the massif, the fractures would not open because of the weight of the overlying rocks and water penetration would be prevented. In this way, the nucleus of the pedidotite massif is protected from serpentinisation and remains intact.
A similar phenomenon is known in the oxidation of aluminium, zinc, and stainless steel, called passivity in chemistry. Nepheline syenite massifs have strong erosive resistance under wet tropical climates (Petrakis et al. 2010Petrakis GH, Motoki A, Sichel SE, Zucco LL, Aires JR and Mello SLM. 2010. Ore geology of special quality gravel and artificial sand: examples of alkaline syenite of Nova Iguaçu, State of Rio de Janeiro, and rhyolite of Nova Prata, State of Rio Grande do Sul, Brazil. Geociências, Rio Claro 29: 21-32.) in spite of the chemical vulnerability of the rock forming minerals. The clay mineral rich regolith is impermeable and it protects the rock body, phenomenon called weathering passivity (Motoki et al. 2008Motoki A, Petrakis GH, Sichel SE, Cardoso CE, Melo RC, Soares RS and Motoki KF. 2008. Landform origin of the Mendanha Syenitic Massif, State of Rio de Janeiro, Brazil, based on the geomorphological analyses by summit level map technique. Geociências, Rio Claro 27: 99-115.). In the case of the Saint Peter and Saint Paul peridotite ridge, the corresponding phenomen shall be called serpentinisation passivity.
Genesis of the Tectonic Uplift
Figure 13 shows a detailed oblique topographic view of the peridotite ridge (ASPSP) based on the Global Topography ver. 14.1. It has ENE-WSW trends, being sub-parallel to the transform faults and abyssal fracture zones. It is very high and has steep cliffs on the slopes. For example, the relative heights of the hills parallel to the rift valley BA5 and BA6 are, respectively, 1200 m and 1000 m, but that of the peridotite ridge is 3800 m.
Detailed submarine morphology for the area of the Saint Peter and Saint Paul peridotite ridge, based on Global Topography ver. 14.1. The abbreviations are the same as in Figure 1. The TFDD is the plate boundary proposed by Sichel et al. (2011) and the TFCD*, the longitudinal graben recognised by Hekinian et al. (2000)Hekinian R, Juteau T, Gracia E, Udintsev G, Sichler B, Sichel SE and Apprioual R. 2000. Submersible observations of Equatorial Atlantic Mantle: The St. Paul Fracture Zone region. Mar Geophys Res 21: 529-560..
This figure shows that the morphological depression of the TFDD is much more pronounced than that of the TFCD* longitudinal graben (Sichel et al. 2011). Therefore, it is plausible that an active transform fault is present along the TFDD depression rather than along the TFCD* longitudinal graben (Hekinian et al. 2000Hekinian R, Juteau T, Gracia E, Udintsev G, Sichler B, Sichel SE and Apprioual R. 2000. Submersible observations of Equatorial Atlantic Mantle: The St. Paul Fracture Zone region. Mar Geophys Res 21: 529-560.).
At the coordinate of 29°28′W, 1°3′N, which is close to the L5 (Figure 8, 9), a conical hill is present on the maps of Figure 12. Its perfect conical shape makes it to be interpreted not as a real submarine feature. Morphologic elevations are generally associated with notable free-air anomalies, but this isolated peak has no free-air feature (Figure 8). Therefore, it is probable that this peak is a false one caused by artificial effects of data noise.
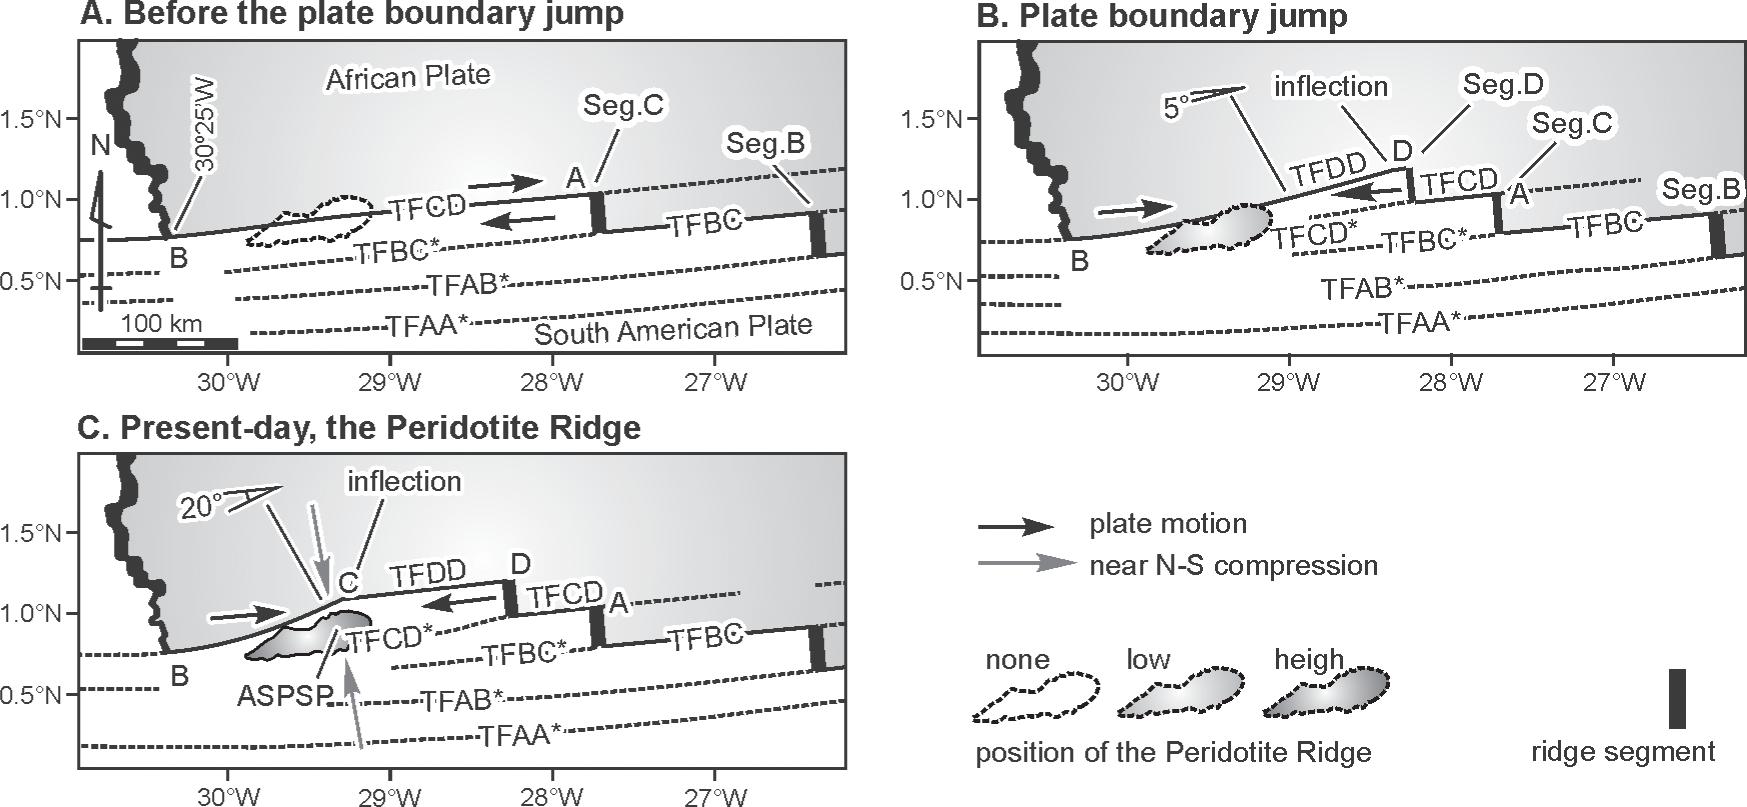
According to the plate boundary along TFDD, Sichel et al. (2011) proposed pressure-ridge model for Saint Peter and Saint Paul peridotite ridge and the active uplift which is caused by the near north-south compression stress. The compression is evidenced by the: 1) Conjugated fracture system with compression axis varying from N5°W to N15°W; 2) Focal mechanism of the earthquakes close to the peridotite ridge, indicating the compression of N15°W (Figure 14); 3) Direction of the peridotite ridge of N75°E.
Epicentres and focal mechanisms of the earthquake of the period from 1971 to 1988 after the data of Wolfe and McNutt (1991)Wolfe CJ and McNutt MK. 1991. Compensation of Cretaceous seamounts of the Darwin Rise, northwest Pacific Ocean. J Geophys Res 96: 2363-2374..
These authors emphasized the emergence of Segment D and consequent plate boundary jump about 25 km to the north. The new transform fault, called TFDD, is not exactly parallel to the relative movement between the South American Plate and the African Plate. The direction discordance generates compression sub-perpendicular to the transform fault in this transform fault zone. The compression has squeezed out the abyssal mantle from plastic deformation depth up to sea level (Figure 15). In this sense, the North Elevation of Saint Peter and Saint Paul Peridotite Ridge, where Saint Peter and Saint Paul Rocks occur, is not a megamullion, that is, a mantle core complex, but a peculiar geotectonic result of sub-crustal abyssal mantle exhumation.
Schematic illustrations for the active uplift of Saint Peter and Saint Paul peridotite ridge, Equatorial Atlantic Ocean, modified from Sichel et al. (2011): A) Before the plate boundary jump at 8 Ma, with 3 ridge segments in the conventional layout; B) Emergence of Segment D at 8 Ma and plate boundary jump from TFCD* to TFDD; C) Present-day state, with increasing near north-south compression and the consequent accelerating uplift of the Peridotite Ridge.
Based on the half spreading rate of 1.5 cm/year combined with the distance between the inflection point (Point C, Figure 14C) and Segment D (Point D), the above-mentioned authors considered that the plate boundary jump occurred at c.a. 8 Ma.
The above-mentioned tectonic evolution model reasonably explains all of the geologic and geophysical observations without contradictions. However, the existence of Segment D, which is the most important factor, has not been verified yet by shipborne studies. Actual resolution of Global Topography ver. 14.1 is not enough. The absence of Segment D on the map (Figure 1) could be due to insufficient map resolution and could also be attributed to real absence of the expected plate boundary morphologies which are buried by thick sediments.
Contrasted Thermal States
Saint Paul transform fault zone is characterised by underlain low temperature mantle, being a cold-spot. Therefore, a strong morphologic contrast is observed between cold South American Plate and hot African Plate. It is well-expressed by the submarine morphology.
Based on the summit level and base level technique, Motoki et al. (2012cMotoki A, Campos TFC, Fonseca VP and Motoki KF. 2012c. Subvolcanic neck of Cabugi Peak, State of Rio Grande do Norte, Brazil, and origin of its landform. REM-Revista Escola de Minas. Ouro Preto 65: 195-206., 2014)Motoki A, Silva, S, Sichel SE and Motoki KF. 2014. Morphologic analyses by summit level and base level maps based on the ASTER GDEM for Morro de São João felsic alkaline massif, State of Rio de Janeiro, Brazil. Geociências, Rio Claro 32: 11-25. proposed the Macro Concavity Index (MCI), a parameter in order to evaluate three-dimensional form of massifs. When the massif has general concave morphology, the MCI takes a negative value. When the massif has convex morphology, the MCI is positive or close to zero.
The rectangular area 1 of Figure 1 is located in the block to the north of the transform fault TFDD. This area belongs to the African Plate and a rift valley of normal magmatic spreading is present at 30°25′W (Figure 1). The submarine morphology is characterised by ridges and valleys of north-south trend. The valleys are narrow and hills are wide, and therefore, MCI for this area is negative, being -0.20 (Figure 16A). At about 50 km to the north of Point B (Figure 1), there is a Y-shaped rift valley along the mid-ocean ridge (Point Y). Two branches are actively spreading and one is now inactive. These features are common in conventional magmatic spreading plate boundaries.
MCI diagrams based on the summit level and base level surface of the grid interval of 7.5 km for the areas of : A)Mid-ocean ridge and breakaways in the African Plate, rectangular area 1; B) Abyssal fracture zone in the South American Plate, rectangular area 2; C) Saint Peter and Saint Paul Peridotite Ridge, rectangular area 3. The localities of the rectangular data areas 1, 2, and 3 are shown on Figure 1.
The rectangular area 2 (Figure 1) is situated in the South American Plate. Its submarine morphology is characterised by transform faults and abyssal fracture zones of east-west trend. The hills are narrow and the valleys are wide and shallow, thus the MCI is positive, being 0.20 (Figure 16B). The topographic features have an east-west orientation which is sub-perpendicular to the mid-ocean ridge. The transform faults and abyssal fracture zones are highly linear and ridge segments are short. These characteristics are strongly contrasted with the rectangular area 1. There is a confirmed exhumed mantle massif (ASPSP, Figure 8) and two other candidates (OPGH, CSGH).
The rectangular area 3 (Figure 1) contains Saint Peter and Saint Paul peridotite ridge. The abyssal mantle massif is characterised by very steep slopes, and therefore, the MCI is close to zero (Figure 16C). This value is unlikely for the carapace-like morphologic elevation of megamullions. In order to clarify the genesis of the peculiar tectonism, detailed submarine geomorphologic studies are desired.
CONCLUSION
The Satellite-derived gravimetry and geomorphologic analyses for the studied area have led the authors to the following conclusions.
-
The free-air anomaly indicates that the present position of the transform fault, which marks the boundary between the South American Plate and the African Plate, is not along the longitudinal graben TFCD*, but along the transform fault TFDD, which is at about 20 km to the north of the graben. Therefore, the Saint Peter and Saint Paul Rocks are located on the South American Plate, and not, on the African Plate.
-
The Bouguer anomaly of the eastern half of the Saint Peter and Saint Paul peridotite ridge is notably high, being 45 mGal higher than the adjacent area. The peridotite ridge is constituted mainly by high density non-serpentinised mantle ultramafic rocks. The serpentinisation is limited to the surface zone of the peridotite massif. This idea is supported by geologic and petrographic observations.
-
The diagrams of free-air anomaly vs. depth and free-air anomaly vs. Bouguer anomaly, so-called gravimetric interpretation diagrams, indicate that the morphologic elevation of the peridotite ridge is sustained dynamically by active tectonic uplift.
-
The above-mentioned observations are favourable to the pressure-ridge model for the genesis of the peridotite ridge, and are unfavourable to that of serpentine protrusion. The near north-south compression has squeezed out the abyssal mantle from ductile deformation depth up to sea level, forming the Peridotite Ridge.
-
The emergence of Segment D and the consequent plate boundary jump from TFCD* to TFDD could generate the directional difference between plate movement and transform fault direction. This model is consistent with almost all of the available data. However, existence of Segment D has not been confirmed yet by shipborne studies.
The studies for the present paper have been performed with the help of high duty machines of the informatics and high-speed broad band networks. The hardware was acquired through the financial supports of Fundação Carlos Chagas Filho de Amparo à Pesquisa do Estado do Rio de Janeiro (FAPERJ) and Petróleo Brasileira S.A. (PETROBRAS). This paper partially represents the Bachelor's Degree monograph of the first author Kenji Freire Motoki, concluded at the Department of Geology, Federal Fluminense University, Brazil. The authors are grateful to these institutions.
REFERENCES
- Aires JR, Motoki A, Motoki KF, Motoki DF and Rodrigues JG. 2012. Geomorphological analyses of the Teresópolis Plateau and Serra do Mar Cliff, State of Rio de Janeiro, Brazil with the help of summit level technique and ASTER GDEM, and its relation to the Cenozoic tectonism. Anuário de Instituto de Geociências da Universidade Federal do Rio de Janeiro 35: 105-123.
- Binard N, Stoffers P, Hekinian R and Searle RC. 1996. Intraplate en echelon volcanic ridges in the South Pacific west of the Easter microplate. Tectonophysics 263: 23-37.
- Bonatti E. 1976. Serpentine protrusions in the oceanic crust. Earth Planet Sc Lett 32: 107-113.
- Bonatti E. 1978. Vertical tectonism in oceanic fracture zones. Earth Planet Sc Lett 37: 369-379.
- Bonatti E, Seyler M and Sushevskaya N. 1993. A Cold Suboceanic mantle belt at the Earth's Equator. Science 261: 315-320.
- Calmant S. 1994. Seamount topography by least-squares inversion of altimetric geoid heights and shipborne profiles of bathymetry and/or gravity anomalies. Geophys J Int 119: 428-452.
- Campos TFC, Bezerra FHR, Srivastava NK, Vieira MM and Vita-Finzi C. 2010. Holocene tectonic uplift of the St Peter and St Paul Rocks (Equatorial Atlantic), consistent with emplacement by extrusion. Mar Geol 271: 177-186.
- Campos TFC, Virgens Neto J, Amorim VA, Hartmann LA and Petta RA. 2003. Modificações metassomáticas das rochas milonitizadas do complexo ultramáfico do Arquipélago de São Pedro e São Paulo, Atlântico Equatorial. Geochim Bras 17: 81-90.
- Campos TFC, Virgens Neto J, Srivastava NK, Petta RA, Harmann LA, Moraes JFS, Mendes L and Silveira SRM. 2005. Arquipélago de São Pedro e São Paulo e São Paulo, soerguimento tectônico de rochas infracrustais no Oceano Atlântico. Sítios Geológicos e Paleontológicos do Brasil, SIGEP 002, UNB, 12 p. http://www.unb.br/ig/sigep/sitio002/sitio002.pdf. Access: Dec. 31, 2006.
» http://www.unb.br/ig/sigep/sitio002/sitio002.pdf - Couto EVM, Frotes E, Sordi MV, Marques AJ and Camolezi BA. 2012. Seppômen maps for geomorphic developments analysis: the case of Paraná plateau border, Faxinal, State of Paraná, Brazil. Technology, Maringá, Acta Sci 34: 71-78.
- De Alteriis G, Gilg-Capar L and Olivet JL. 1998. Matching satellite-derived gravimetry signatures a seismicity patterns along mid-ocean ridges. Terra Nova 10: 177-182.
- Etnoyer P. 2005. Seamount resolution in satellite-derived bathymetry. Geochem Geophys Geosyst 6: Q03004, 8 p.
- Gung Y and Romanowicz B. 2004. Q tomography of the upper mantle using three component long period waveforms. Geophys J Int 157: 813-830.
- Hekinian R, Juteau T, Gracia E, Udintsev G, Sichler B, Sichel SE and Apprioual R. 2000. Submersible observations of Equatorial Atlantic Mantle: The St. Paul Fracture Zone region. Mar Geophys Res 21: 529-560.
- Melson WG, Jarosewich E, Bowen VT and Thompson G. 1967. St. Peter and St. Paul rocks: a high-temperature mantle-derived intrusion. Science 155: 1532-1535.
- Motoki A, Campos TFC, Fonseca VP and Motoki KF. 2012c. Subvolcanic neck of Cabugi Peak, State of Rio Grande do Norte, Brazil, and origin of its landform. REM-Revista Escola de Minas. Ouro Preto 65: 195-206.
- Motoki A, Geraldes MC, Iwanuch W, Vargas T, Motoki KF, Balmant A and Ramos MN. 2012b. Pyroclastic dyke and welded crystal tuff of the Morro dos Gatos alkaline intrusive complex, State of Rio de Janeiro, Brazil. REM-Revista Escola de Minas, Ouro Preto 65: 35-45.
- Motoki A, Motoki KF and Melo DP. 2012a. Submarine morphology characterization of the Vitória-Trindade Chain and the adjacent areas, State of Espírito Santo, Brazil, based on the predicted bathymetry of the TOPO version 14.1. Rev Bras Geomorfol, Brasília 13: 403-415.
- Motoki A, Neves JLP and Vargas T. 2005. Quantitative colour analyses using digital specification technique for Mármore Bege Bahia, a representative Brazilian ornamental limestone of breccia-like texture. REM-Revista Escola de Minas. Ouro Preto 58: 113-120.
- Motoki A, Petrakis GH, Sichel SE, Cardoso CE, Melo RC, Soares RS and Motoki KF. 2008. Landform origin of the Mendanha Syenitic Massif, State of Rio de Janeiro, Brazil, based on the geomorphological analyses by summit level map technique. Geociências, Rio Claro 27: 99-115.
- Motoki A, Petrakis GH, Soares RS, Sichel SE and Aires JR. 2007. New method of semi-automatic modal analyses for phenocrysts of porphyritic rocks based on quantitative digital colour specification technique. REM-Revista Escola de Minas, Ouro Preto 60: 13-20.
- Motoki A, Sichel SE, Campos TFC, Srivastava NK and Soares RS. 2009. Present-day uplift rate of the Saint Peter and Saint Paul Islets, Equatorial Atlantic Ocean. REM-Revista Escola de Minas, Ouro Preto 62: 331-342.
- Motoki A, Silva, S, Sichel SE and Motoki KF. 2014. Morphologic analyses by summit level and base level maps based on the ASTER GDEM for Morro de São João felsic alkaline massif, State of Rio de Janeiro, Brazil. Geociências, Rio Claro 32: 11-25.
- Motoki A, Zucco LL, Sichel SE, Neves JL and Aires JR. 2006. Development of the technique for digital colour specification and the new nomenclatures of ornamental rock based on the measured colours. Geociências, Rio Claro 26: 151-160.
- Motoki KF. 2013. Gravimetria da cadeia peridotítica de São Pedro e São Paulo, Oceano Atlantico Equatorial com base nos dados de satélites. Monografia de Graduação, Departamento de Geologia, Universidade Federal Fluminense, Niterói, Brasil, 38 p. (Unpublished).
- Pavlis NK, Holmes SA, Kenyon SC and Factor JK. 2012. The development and evaluation of the Earth Gravitational Model 2008 (EGM2008). J Geophys Res: Solid Earth 177-B4: 4406.
- Petrakis GH, Motoki A, Sichel SE, Zucco LL, Aires JR and Mello SLM. 2010. Ore geology of special quality gravel and artificial sand: examples of alkaline syenite of Nova Iguaçu, State of Rio de Janeiro, and rhyolite of Nova Prata, State of Rio Grande do Sul, Brazil. Geociências, Rio Claro 29: 21-32.
- Rivalenti G, Mazzucchelli M, Girardi VAV, Vannucci RV, Barbieri MA, Zanetti A and Goldstein SL. 2000. Composition and processes of the mantle lithosphere in northeastern Brazil and Fernando de Noronha: evidence from mantle xenoliths. Contributions to Mineralogy and Petrology 138: 308-325.
- Sandwell DT and Smith WH. 2009. Global marine gravity from retracked Geosat and ERS-1 altimetry: Ridge segmentation versus spreading rate. J Geophys Res 114: B01411.
- Schilling M, Conceição RV, Mallmann G, Koester E, Kawashita K, Hervé F, Morata D and Motoki A. 2005. Spinel-facies mantle xenoliths from Cerro Redondo, Argentine Patagonia: Petrographic, geochemical, and isotopic evidence of interaction between xenoliths and host basalt. Lithos 82: 485-502.
- Sial AN, Long LE, Pessôa DAR and Kawashita K. 1981. Potassium-argon ages and strontium isotope geochemistry of Mesozoic and Tertiary basaltic rocks, northeastern Brazil. An Acad Bras Cienc 53: 115-122.
- Sichel SE, Esperança S, Motoki A, Maia M, Horan MF, Szatmari P, Alves EC and Mello SLM. 2008. Geophysical and geochemical evidence for cold upper mantle beneath the Equatorial Atlantic Ocean. Rev Bras Geofís 26: 69-86.
- Sichel SE et al. 2011. A origem e a evolução geotectônica do manto exumado da Cadeia Peridotítica de São Pedro e São Paulo, Oceano Atlântico Equatorial. Boletim de Geociências da Petrobras, Rio de Janeiro 20: 97-128.
- Silva S. 2010. Interpretação morfológica baseada nas técnicas de seppômen e sekkokumen dos maciços alcalinos do Estado do Rio de Janeiro. Tese de Mestrado, Departamento de Geologia, Universidade Federal Fluminense, Niterói, Brasil, 123 p. (Unpublished).
- Smith WH and Sandwell DT. 1994. Bathymetric prediction from dense satellite altimetry and sparse shipboard bathymetry. J Geophys Res 99-B2: 21803-21824.
- Smith WH and Sandwell DT. 1997. Global sea floor topography from satellite altimetry and ship depth soundings. Science 277: 1957-1962.
- Tilley CE. 1947. Dunite mylonite of St. Paul's rocks (Atlantic). Am J Sci 245: 483-491.
- Wessel P. 1997. Sizes and Ages of Seamounts Using Remote Sensing: Implications for Intraplate Volcanism. Science 277: 802-805.
- Wolfe CJ and McNutt MK. 1991. Compensation of Cretaceous seamounts of the Darwin Rise, northwest Pacific Ocean. J Geophys Res 96: 2363-2374.
Publication Dates
-
Publication in this collection
June 2014
History
-
Received
13 Nov 2012 -
Accepted
5 June 2013