Abstracts
Estimate efficiently of the whitefly population (Bemisia tuberculata Bondar) in cassava, to assist in decision making of pest control is one of the advantages of sequential sampling plans. Therefore, the objective of this study was to determine a sequential sampling plan according to two methods of pest management, using biological and/or chemical control. Samples were obtained in a commercial field of 2.500,00 m2, divided into 100 plots. The visualization method was used for sampling of the upper leaves by counting the number of adults. In total 15 samples were taken weekly from January to April 2012. The spatial distribution model which best fit to the behavior of B. tuberculata adults was the negative binomial distribution. Levels adapted for biological and chemical control were five and twenty adults per plant, respectively. Sampling plans resulted in two decisions for each proposed method. Thus, for population control the upper limit was defined as S1 = 4.2056 + 2.1540n (biological) and S1 = 20.219 + 10.4306n (chemical); and the lower limit where the pest control is not recommended was defined by S0 = -4.2056 + 2.1540n (biological) and S0 = -20.219 + 10.4306n (chemical). Sequential sampling estimated the maximum number of sample units necessary for decision-making of three samples with 1.34 adults for biological control and 3.85 sample units with 7.39 adult pests for chemical control.
Decision-making; level of damage; Manihot esculenta ; pest management; whitefly
Estimar a população de mosca-branca Bemisia tuberculata Bondar em mandioca, de forma eficiente, para auxiliar na tomada de decisão de controle é uma das vantagens dos planos de amostragem sequencial. Por isto, o objetivo deste trabalho foi determinar planos de amostragem sequencial, na tomada de decisão do manejo da praga em questão, ou seja, visando a utilização do controle biológico e/ou químico. Foram realizadas amostragens em uma lavoura comercial de 2.500,00 m2, divididos em 100 parcelas. Para a amostragem utilizou-se o método de visualização das folhas apicais contando o número de adultos observados. No total foram realizadas 15 amostragens semanais de janeiro à abril de 2012. O modelo de distribuição espacial que melhor se ajustou ao comportamento de adultos de B. tuberculata foi à distribuição binomial negativo. Adotaram-se os níveis de controle de cinco adultos por planta para o controle biológico e vinte para controle químico. Os planos de amostragem resultaram em duas tomadas de decisão para cada método proposto. Assim, para o controle de população, a linha superior, é definida por S1 =4,2056 + 2,1540n (biológico) e S1 = 20,219 + 10,4306n (químico); o limite inferior, onde o controle da praga não é recomendado, é definida por S0 =-4,2056+ 2,1540n (biológico) e S0 = -20,219 + 10,4306n (químico). A amostragem sequencial estimou o número máximo de unidade amostrais para a tomada de decisão de três unidades amostrais com 1,34 adultos para o controle biológico e 3,85 unidades amostrais com 7,39 adultos da praga para o controle químico.
tomada de decisão; nível de dano; Manihot esculenta ; manejo de pragas; mosca branca
INTRODUCTION
Bemisia tuberculata Bondar is considered the major pest of cassava crop (Angel et al. 1990Angel JC, Pineda BL, Nolt B and Velasco AC. 1990. Mosca blanca (Homoptera: Aleyrodidae) asociadas a transmisión de vírus em yuca. Fitopat Colomb 13: 65-71.). Direct losses are caused by sucking of sap, potentially causing reduced plant vigor, defoliation, wilting, chlorotic spots and premature leaf fall. Indirect losses involve fungi growth (sooty mold) on the excess sap which is excreted, which decreases the photosynthetic area of the plant (Bellotti et al. 2007Bellotti AC, Arias B, Herrera CJ and Holguín CM. 2007. Manejo integrado de moscas blancas asociadas al cultivo de la yucca. Centro Internacional de Agricultura Tropical, 22 p. Circular Técnica 358., Pietrowski et al. 2010Pietrowski V, Ringenberger R, Rheinheimer AR, Bellon PP, Gazola D and Miranda AM. 2010. Insetos-praga da cultura da mandioca na região centro oeste-sul do Brasil. Universidade do Oeste do Paraná, 40 p.). In general, the losses in yield of cassava, caused by the attack of whitefly, can be 23-80%, depending on the cultivar and the duration and intensity of incidence (Schimitt 2002Schimitt AT. 2002. Principais insetos pragas da mandioca e seu controle. In: CEREDA MP (Ed), Culturas de Tuberosas Amiláceas Latino-Americano, São Paulo: Fundação Cargil, São Paulo, Brasil, p. 350-369.).
In Brazil, chemical insecticides constitute the main control method, although they are based on recommendations for control of whitefly in other cultures because there are no recommended products for the control of this pest in cassava (Silva et al. 2012Silva AS, Kassab SO and Gaona JC. 2012. Insetos-pragas produtos e métodos de controle utilizados na cultura de mandioca em Ivinhema Mato Grosso do Sul. Rev Verde Desen Susten 7: 19-23.). The biological control with Beauveria bassiana (Bals.) Vuill. and Isaria sp. have potential to be used in controlling of this pest, however, this method is not frequently utilized (Potrich et al. 2011Potrich M, Neves PMOJ, Alves LAF, Pizzatto M, Silva ERL, Luckmann D, Gouvêa A and Roman JC. 2011. Virulência de fungos entomopatogênicos a ninfas de Bemisia tabaci (Genn.) (Hemiptera: Aleyrodidae). Semina-Cienc Agr 32: 1783-1792.).
In other countries management involves biological control with the entomopathogenic fungi Paecilomyces fumosoroseus (Wise), Lecanicillium lecanii (Zimmerman) Zare & Gams and B. bassiana, and chemical control in the treatment of cuttings using Thiamethoxan, Imidacloprid and foliar applications of Thiamethoxan, Imidacloprid, B- Cyfluthrin, Buprofezin and Etofenprox (Bellotti et al. 2007Bellotti AC, Arias B, Herrera CJ and Holguín CM. 2007. Manejo integrado de moscas blancas asociadas al cultivo de la yucca. Centro Internacional de Agricultura Tropical, 22 p. Circular Técnica 358.). However, the sampling criteria of pest population levels, for decision making, control or not, are not clear in the cassava crop for any method management (chemical and biological control) and the study of new technologies is important to optimize of sampling of B. tuberculata in field.
Successful management of insect pests involves the efficient sampling of target insects and their natural enemies (Fernandes et al. 2003Fernandes MG, Busoli AC and Barbosa JC. 2003. Distribuição espacial de Alabama argillacea (Hübner) (Lepidoptera: Noctuidae) em algodoeiro. Neotrop Entomol 32: 107-115.). For this purpose knowledge of insect sampling applied to estimates of population densities assists in decision-making by the producer of whether or not to control the target insect.
Therefore, sequential sampling has shown to be faster and more reliable than conventional sampling because the latter takes into account a fixed number of samples. Sequential sampling is characterized by using a variable number of sample units, depending on the size of the population sampled (Kogan and Herzog 1980Kogan M and Herzog DC. 1980. Sampling methods in soybean entomology. New York: Springer, 587 p.). In sequential sampling, assessment can rapidly classify the population of the target organism in categories such as low, medium or high, or even indicate whether it is necessary to adopt some measure of control. Thus, the moment of terminating sampling and making a decision depends on the results obtained in the previous steps (Wald 1945Wald A. 1945. Sequential test of statistical hypothesis. Ann Math Stat 16: 117-186.).
In the development of insect sequential sampling plans by the likelihood ratio method, three basic requirements are necessary which are: 1) acquiring a probability function that describes the spatial distribution of insects, 2) assess the level of damage in the form of two critical densities, such that economic damage can occurs if the population exceeds the upper limit previously established, and economic damage will not occur if the population remains below the defined lower limit, and 3) selection of maximum probability levels of making mistakes in the decision of population densities. Thus, predicting a nonharmful population density as being detrimental is called a type I error, and the probability of predicting a harmful density as not being detrimental is a type II error (Fernandes et al. 2003Fernandes MG, Busoli AC and Barbosa JC. 2003. Distribuição espacial de Alabama argillacea (Hübner) (Lepidoptera: Noctuidae) em algodoeiro. Neotrop Entomol 32: 107-115.).
Regarding the first requirement, the spatial distribution of organisms in the field can be considered as aggregated, uniform or random, which are statistically nominated Negative Binomial, Positive Binomial and Poisson, respectively. For each type of distribution, there are variations in the method to be used for establishing the sampling plan, due to various parameters involved. Regarding the second requirement, the limiting economic level is established in the form of two critical densities, where it can be affirmed that this has been one of the barriers to the development of sequential plans in Brazil.
The establishment of population levels usually requires long-term studies involving observations of crop cycle, plant physiology, pest damage, cost of control and production value, and these studies are scarce. However, according to Barbosa (1992)Barbosa JC. 1992. Métodos estatísticos aplicados à entomologia. Jaboticabal: Funep, 254 p., to start a program of pest management are necessary all population's data of insect and for this the knowledge practical can be used to sampling of pest. Furthermore, the third condition must be observed, the probabilities of type I and type II errors.
The objective of this study was to determine a sequential sampling plan according to two methods for management of B. tubercula adults, i.e., using population densities for biological or chemical control methods.
MATERIALS AND METHODS
Description of the Sampling Area
The experiment was conducted during the first crop cycle of 2012 in a commercial production area of 2,500 m2 (22° 20′ 57″ S latitude, 53° 54′ 37″ W longitude and elevation of 423 m), located in the municipality of Ivinhema, Mato Grosso do Sul, Brazil.
Spacing of the plants was 0.90 m between rows and 0.45 m between plants of the “fécula-branca” variety. This variety is included in the group of those most tolerant to B. tubercula(Sagrilo et al. 2010Sagrilo E, Vidigal Filho PS, Otsubo AA, Silva AS and Rohden VS. 2010. Performance de cultivares de mandioca e incidência de mosca branca no Vale do Ivinhema Mato Grosso do Sul. Ceres 57: 87-94.). The cuttings were planted on August 28, 2011, fertilizer was applied at a rate of 290 kg ha–1 (N-P2O5-K2O 00-30-10 formulation) and in the area used there was no trace of chemical treatment for pest control.
Sampling
A sampling grid was marked in the experimental area, measuring 2.500,00 m2, divided into 100 parcels of 25 m2 (5 m x 5 m). Sampling was performed weekly in the sampling area. For sampling of whitefly adults, visual observations were made in the morning by slightly turning the leaves to the side (Tonhasca Jr et al. 1994). Five plants per plot were observed and three leaves from the upper third of each plant were sampled, since this is the location showing the greatest presence of B. tuberculata adults.
The complete sampling period lasted from January 7, 2012 to April 14, 2012, totaling 15 samples according to occurrence of the whitefly in the crop. This period ranges from the beginning of colonization of the plague until completion of the first cycle of the pest in the crop.
Statistical Analyses
The sequential sampling plans constructed for the species studied were based on the sequential probability ratio test (SPRT), according to the methodology developed by Wald (1947)Wald A. 1947. Sequential analysis. New York: J Wiley and Sons, 212 p.. The objective of this plan is to test, with the lowest possible number of sample units, the hypotheses H0 and H1. Hypothesis H0 indicates that the population is below the level of safety, and therefore it is accepted that there is no need for pest control, while hypothesis H1 indicates that the population is above the level of safety, and its acceptance means that it is necessary to apply control methods.
Decision trees were thus constructed for performing the SPRT. The upper decision limit indicates the number of organisms required to reach the proposed control level; on the other hand, the lower decision limit indicates the total number of organisms from which it can be affirmed that this population is below the level of safety, thus there is no need to apply any control measures.
The upper decision limit of the test is defined as: S1= h1+S×n. The lower decision limit is defined by the SPRT test: S0= h0+S×n, where, in both equations, (n) indicates the number of the sampling unit to be used in sampling, and the values h0, h1 and S are defined as the Negative Binomial by:
where:


 ;
;  ; u0= level of safety; α = level of economic damage; α = type I error; β= type II error; k = Kc index (common k), calculated by the method proposed by Bliss and Owen (1958)Bliss CI and Owen ARG. 1958. Negative binomial distribution with a common K. Biometrika 45: 37-58., i.e.:where:
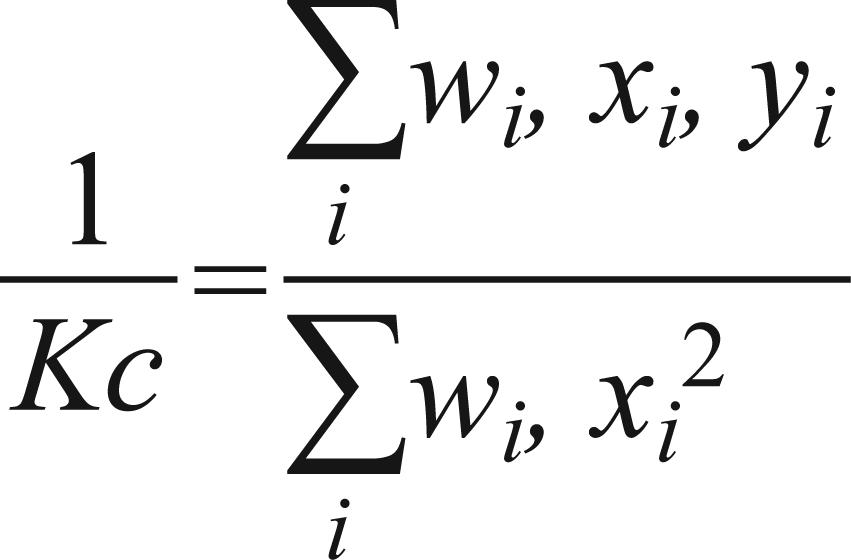
 ; n1 = sample size;
  ;
;  ;
;
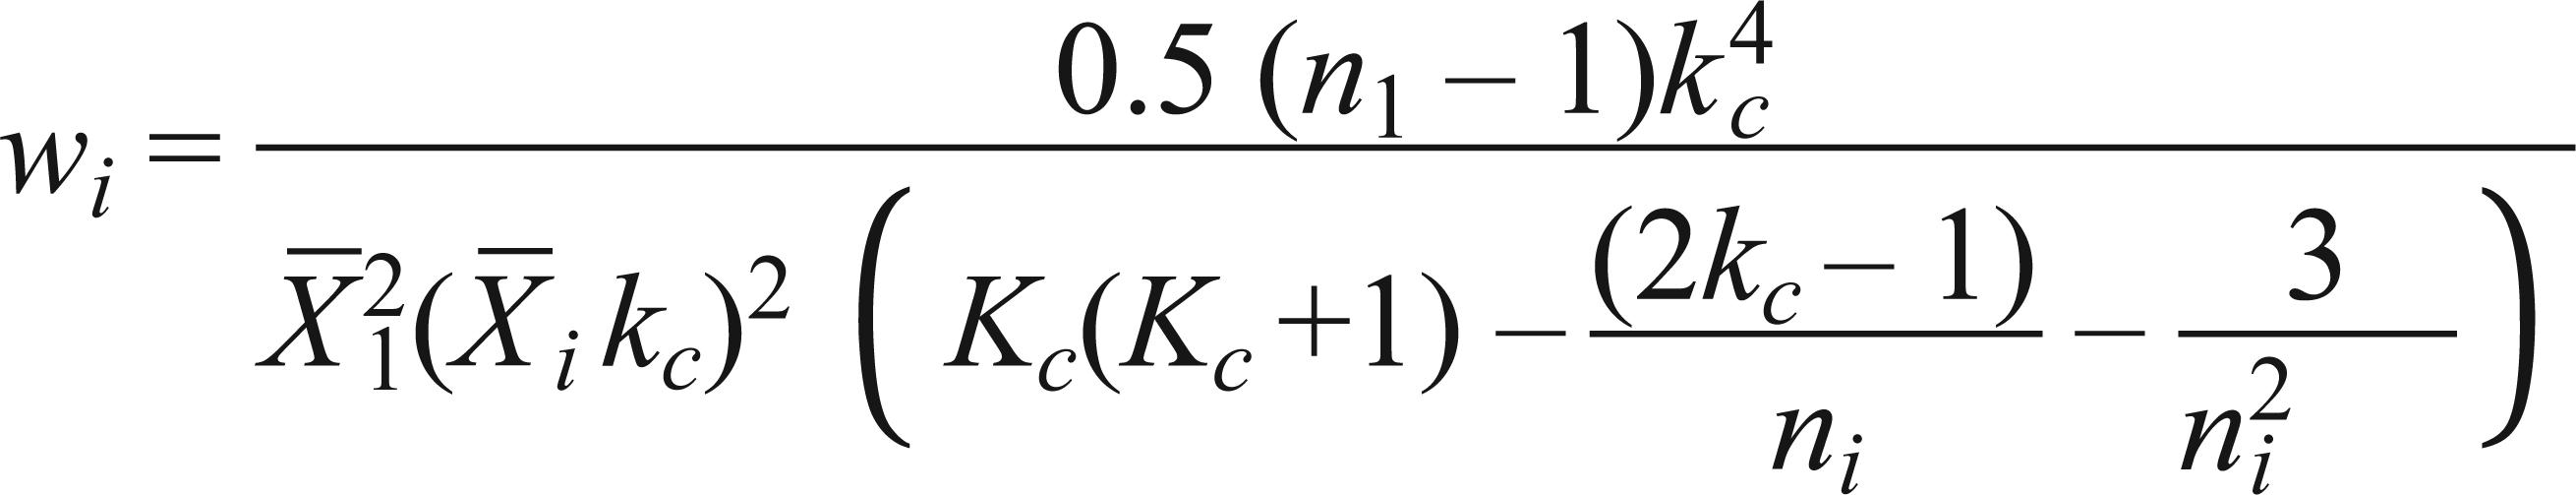
Since the variable wi involves the unknown parameter Kc, the process of estimating this variable should be interactive, and an initial estimate of kc should be obtained from:
Therefore, according to the spatial distribution model of the organism studied, to determine the decision limits in the first observation, a value for n of 1 was used and the upper and lower limits were determined for sampling unit number 1; in the second observation a value of n equal to 2 was used, thus determining the upper and lower limits for sampling unit number 2. This was continued until reaching the last sample unit necessary for the sampling plan.
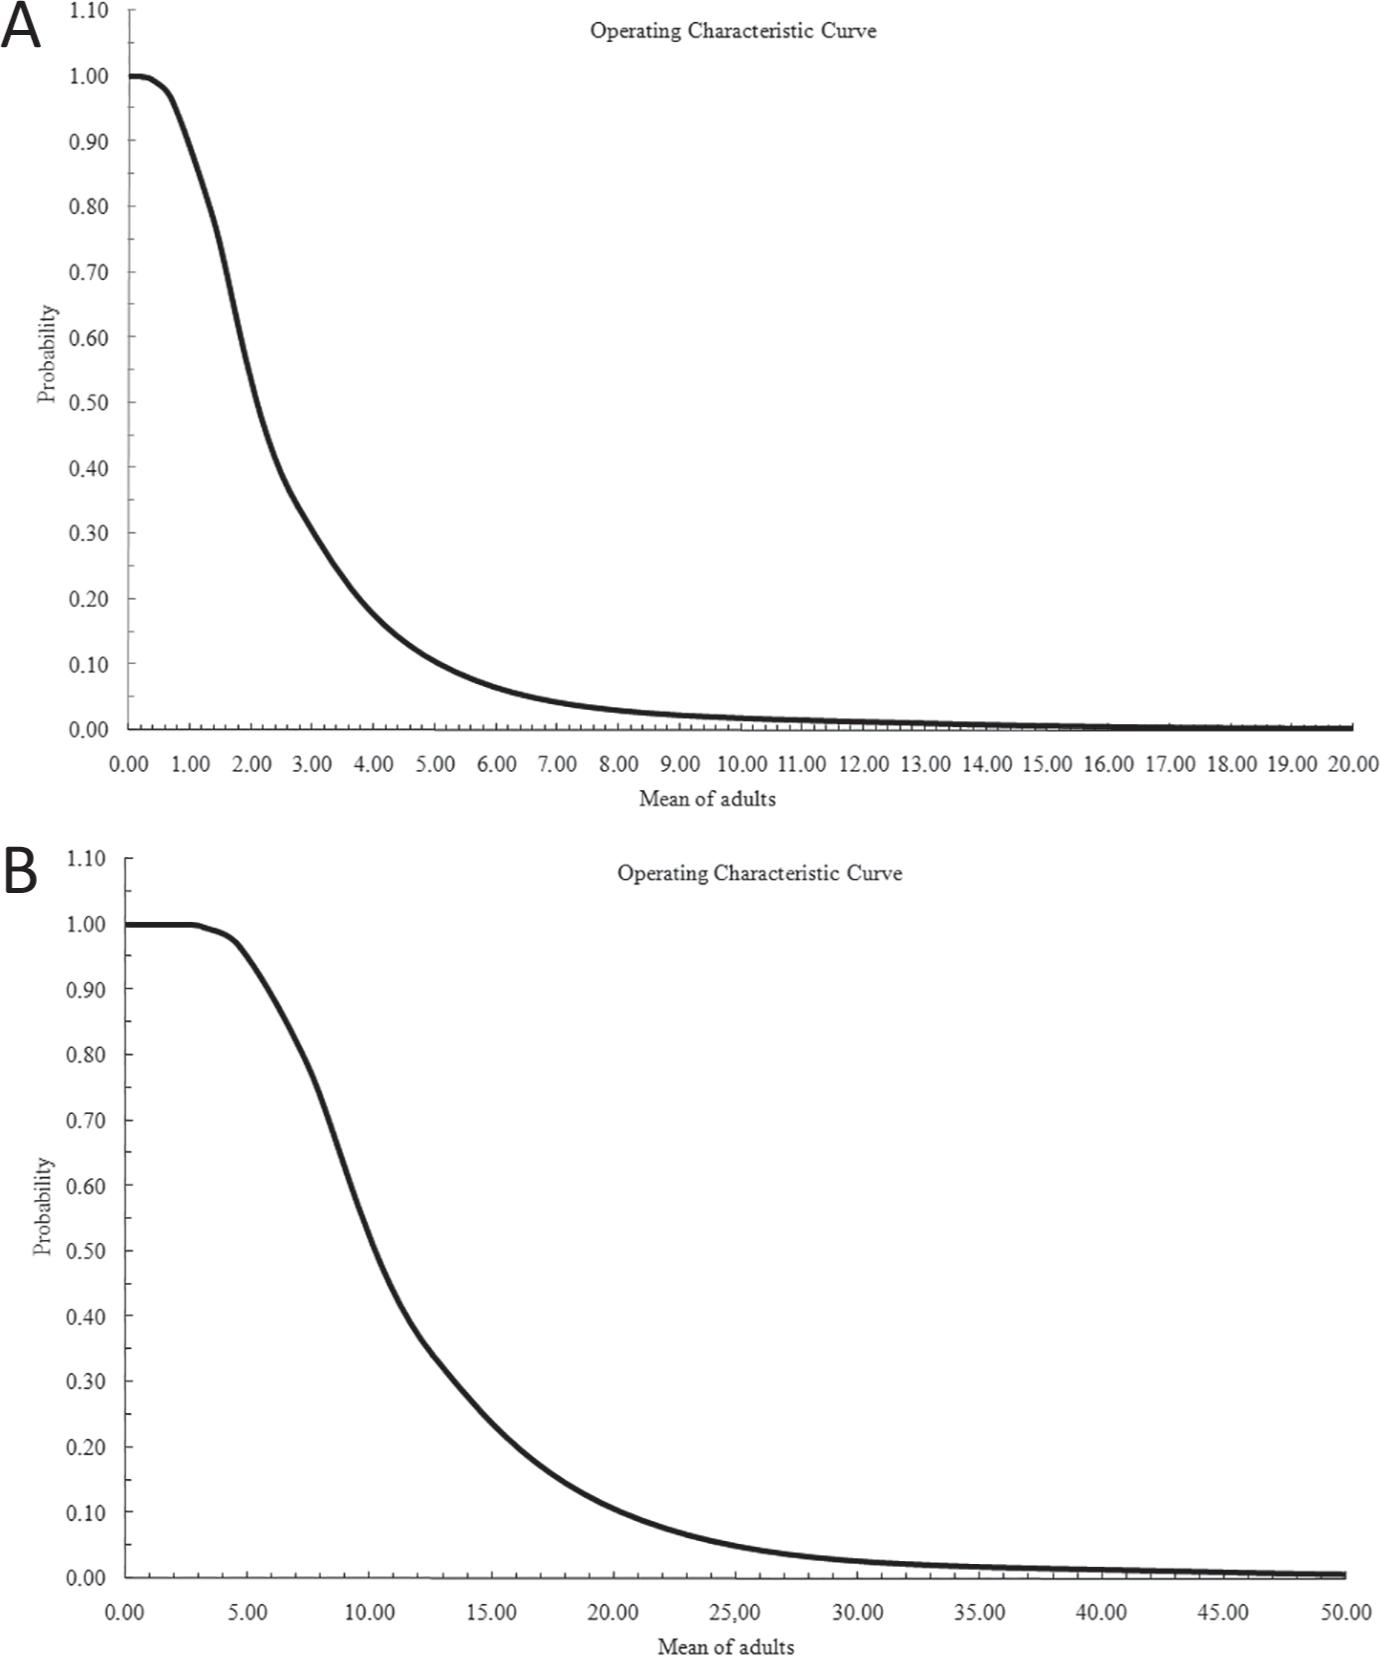
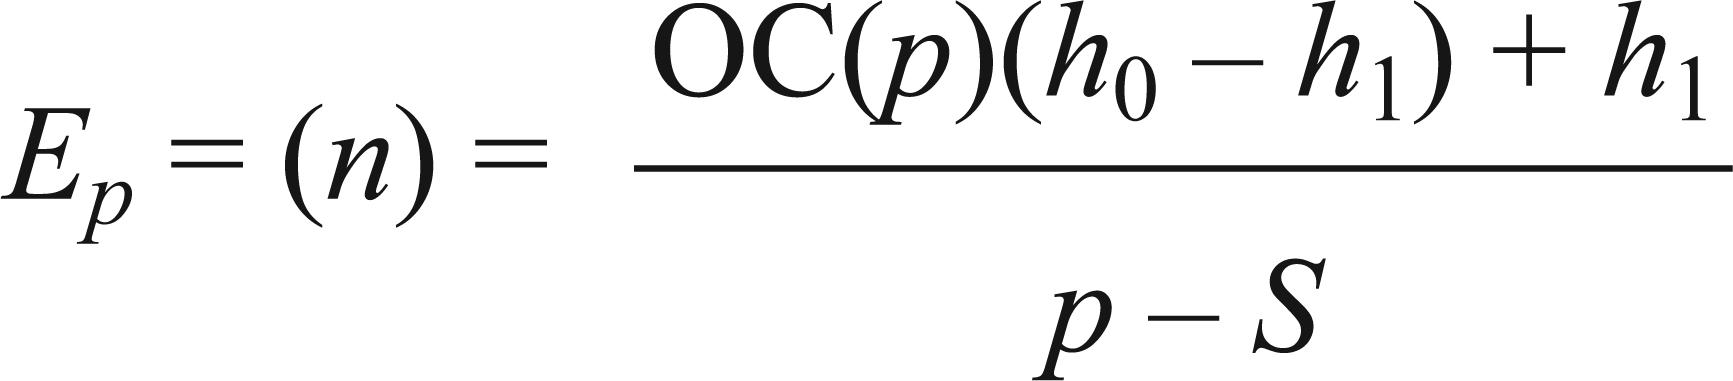
Evaluation of the SPRT test is on the Operating Characteristic Curve OC(p) and Expected Size of Sampling Units Curve Ep(n). Thus, after defining the Sequential Sampling Plan it is important to determine the Operating Characteristic Curve OC(p), which is a graphical representation of the operating characteristic function and seeks to provide the probability for the complement of sampling and not advising control up to a certain degree of crop infestation This curve indicates the probability of adopting a correct or wrong decision for any level of infestation. The Expected Size of Sample Units Curve Ep(n) represents the average number of observations required to make the decision on whether or not to perform control. The functions used for determining both curves, in any spatial distribution, are presented by Young and Young (1998)Young LJ and Young JH. 1998. Statistical ecology: a population perspective. Boston. Dordrecht: Kluwer Academic Publishers, 565 p.:
where: p= average number of whiteflies per plant; h= auxiliary variable dependent on p.
RESULTS AND DISCUSSION
For the construction of the sequential sampling plan of B. tuberculata, it was established that the Negative Binomial Distribution was the model that most accurately described the spatial pattern in the field.
The levels of control (µ1) for 5 and 20 adults encountered per plant were employed for the biological and chemical control methods, respectively. The level of safety (µ0) adopted was one adult for the biological method, and six for the chemical method (Bellotti et al. 2007Bellotti AC, Arias B, Herrera CJ and Holguín CM. 2007. Manejo integrado de moscas blancas asociadas al cultivo de la yucca. Centro Internacional de Agricultura Tropical, 22 p. Circular Técnica 358.), since this is well below the damage level, minimizing the possibility of incurring type I and type II errors.
The common K index (Kc) was calculated as 1.035 by the method of Bliss and Owen (1958)Bliss CI and Owen ARG. 1958. Negative binomial distribution with a common K. Biometrika 45: 37-58.. Values used for the type I and type II errors were α = 0.10 and β = 0.10, respectively, according to the proposal of Young and Young (1998)Young LJ and Young JH. 1998. Statistical ecology: a population perspective. Boston. Dordrecht: Kluwer Academic Publishers, 565 p.. Thus, the upper decision limit when accepting H1: m1 = 5 using the biological control method is S1 = 4.2056 + 2.1540n and H1: m1= 20 is S1 = 20.219 + 10.4306n for the chemical method. The lower decision limit for accepting H0: m0 = 1 is S0= -4.2056+ 2.1540n for the biological and H0: m0= 6 is S0 = -20.219 + 10.4306n for the chemical method. From the data of the equations two sequential sampling plans were prepared, seeking the management of B. tuberculata in the cassava crop, according to the type of pest management to be adopted in the culture.
From the resulting numbers of the equations presented, two graphs were built representing the upper and lower limits (Figure 1). Thus, one table for each type of management can facilitate the field work. When the first observation was made (1stsampling unit), the number of B. tuberculata adults found was recorded in the equivalent “total sampled” field. The number of adults found in the second observation was then added to the number found in the first observation, and the resulting amount was recorded in the “total sampled field” as (2nd sampling unit). The rule to finalize the sampling can be satisfied when either one of the following conditions is met: a) The total number of adults counted equals or exceeds the upper boundary; in this case, control is recommended. b) The total number of adults counted is less than or equal to the lower boundary; in this case, management is not recommended. Decision making, whether or not to control the pest with biological management, is possible only after the 3rd sampling unit (Figure 1A), and for the chemical method decision making can only be performed after the 2nd sampling unit (Figure 1B).
Stop sampling lines for classification-based binomial sequencial sampling for adults of Bemisia tuberculata(Hemiptera: Aleyrodidae) to the biological (A) and chemical (B) method.
These results show the efficiency of sequential sampling with respect to the speed of decision making. Fernandes et al. (2011)Fernandes MG, Spessoto RR, Degrande PE, Rodrigues TR and Herzog TRR. 2011. Sequential sampling of Aphis gossypii Glover (Hemiptera: Aphididae) and Frankliniella schultzei Trybom (Thysanoptera: Thripidae) on cotton crop. Neotrop Entomol 40: 258-263. related the efficiency of this method to classify the density of the pest, compared to traditional methods, resulting in savings of time and effort for making decision regarding control or not.
With the two graphical representations of the operation characteristic curve OC(p) it is verified that with an average of one adult per plant, the test indicates only 1% likelihood of recommending biological control without necessity, i.e., type I error. For 10 adults per plant, the possibility of occurrence of type I error is almost zero (Figure 2A, B). Using the population density for chemical control, it is observed that for average values greater than three adults per plant, there is only a 1% probability of type I error. When exceeding 35 adults per plant the possibility of this error is almost nil.
Operating characteristic curve OC(p) of the Test Sequential Probability Ratio for the total adult population of Bemisia tuberculata (Hemiptera: Aleyrodidae) to the biological (A) and chemical (B) method.
The expected number of sample units Ep(n) in the Sequential Probability Ratio Test (Figure 3A, B), indicates a density of 1.34 B. tuberculata adults, the probable number of sample units needed for sampling will be three units, and for six adults 1 sample unit is probably sufficient for decision making and use of biological control. Regarding chemical management, for the density of 7.39 adults of this pest, a maximum of 3.85 samples are necessary, and for more than 12.5 adults, 3.03 units are necessary for decision making.
The authors would like to thank the Coordenação de Aperfeiçoamento de Pessoal de Nível Superior (CAPES) and Universidade Federal da Grande Dourados (UFGD) for the Master's scholarship granted to the first author.
REFERENCES
- Angel JC, Pineda BL, Nolt B and Velasco AC. 1990. Mosca blanca (Homoptera: Aleyrodidae) asociadas a transmisión de vírus em yuca. Fitopat Colomb 13: 65-71.
- Barbosa JC. 1992. Métodos estatísticos aplicados à entomologia. Jaboticabal: Funep, 254 p.
- Bellotti AC, Arias B, Herrera CJ and Holguín CM. 2007. Manejo integrado de moscas blancas asociadas al cultivo de la yucca. Centro Internacional de Agricultura Tropical, 22 p. Circular Técnica 358.
- Bliss CI and Owen ARG. 1958. Negative binomial distribution with a common K. Biometrika 45: 37-58.
- Fernandes MG, Busoli AC and Barbosa JC. 2003. Distribuição espacial de Alabama argillacea (Hübner) (Lepidoptera: Noctuidae) em algodoeiro. Neotrop Entomol 32: 107-115.
- Fernandes MG, Spessoto RR, Degrande PE, Rodrigues TR and Herzog TRR. 2011. Sequential sampling of Aphis gossypii Glover (Hemiptera: Aphididae) and Frankliniella schultzei Trybom (Thysanoptera: Thripidae) on cotton crop. Neotrop Entomol 40: 258-263.
- Kogan M and Herzog DC. 1980. Sampling methods in soybean entomology. New York: Springer, 587 p.
- Pietrowski V, Ringenberger R, Rheinheimer AR, Bellon PP, Gazola D and Miranda AM. 2010. Insetos-praga da cultura da mandioca na região centro oeste-sul do Brasil. Universidade do Oeste do Paraná, 40 p.
- Potrich M, Neves PMOJ, Alves LAF, Pizzatto M, Silva ERL, Luckmann D, Gouvêa A and Roman JC. 2011. Virulência de fungos entomopatogênicos a ninfas de Bemisia tabaci (Genn.) (Hemiptera: Aleyrodidae). Semina-Cienc Agr 32: 1783-1792.
- Sagrilo E, Vidigal Filho PS, Otsubo AA, Silva AS and Rohden VS. 2010. Performance de cultivares de mandioca e incidência de mosca branca no Vale do Ivinhema Mato Grosso do Sul. Ceres 57: 87-94.
- Schimitt AT. 2002. Principais insetos pragas da mandioca e seu controle. In: CEREDA MP (Ed), Culturas de Tuberosas Amiláceas Latino-Americano, São Paulo: Fundação Cargil, São Paulo, Brasil, p. 350-369.
- Silva AS, Kassab SO and Gaona JC. 2012. Insetos-pragas produtos e métodos de controle utilizados na cultura de mandioca em Ivinhema Mato Grosso do Sul. Rev Verde Desen Susten 7: 19-23.
- Tonhasca JRA, Palumbo JC and Byrne DN. 1994. Distribution patterns of Bemisia tabaci (Homoptera: Aleyrodidae) in cantaloupe fields in Arizona. Environ Entomol 23: 949-954.
- Wald A. 1945. Sequential test of statistical hypothesis. Ann Math Stat 16: 117-186.
- Wald A. 1947. Sequential analysis. New York: J Wiley and Sons, 212 p.
- Young LJ and Young JH. 1998. Statistical ecology: a population perspective. Boston. Dordrecht: Kluwer Academic Publishers, 565 p.
Publication Dates
-
Publication in this collection
June 2014
History
-
Received
21 Nov 2012 -
Accepted
4 May 2013