ABSTRACT
An experiment was conducted to examine the influencing characters on rice by using 64 rice genotypes, including four local landraces, four released cultivars and 56 mutant lines (M5) derived from these genotypes, with application of the genotype by trait (GT) biplot methodology. The first two principal components (PC1 and PC2) accounted for 46.6% of total variation in 64 genotypes. The polygon view of GT biplot suggested seven sections for 64 genotypes. The vertex G38 had good amounts of grain yield, panicle length, hundred grain weight, internodes length, plant height and fertility percentage. Generally based on vector view it was demonstrated that the selection of high grain yield would be performed via thousand grain weight, panicle weight and number of filled grain per panicle. These traits should be considered simultaneously as effective selection criteria evolving high yielding rice genotypes because of their large contribution to grain yield. The genotypes G2, G4 and G7 could be considered for the developing of desirable progenies in the selection strategy of rice improvement programs. This study revealed GT biplot can graphically display the interrelationships among traits. In conclusion, it is recommended the use of GGE biplot to identify superior genotypes for simultaneous improvement of several traits.
Key words:
Grain yield; polygon view; trait associations; rice; vector view
INTRODUCTION
Rice (Oryza sativa L.) is one of the most important food crops of the world and especially of most Asian countries. Grain yield of rice can be the result of a complex cause and effect systems. For this reason, researchers have studied complex cause and effect systems to determine traits that influence the final grain yield and the other important traits during plant ontogeny (Samonte et al. 1998SAMONTE SOPB, WILSON LT AND MCCLUNG AM. 1998. Path analyses of yield and yield-related traits of fifteen diverse rice genotypes. Crop Sci 38(5): 1130-1136.).
The primary goal of a plant improvement program is to identify the most favorable genotypes for the desired traits, which are evaluated based on multiple traits. In fact, these breeding programs are conducted throughout the target region in which multiple traits are usually recorded (Yan and Rajcan 2002YAN W AND RAJCAN I. 2002. Biplot evaluation of test sites and trait relations of soybean in Ontario. Crop Sci 42: 11-20., Dehghani et al. 2008DEHGHANI H, OMIDI H AND SABAGHNIA N. 2008. Graphic analysis of trait relations of canola (Brassica napus L.) using biplot method. Agron J 100: 760-764. ). Effective explanation and utilization of such programs dataset is important at all stages of plant breeding, particularly when it is only possible to select on yield components. In rice breeding programs, parents used in crosses are selected from cultivars and advanced breeding lines. While new cultivars should possess superior combinations of characters and parents should serve as excellent donors of one or more traits being targeted by the breeding program (Yan and Frégeau-Reid 2008). The traits of parents in rice breeding programs should include high levels of grain yield, tiller density, panicle weight, number of grains per panicle, head rice rate, and insect pest and disease resistance. Identifying and using genotypes that have most of these targeted characters, as parents in crosses, is important to the rice breeders in producing the population to develop new cultivars (Samonte et al. 2013SAMONTE SOPB, TABIEN RE AND WILSON LT. 2013. Parental selection in rice cultivar improvement. Rice Sci 20(1): 45-51.).
Numerous statistical methods have been used in the examine for an understanding of the patterns, although strategies may differ in overall appropriateness, different methods usually lead to the same or similar conclusions for a given dataset (Rubio et al. 2004RUBIO J, CUBERO JI, MARTIN LM, SUSO MJ AND FLORES F. 2004. Biplot analysis of trait relations of white lupin in Spain. Euphytica 135: 217-224. , Yan et al. 2007YAN W, TINKER NA, MOLNAR S, MCELROY A AND FREGEAU-REID J. 2007. Associations among oat traits and their responses to the environment in North America. J Crop Improv 20: 1-29.). Traditionally, breeders would create genotype × trait tables, sort and rank the genotypes based on selection criteria traits, then intercross the genotypes that top the various trait rankings. This procedure is logical and easy when a few traits are considered, but it becomes difficult and less efficient as more traits are considered, that is, more genotypes are selected as parents for intercrossing. A more efficient method of multi-trait data analysis and selection of genotypes as parents is the genotype × trait (GT) biplot analysis. The genotype main effect plus genotype by environment (GGE) that developed by Yan et al. (2000) as a graphical tool for analysis of multi-environment trials dataset, can also be equally used for all types of two-way data that assume a two way structure. The genotypes can be generalized as rows and the multiple traits as columns. Yan and Rajcan (2002) used a GT biplot, which is an application of the GGE biplot technique to study the genotype by trait data. The GT biplot analysis allows visualization of genetic correlation among traits (Yan and Frégeau-Reid 2008) and also helps in studying genotype by trait relationships (Lee et al. 2003LEE SJ, YAN W, JOUNG KA AND ILL MC. 2003. Effects of year, site, genotype, and their interaction on the concentration of various isoflavones in soybean. Field Crop Res 81: 181-192. ) and evaluation of genotypes on the basis of multiple traits (Ober et al. 2005OBER ES, BLOA ML, CLARK CJA, ROYAL AK, JAGGARD W AND PIDGEON KW. 2005. Evaluation of physiological traits as indirect selection criteria for drought tolerance in sugar beet. Field Crop Res 91: 231-249.). It also provides information on the usefulness of genotypes for production and helps to detect less important (redundant) traits, and identifies those that are appropriate for indirect selection for a target trait (Badu-Apraku and Akinwale 2011).
GT biplot technique has been applied in soybeans (Yan and Rajcan 2002YAN W AND RAJCAN I. 2002. Biplot evaluation of test sites and trait relations of soybean in Ontario. Crop Sci 42: 11-20.), common bean (Gonzalez et al. 2006GONZALEZ AM, MONTEAGUDO AB, CASQUERO PA, DE RON AM AND SANTALLA M. 2006. Genetic variation and environmental effects on agronomical and commercial quality traits in the main European market classes of dry bean. Field Crop Res 95: 336-347. ), spinach (Sabaghnia et al. 2015SABAGHNIA N, BEHTASH F. AND JANMOHAMMADI M. 2015. Graphic analysis of trait relations of spinach (Spinacia oleracea L.) landraces using the biplot method. Acta Univers Agric Silv Mendel Brun 63(4): 1187-1194. ), canola (Dehghani et al. 2008DEHGHANI H, OMIDI H AND SABAGHNIA N. 2008. Graphic analysis of trait relations of canola (Brassica napus L.) using biplot method. Agron J 100: 760-764. ), durum wheat (Mohammadi and Amri 2011MOHAMMADI R AND AMRI A. 2011. Graphic analysis of trait relations and genotype evaluation in durum wheat. J Crop Improv 25(6): 680-696. ), wheat (Sabaghnia and Janmohammadi 2014) aromatic peppers (Abu Ngozi et al. 2011), white lupin (Rubio et al. 2004RUBIO J, CUBERO JI, MARTIN LM, SUSO MJ AND FLORES F. 2004. Biplot analysis of trait relations of white lupin in Spain. Euphytica 135: 217-224. ), sugar beet (Ober et al. 2005OBER ES, BLOA ML, CLARK CJA, ROYAL AK, JAGGARD W AND PIDGEON KW. 2005. Evaluation of physiological traits as indirect selection criteria for drought tolerance in sugar beet. Field Crop Res 91: 231-249.), oat (Peterson et al. 2005PETERSON DM, WESENBERG DM, BURRUP DE AND ERICKSON CA. 2005. Relationships among agronomic traits and grain composition in oat genotypes grown in different environments. Crop Sci 45(1): 249-255. , Yan et al. 2007, Yan and Frégeau-Reid 2008), maize (Safari Dolatabad et al. 2010) and rice (Samonte et al. 2013SAMONTE SOPB, TABIEN RE AND WILSON LT. 2013. Parental selection in rice cultivar improvement. Rice Sci 20(1): 45-51.) to identify the relationships between traits and to evaluate the genotypes on the basis of multiple traits.
The objective of this study was to evaluate the rice genotypes diversity based on the multiple traits and to study the interrelationships among agronomic and quality traits using GT biplot technique.
MATERIALS AND METHODS
EXPERIMENTAL FIELD AREA
The rice genotypes used in this study were four local landraces (Hashemi, Tarom, Alikazemi and Sangjo), four released breeding cultivars with high yield (Khazar, Fajr, H.P and Sephidrod) and 56 M5 mutant lines that derived from above eight genotypes (Table I). The genotypes were grown during the spring of 2013-14 at the experimental farm of Rice Research Institute of Iran (RRII) in Rasht. The farm is situated between 49˚E longitude and 37˚N latitude at an altitude of 7 m below the mean sea level in north of Iran. Seeds of each genotypes were exposed to 300Gy, {Gy=Grey (1Grey=10krad)} gamma rays treatments from Cobolt60 source at Iranian Agricultural Atomic Research Institute, Tehran at equilibrium moisture content of eight percent during 2010. Following irradiation mutagen treatment of seeds, different M1 were grown in the field. Surviving plants were selfed to get the seeds of respective M2 and again selfed to get M3, M4 and M5.
The M5 mutant line and parental genotypes (as check varieties) were sown in a nursery on the 10 May 2014 and 25-day-old seedlings were transplanted to the field. The field experiment was arranged in a randomized complete block design with three replications, using 25 × 25 cm spacing, in four-row plots of three m length. Recommended doses of nitrogen (200 kg ha-1) and phosphorous (100 kg ha-1) were applied. One-third amount of nitrogen and whole phosphorous was applied as a basal dose at the time of transplanting the seedlings. The remaining two-thirds of nitrogen were utilized in two split doses 30 days after transplanting and at the time of panicle initiation. Two-hand weddings were done 30 and 50 days after transplanting. The permanent flood water level was maintained at 10 cm. The observations were recorded on ten plants randomly selected from the two center rows in each replication.
ESTIMATED CHARACTERS
The following traits were measured based on Standard Evaluation System for Rice (SES 2002): Grain yield (GY), day to flowering (DF), plant height (PH), number of panicle per plant (NPP), panicle length (PL), number of spikelet per panicle (SNP), internodes length (IL), number of filled grains per panicle (FG), number of unfilled grains per panicle (UNG), grain productivity (F), hundred grain weight (HGW), grain length (SL), grain width (SW), ratton yield (RY), panicle weight (PW), amylose content (AC) and gelatinization temperature (GT).
STATISTICAL ANALYSIS
The Anderson and Darling normality test was used to normality test of dataset using MINITAB version 16 software. The GT biplot analysis (Yan and Rajcan 2002YAN W AND RAJCAN I. 2002. Biplot evaluation of test sites and trait relations of soybean in Ontario. Crop Sci 42: 11-20.) was performed on the 64 genotypes and 18 quantitative traits to show the rice M5 mutant, landrace and breeding cultivars by trait two-way data. In a genotype-by-trait table, genotypes are entries and traits are testers. All biplots presented in this study were generated using the software GGEbiplot package (Yan 2001).
RESULTS AND DISCUSSION
GENOTYPE EVALUATION BASED ON MULTIPLE TRAITS
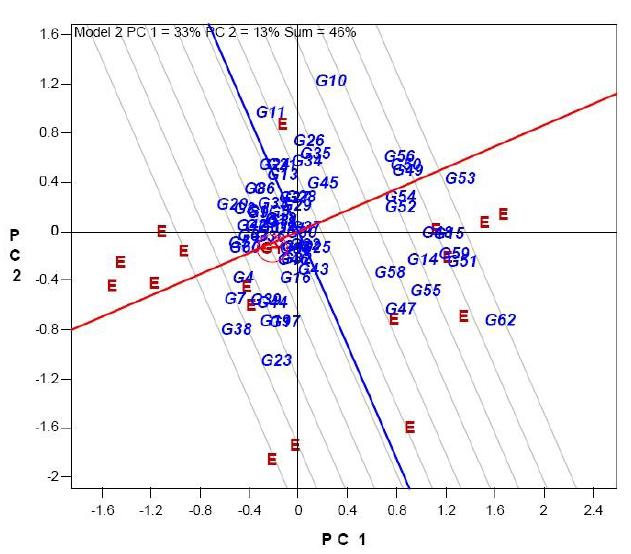
The GT biplot of mean performance of rice genotypes explained 46% of the total variation of the standardized data (Figure 1). Although, this biplot only explain less than half of observed variation, the other researchers such as Akcura et al. (2011AKCURA M, PARTIGOÇ F AND KAYA Y. 2011. Evaluation of drought stress tolerance based on selection indices in turkish bread wheat landraces. J Anim Plant Sci 21(4): 700-709.), Samonte et al. (2013SAMONTE SOPB, TABIEN RE AND WILSON LT. 2013. Parental selection in rice cultivar improvement. Rice Sci 20(1): 45-51.), Oladejo et al. (2011OLADEJO AS, AKINWALE RO AND OBISESAN IO. 2011. Interrelationships between grain yield and other physiological traits of cowpea cultivars. African Crop Sci J 3: 189-200.) and Mohammadi and Amri (2011MOHAMMADI R AND AMRI A. 2011. Graphic analysis of trait relations and genotype evaluation in durum wheat. J Crop Improv 25(6): 680-696. ), were also used GT biplot with low exploitation of total variation by the first two principal components (PC1 and PC2). The 18 traits are displayed in uppercase and the 64 genotypes are in italics. This relatively moderate percentage reflects the complexity of the relationships among the measured traits (Yan and Rajcan 2002YAN W AND RAJCAN I. 2002. Biplot evaluation of test sites and trait relations of soybean in Ontario. Crop Sci 42: 11-20.). The first two principal components (PC1 and PC2) explained 33% and 13%, respectively. The polygon view of the biplot helps identify genotypes with the highest values for one or more traits. The vertex genotypes in biplot can be characterized for specific attributes, while those are near to origin of biplot can be considered as genotypes with characterized for a wide range of attributes. The vertex genotypes in this investigation are G53, G62, G23, G38, G20, G11, and G10. Based on the trait relationships, different group of traits identified with different responses in discrimination of genotypes. The vertex genotypes and their related genotypes located in different seven sections of biplot are suitable candidates for the examination of heterosis for hybrid production (Yan et al. 2007). These genotypes are the best or the poorest in some or all of the traits since they had the longest distance from the origin of biplot. According to this view of biplot, the traits including number of unfilled grains per panicle (UNG), day to flowering (DF), grain length to width ratio (SL/W), amyloze content (AC), gelatinization temperature (GT) and grain length (SL) fell in the G62 sector, suggesting that Sepidroud (G62) had highest or near-highest values for these traits. G55, G47, G58 and G14 were the other genotypes to Sepidroud sector for these traits. Similarly, genotypes G23, G19 and G17 were the highest in grain width (SW), number of filled grains per panicle (FG) and panicle weight (PW). Genotypes G38, G7, G4 and G8 and the other genotypes of this sector had good amounts of grain yield (GY), panicle length (PL), hundred grain weight (HGW), internodes length (IL), plant height (PH) and grain productivity (F). G29 and the genotypes that fall in its sector had the highest value of ratton yield (RY). The highest numbers of panicle per plant (NPP) were obtained in G11 and G10. Since the biplot did not explain all the variation, these predictions may not exactly reflect the observed numbers (Yan and Kang 2003).
Polygon view of the rice genotype-by-trait biplot, showing which cultivar had the highest values for which traits. Genotypes or entries are in italics and traits or testers are in regular uppercase.
With knowing that higher grain yield is desirable for rice genotypes, the purpose of this exercise was to determine the most favorable genotype for both breeding and cultivation proposes. It is clear that many of studied genotypes were completely different from each other and showed remarkable variation and, thus, are suitable genetic source for genetic improvement of rice. The source of germplasm is a part of this decision process. Commercially grown cultivars are very popular choices as parents to breeders. These cultivars offer the majority of traits of great importance to breeders and the chance of getting superior progenies is high. Similar reports demonstrated that the GT biplots were an excellent tool for visualizing genotype-by-trait data and revealing the interrelationships among traits (Yan and Kang 2003YAN W AND KANG MS. 2003. GGE biplot analysis: A graphical tool for breeders, geneticists, and agronomists. CRC Press, Boca Raton, FL. , Peterson et al. 2005PETERSON DM, WESENBERG DM, BURRUP DE AND ERICKSON CA. 2005. Relationships among agronomic traits and grain composition in oat genotypes grown in different environments. Crop Sci 45(1): 249-255. ). GT biplots also provide a tool for visual comparisons among genotypes based on multiple traits (Lee et al. 2002, Yan and Rajcan 2002, Yan and Kang 2003, Ma et al. 2004MA BL, YAN W, DWYER LM, FREGEAU-REID J, VOLDENG HD, DION Y AND NASS H. 2004. Graphic analysis of genotype, environment, nitrogen fertilizer, and their interactions on spring wheat yield. Agron J 96: 169-180., Rubio et al. 2004RUBIO J, CUBERO JI, MARTIN LM, SUSO MJ AND FLORES F. 2004. Biplot analysis of trait relations of white lupin in Spain. Euphytica 135: 217-224. , Yan and Frégeau-Reid 2008). The major advantage of genotype by trait biplot is that the largest value can easily be visualized in a dataset.
The GT biplot analyses have been used to compare genotypes on the basis of multiple traits and to identify genotypes or groups of genotypes that are particularly good in certain aspects, and therefore can be candidates for introduced as best genotypes. The biplot of the grand mean reveal G57 (Hashemi), G60 (Tarom), G63, G36, G4, and G7 as the best genotype in seven out of 18 characters studied. These genotypes equally maintained a consistent high value for grain yield, PL, HGW, IL, PH, F and RY. Selection for a high yielding genotype in rice could be by indirectly selecting yield components that are related to yield as shown by the biplot. The distance between genotype and the biplot origin, the vector length of a genotype, is a unique measure of the genotype (i.e., how it differs from an “average” genotype), which is a hypothetical genotype that has an average level for all traits and is represented by the biplot origin. Therefore, genotypes with long distances are those that have extreme levels for one or more traits. Such genotypes may or may not be superior, but they may be useful as parents for some useful traits (Yan and Frégeau-Reid 2008YAN W AND FRÉGEAU-REID J. 2008. Breeding line selection based on multiple traits. Crop Sci 48: 417-423.). As depicted in Figure 1, G62 has a higher vector length than the other genotypes, with above-medium grain yield and high value of AC and gelatinization temperature; therefore it is not suitable genotype for improving quality rice. According to vector length of genotypes, G38, G7, G4 and G8 had the highest values of GY, PL, HGW, IL, PH and F. The highest number of panicle per plant was obtained in G11 and G10.
INTERRELATIONSHIP AMONG TRAITS
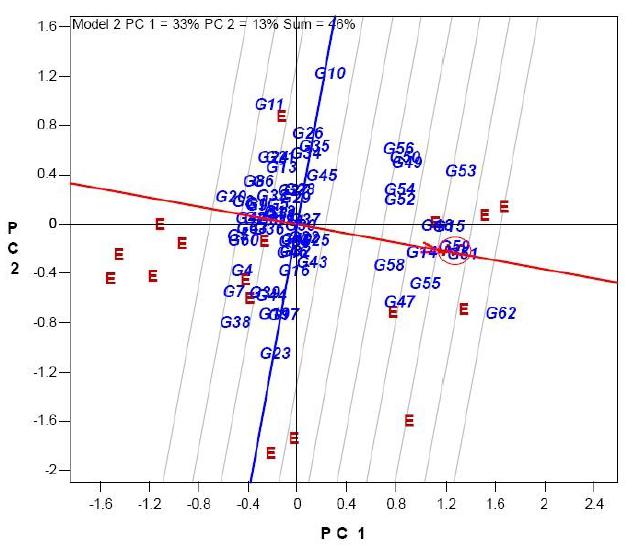
In the present study, the GT biplot explained 46% of the total variation, in accordance with this result, Mohammadi and Amri (2011MOHAMMADI R AND AMRI A. 2011. Graphic analysis of trait relations and genotype evaluation in durum wheat. J Crop Improv 25(6): 680-696. ) used vector view of biplot for interpretation of relationships between traits, although stated the relatively low goodness of fit reflects the complexity of the relationships among the measured traits. The angles of the vectors to each other in biplot represent the phenotypic correlation between the attributes over all values of the genotypes for each attribute. The cosine of angle between a pair of morphological traits vectors approximates correlation between them (Yan and Rajcan 2002YAN W AND RAJCAN I. 2002. Biplot evaluation of test sites and trait relations of soybean in Ontario. Crop Sci 42: 11-20., Yan and Kang 2003). An acute angle (<90º) indicate a positive correlation; an angle close to 90 degrees indicate the traits are not correlated, whereas an obtuse angle close to 180 degrees represents a strong negative relationship. The length on the trait vector to the point where a perpendicular dropped from the genotype plotting point to the vector, is proportional to the modeled (predicted) value of that genotype for that attribute (Delacy et al. 2000DELACY IH, SKOVMAND B AND HUERTA J. 2000. Characterization of Mexican wheat landraces using agronomically useful attributes. Gen Res Crop Evol 47: 591-602. ). In the figure 2, the correlation coefficient between any two traits is approximated by the cosine of the angle between the vectors. This figure is a biplot that displays all 18 traits and 64 genotypes and indicates the tester vectors are the lines that originate from the biplot origin and reach markers of the traits. Since the cosine of the angle between the vectors of any two traits approximates the correlation coefficient between them, this view of biplot is best for visualizing the interrelationship among traits and the trait vectors are shown to help examine the interrelationship among traits (Yan and Kang 2003). This view of biplot suggests close associations among UNG, DF, SL/W, AC, SL, gelatinization temperature and SNP. In the other section of this biplot, there are positive associations between GY, PL, SW, HGW, F, IL, PH and RY, as indicated by the small obtuse angles between their vectors (r = cos 0 = +1). FG also positively associated with PW. Grain yield shows a positive correlation with PH, IL, F, HGW, PL and SW. Most of the measures are positively or negatively associated with grain yield. Only a few traits are apparently independent of grain yield, which are NPP, SNP and gelatinization temperature, as indicated by their near 90o angles with grain yield (r = cos 90 = 0). Traits that are positively correlated with grain yield are located on the left half of the biplot. These include RY, PH, IL, F, HGW, PL, SW, PW and FG. Traits on the right side of the biplot are negatively associated with grain yield, as indicated by their near angle of approximately 180 degrees (r = cos 180 = -1). These traits include UNG, DF, SL/W, AC and SL. The genotypes are located on the left side of the biplot, have greater grain yield and associated traits. In the other hand, the genotypes located in the right side of the biplot, have greater quality traits including AC, gelatinization temperature and SL/W. Some discrepancies between the biplot predictions and original data were expected because the biplot accounted for < 100% of the total variation (about 46%).
Vector view of the genotype-by-trait biplot, showing the interrelationships among traits. The cosine of the angle between the vectors of two traits approximates the correlation coefficients between the traits. The symbol of traits is similar to figure 1. The name of genotypes is presented in Table I.
In the GT biplot, a vector is drawn from the biplot origin to each marker of the genotype to facilitate visualization of the relationships between and among the traits as well as genotypes. The results obtained from the GT biplot of the genotypes identified parameters that could be considered best in discriminating among the genotypes. A major advantage of the GT biplot analysis is that it provides information that helps to detect less important traits, and identify those that are appropriate for indirect selection for a target trait such as grain yield (Yan and Rajcan 2002YAN W AND RAJCAN I. 2002. Biplot evaluation of test sites and trait relations of soybean in Ontario. Crop Sci 42: 11-20.). GT biplot graphically displays the genotype by trait relationship and allows the visualization of the associations among traits across the genotypes and of the trait profile of the genotypes (Yan and Kang 2003). As observed in this study, it appears possible to improve rice genotypes by selecting genotypes with higher grain yield, PL, IL, PW, FG and HGW. Since these measures are highly correlated, there is no need to measure all of them. Any of these measures should be effective for indirect selection for grain yield. It would be desirable to identify traits that are more easily measured. In the upper part of grain yield vector, HGW and IL are most easily measured traits; on the lower part of this vector, PL and PW are most easily measured traits. Therefore, joint use of these traits as indirect selection for gain yield should be an economic and promising option in early generations. PL and IL more closely associated with grain yield than PW and FG, and it can be visually assessed. They are, therefore, promising traits for indirect selection for grain yield. HGW is closely associated with grain yield and it is therefore recommended as a trait for indirect selection. Specifically, the selection for grain yield for rice genotypes during a breeding cycle can follow four progressive steps: 1) visual selection for PL and IL; 2) selection for panicle shape and filled grain per panicle; 3) selection for HGW; and finally 4) for grain yield. In addition to revealing traits that may be used for indirect selection, this view of biplot also can be used in identifying redundant traits. Much money is being spent on collecting information that may be redundant. For example, we already mentioned the close correlations among the measures from various quality traits (AC, gelatinization temperature and SL/W); it seems that there is no need for doing all the tests. Another example is the close relationship between IL, PH, fertilization rate (F), HGW and Pl or PW and FG. Clearly, through better understanding of the interrelationships among various traits, e.g., using biplots, much money and working time can be saved without sacrificing useful information. In addition, this study demonstrated that the GT biplot is an excellent tool for visualizing genotype by trait data. First, it effectively reveals the interrelationships among the rice traits. Second, it provides a tool for visual comparison among genotypes based on multiple traits as suggested by Yan and Frégeau-Reid (2008). Results of the GT biplot analysis indicated selecting for reduced days to flowering, unfilled grains per panicle and grain length to width ratio, and increased grain yield, raton yield, panicle length, internode length, panicle weight, number of filled grains per panicle, plant height and 100 grain weight results in genotypes that produce high grain yields.
The effects of PL, IL, PW, FG and HGW were large on grain yield. These results were similar to those obtained by Surek and Beser (2003SUREK H AND BESER N. 2003. Correlation and path coefficient analysis for some yield-related traits in rice (Oryza sativa L.) under thrace conditions. Turkey J Agric 27: 77-83.), Rashed et al. (2002RASHED MS, SADAQAT HA AND BABAR M. 2002. Correlation and path coefficient analysis for yield and its components in Rice (Oryza sativa L.). Asian J Plant Sci 3: 241-244. ), Reddy et al. (1997REDDY JN, DE RN AND SURIYA RAO AV. 1997. Correlation and path analysis in lowland rice under intermediate (0-50 cm) water depth. Oryza 34: 187-190.) and Samonte et al. (1998SAMONTE SOPB, WILSON LT AND MCCLUNG AM. 1998. Path analyses of yield and yield-related traits of fifteen diverse rice genotypes. Crop Sci 38(5): 1130-1136., 2006). It may be concluded from this investigation that panicle length, panicle weight, internode length, thousand grain weight and the number of grains per panicle appeared to contribute on the grain yield. Therefore, indirect selection for above traits may be effective for improving grain yield, as it has been shown by Mohammadi et al. (2003MOHAMMADI SA, PRASANNA BM AND SINGH NN. 2003. Sequential path model for determining interrelationships among grain yield and related characters in maize. Crop Sci 43: 1690-1697. ) and Maman et al. (2004MAMAN N, MASON SC, LYON DJ AND DHUNGANA P. 2004. Yield components of pearl millet and grain sorghum across environments in the central Great Plains. Crop Sci 44: 2138-2145.) in rice. Such type of breeding program may lead to the improvement of the economic traits in general and farmers living in the studied areas in particular.
GENOTYPE EVALUATION BASED ON INDIVIDUAL TRAITS
The GGEbiplot allows ranking of genotypes based on a single trait. When a trait, such as grain yield, is selected, the single-arrow line that passes through the biplot origin was referred to as the average-tester axis (ATC) abscissa, and on this line genotypes were ranked according to their grain yield performance. The precise position of the marker is at its left end. The arrow on the trait axis points to increasing trait value. Another line, called perpendicular line, is drawn that also passes through the origin and is perpendicular to the trait axis (Yan and Kang 2003YAN W AND KANG MS. 2003. GGE biplot analysis: A graphical tool for breeders, geneticists, and agronomists. CRC Press, Boca Raton, FL. ). Grain yield was determined, the ATC ordinate divides the ATC abscissa into two at the middle (Yan et al. 2007), and the portion of the ATC towards the right displays the above average genotype and towards the left indicates the genotype below average. Based on grain yield (Figure 3), G7 is the best genotype, followed by G6, G5, G32, G1, G14, G23 and G24. All these genotypes had above-average yield. Genotypes on the opposite side of the perpendicular line yielded below average, with G53 being the lowest-yielding genotype.
Genotype ranking based on grain yield. The symbol of traits is similar to figure 1. The name of genotypes is presented in Table I.
Based on amyloze content (Figure 4), the highest value of amyloze content was observed in G62 and G53, followed by G56. The high value of AC is a negative prospect of quality trait and moderate value of AC is a good character in rice quality. Therefore, note that the high yielding genotypes G7, G5, G32 and G1 had the medium value of amyloze content.
Genotype ranking based on AC. The symbol of traits is similar to figure 1. The name of genotypes is presented in Table I.
COMPARING NEW GENOTYPES WITH THE STANDARD CULTIVAR
In the ideal entry view of biplot, an ideal genotype has been determined as the genotype that combines several suitable traits in its genetic composition (Badu-Apraku and Akinwale 2011). When compare with a standard entry function is invoked and Hashemi is selected as the standard entry (genotype), a set of 10 concentric circles will appear, with Hashemi at the center (Figure 5). These concentric circles allow comparison of all genotypes with Hashemi. Since Hashemi is the standard cultivar, it is more ideal the closer genotype to this cultivar. From this biplot view, we can see that G60, G63, G2, G4 and G7 are close to Hashemi; which represents the acceptable level for quality and yield components. G60 (Tarom) and G63 (Ali kazemi) are two high quality landraces, which cultivated in north of Iran together with Hashemi. The other three genotypes (G2, G4 and G7) have better than acceptable grain yield than this standard cultivar and other two landraces (Tarom and Ali kazemi). Some of the other genotypes are located near to this standard genotype. Other genotypes, however, are further away from Hashemi and therefore, should be rejected.
Comparison of all genotypes with a standard cultivar, Hashemi for similarity in 18 traits related to quality and yield, assuming all traits are equally important. The symbol of traits is similar to figure 1. The name of genotypes is presented in Table I.
In the context of GT biplot analysis, an ideal tester of trait has been defined as the tester that combines several suitable genotypes in its genetic composition (Dehghani et al. 2008DEHGHANI H, OMIDI H AND SABAGHNIA N. 2008. Graphic analysis of trait relations of canola (Brassica napus L.) using biplot method. Agron J 100: 760-764. ). Based on Figure 6 the ideal trait is strongly related to as PW, FG, SNP, SW, PL, gelatinization temperature, GY, SL, HGW, IL and AC. It is interesting that the grain yield exists in these traits. Therefore, these important traits must be regarded in the rice breeding programs and determination of selection indices.
Ideal tester view of cultivar by trait biplot, showing the relationships of traits of 18 measured traits. The symbol of traits is similar to figure 1. The name of genotypes is presented in Table I.
When the target is to establish associations among the traits that affect grain yield, GT biplot analysis is a more efficient method than the correlation analysis (Rubio et al. 2004RUBIO J, CUBERO JI, MARTIN LM, SUSO MJ AND FLORES F. 2004. Biplot analysis of trait relations of white lupin in Spain. Euphytica 135: 217-224. ). Appling biplot technique to discriminate of genotypes based on traits already used in different crops. For instance, this methodology is applied in white clover (Jahufer et al. 1997JAHUFER MZZ, COOPER M AND HARCH BD. 1997. Pattern analysis of the diversity of morphological plant attributes and herbage yield in a world collection of white clover (Trifolium repens L.) germplasm characterised in a summer moisture stress environment of Australia. Gen Res Crop Evol 44: 289-300. ), wheat (Delacy et al. 2000DELACY IH, SKOVMAND B AND HUERTA J. 2000. Characterization of Mexican wheat landraces using agronomically useful attributes. Gen Res Crop Evol 47: 591-602. ), soybean (Yan and Rajcan 2002YAN W AND RAJCAN I. 2002. Biplot evaluation of test sites and trait relations of soybean in Ontario. Crop Sci 42: 11-20.), white lupin (Rubio et al. 2004) and oat (Peterson et al. 2005PETERSON DM, WESENBERG DM, BURRUP DE AND ERICKSON CA. 2005. Relationships among agronomic traits and grain composition in oat genotypes grown in different environments. Crop Sci 45(1): 249-255. , Yan and Frégeau-Reid 2008). This investigations were also very useful in choosing the precious accessions for further breeding programs. It also identifies superior entries with favorable traits effects. Sub-grouping of testers and entries by the GT biplot method will be useful for the breeding of lines for each target entry, because it will help researchers exploit the interactions among entries and subsets of testers (Dehghani et al. 2008DEHGHANI H, OMIDI H AND SABAGHNIA N. 2008. Graphic analysis of trait relations of canola (Brassica napus L.) using biplot method. Agron J 100: 760-764. ). For several reasons, we prefer to the use of GT biplot: (i) by this method, the main effect of one of the genotype is not omitted, as in the case of GGE analysis; (ii), biplots are easy to use and to interpret; and (iii) other information such as the best mating partner for each genotype, groups of similar genotypes and the best crosses that are superior to their genotypes can be graphically visualized to rapidly identify suitable genotypes and crosses for further investigation. The results of the GT biplot analysis for these rice genotypes showed variable ranges of interactions, but regarding biplot, some of the traits such as PL, SW, HGW, PW and FG were identified as most influencing traits on grain yield. Therefore, for future rice breeding programs it is essential to define selection indices based on above traits. For a possible increase in productivity of rice production, intercrosses between high yielding genotypes, G7 and G32 can be suggested. Furthermore, the significant differences were observed among the 64 rice genotypes and this can be an appropriate substrate for further breeding. Selection of the cultivars must be performed carefully keeping in view higher grain yield along with the identified important traits. The above genotypes may be used in further breeding programs and these crosses may yield more transgressive segregates for these traits for grain yield improvement. G2, G4 and G7 are recommended as good donors for longest panicle length and grain width, which has positive direct effects on number of filled grains per panicle, panicle weight and grain yield (Samonte et al. 1998SAMONTE SOPB, WILSON LT AND MCCLUNG AM. 1998. Path analyses of yield and yield-related traits of fifteen diverse rice genotypes. Crop Sci 38(5): 1130-1136., 2006). However, since these genotypes have a long plant height, they must be used in crosses with parents possessing short plant hight. These genotypes are good donors for short flowering duration.
CONCLUSIONS
Applying biplot analysis to the multiple trait data revealed that genotype by trait biplot graphically facilitated visual comparison of genotypes and selection. The GT biplot analysis of 64 genotype showed variable ranges of interactions and indicated the most reliable traits to select for improved grain yield were IL, PL, PW, FG and HGW. The results also verified that it would be possible to determine contrasting genotypes based on the trait(s) for improving genetic materials in rice breeding programs. Biplot view were also proposed one of panicle -related traits (panicle length, panicle weight and internode length) or grain-related traits (number of filled grain, hundred grain yield, grain width and fertility percentage) as the most influencing traits on grain yield and so they could be used for future rice breeding programs. Therefore, this investigation demonstrated that the program for the selection of high grain yield would be suitable for PL, PW, FG and HGW. In addition, the GT biplot had some benefits, including: easy to use and to interpret; obtain other useful information such as the best-mating partner for each genotype, and show visualization pattern to identify suitable genotypes. Three genotypes (G2, G4 and G7) were selected with proven high yield potential. These genotypes could be used as further improvement and selection as pure lines or as parental lines for the development of new rice cultivars. Although the identified superior genotypes in each methodology was nearly identical, but because of additional information are not necessary, biplot methodology is a very simple and fast method. Therefore, it is recommended the use of GGE biplot to identify superior genotypes for simultaneous improvement of several traits.
REFERENCES
- ABU NGOZI E, UGURU MI AND OBI IU. 2011. Genotype by trait relations of yield and yield components in aromatic peppers (Capsicum annuum) based on GT biplot. J Plant Breed Crop Sci 3: 382-390.
- AKCURA M, PARTIGOÇ F AND KAYA Y. 2011. Evaluation of drought stress tolerance based on selection indices in turkish bread wheat landraces. J Anim Plant Sci 21(4): 700-709.
- BADU-APRAKU B AND AKINWALE RO. 2011. Cultivar evaluation and trait analysis of tropical early maturing maize under Striga and Striga-free environments. Field Crop Res 121: 186-194.
- DEHGHANI H, OMIDI H AND SABAGHNIA N. 2008. Graphic analysis of trait relations of canola (Brassica napus L.) using biplot method. Agron J 100: 760-764.
- DELACY IH, SKOVMAND B AND HUERTA J. 2000. Characterization of Mexican wheat landraces using agronomically useful attributes. Gen Res Crop Evol 47: 591-602.
- GONZALEZ AM, MONTEAGUDO AB, CASQUERO PA, DE RON AM AND SANTALLA M. 2006. Genetic variation and environmental effects on agronomical and commercial quality traits in the main European market classes of dry bean. Field Crop Res 95: 336-347.
- JAHUFER MZZ, COOPER M AND HARCH BD. 1997. Pattern analysis of the diversity of morphological plant attributes and herbage yield in a world collection of white clover (Trifolium repens L.) germplasm characterised in a summer moisture stress environment of Australia. Gen Res Crop Evol 44: 289-300.
- LEE SJ, YAN W, JOUNG KA AND ILL MC. 2003. Effects of year, site, genotype, and their interaction on the concentration of various isoflavones in soybean. Field Crop Res 81: 181-192.
- MA BL, YAN W, DWYER LM, FREGEAU-REID J, VOLDENG HD, DION Y AND NASS H. 2004. Graphic analysis of genotype, environment, nitrogen fertilizer, and their interactions on spring wheat yield. Agron J 96: 169-180.
- MAMAN N, MASON SC, LYON DJ AND DHUNGANA P. 2004. Yield components of pearl millet and grain sorghum across environments in the central Great Plains. Crop Sci 44: 2138-2145.
- MOHAMMADI R AND AMRI A. 2011. Graphic analysis of trait relations and genotype evaluation in durum wheat. J Crop Improv 25(6): 680-696.
- MOHAMMADI SA, PRASANNA BM AND SINGH NN. 2003. Sequential path model for determining interrelationships among grain yield and related characters in maize. Crop Sci 43: 1690-1697.
- OBER ES, BLOA ML, CLARK CJA, ROYAL AK, JAGGARD W AND PIDGEON KW. 2005. Evaluation of physiological traits as indirect selection criteria for drought tolerance in sugar beet. Field Crop Res 91: 231-249.
- OLADEJO AS, AKINWALE RO AND OBISESAN IO. 2011. Interrelationships between grain yield and other physiological traits of cowpea cultivars. African Crop Sci J 3: 189-200.
- PETERSON DM, WESENBERG DM, BURRUP DE AND ERICKSON CA. 2005. Relationships among agronomic traits and grain composition in oat genotypes grown in different environments. Crop Sci 45(1): 249-255.
- RASHED MS, SADAQAT HA AND BABAR M. 2002. Correlation and path coefficient analysis for yield and its components in Rice (Oryza sativa L.). Asian J Plant Sci 3: 241-244.
- REDDY JN, DE RN AND SURIYA RAO AV. 1997. Correlation and path analysis in lowland rice under intermediate (0-50 cm) water depth. Oryza 34: 187-190.
- RUBIO J, CUBERO JI, MARTIN LM, SUSO MJ AND FLORES F. 2004. Biplot analysis of trait relations of white lupin in Spain. Euphytica 135: 217-224.
- SABAGHNIA N AND JANMOHAMMADI M. 2014. Interrelationships among some morphological traits of wheat (Triticum aestivum L.) cultivars using biplot. Bot Lith 20(1): 19-26.
- SABAGHNIA N, BEHTASH F. AND JANMOHAMMADI M. 2015. Graphic analysis of trait relations of spinach (Spinacia oleracea L.) landraces using the biplot method. Acta Univers Agric Silv Mendel Brun 63(4): 1187-1194.
- SAFARI DOLATABAD S, CHOUKAN R, MAJIDI HERVAN E AND DEHGHANI H. 2010. Multienvironment analysis of traits relation and hybrids comparison of maize based on the genotype by trait Biplot. Americ J Agric Biol Sci 5(1): 107-113.
- SAMONTE SOPB, TABIEN RE AND WILSON LT. 2013. Parental selection in rice cultivar improvement. Rice Sci 20(1): 45-51.
- SAMONTE SOPB, WILSON LT AND MCCLUNG AM. 1998. Path analyses of yield and yield-related traits of fifteen diverse rice genotypes. Crop Sci 38(5): 1130-1136.
- SAMONTE SOPB, WILSON LT AND TABIEN RE. 2006. Maximum node production rate and main culm node number contributions to yield and yield-related traits in rice. Field Crop Res 96(2): 313-319.
- SES - STANDARD EVALUATION SYSTEM FOR RICE. 2002. International Rice Research Institute. P.O. Box 933, 1099 Manila, Philippines.
- SUREK H AND BESER N. 2003. Correlation and path coefficient analysis for some yield-related traits in rice (Oryza sativa L.) under thrace conditions. Turkey J Agric 27: 77-83.
- YAN W. 2001. GGEbiplot-a Windows application for graphical analysis of multi-environment trial data and other types of two-way data. Agron J 93: 1111-1118.
- YAN W AND FRÉGEAU-REID J. 2008. Breeding line selection based on multiple traits. Crop Sci 48: 417-423.
- YAN W, HUNT LA, SHENG Q AND SZLAVNICS Z. 2000. Cultivar evaluation & mega-environment investigation based on GGE biplot. Crop Sci 40: 596-605.
- YAN W AND KANG MS. 2003. GGE biplot analysis: A graphical tool for breeders, geneticists, and agronomists. CRC Press, Boca Raton, FL.
- YAN W, KANG MS, MA B, WOOD SS AND CORNELIUS PL. 2007. GGE biplot vs. AMMI analysis of genotype-by-environment data. Crop Sci 47(5): 643-655.
- YAN W AND RAJCAN I. 2002. Biplot evaluation of test sites and trait relations of soybean in Ontario. Crop Sci 42: 11-20.
- YAN W, TINKER NA, MOLNAR S, MCELROY A AND FREGEAU-REID J. 2007. Associations among oat traits and their responses to the environment in North America. J Crop Improv 20: 1-29.
Publication Dates
-
Publication in this collection
Jan-Mar 2018
History
-
Received
07 Dec 2015 -
Accepted
19 May 2016

 GY - Grain yield (kg ha-1); PH - plant height (cm); DF - day to flowering; NPP - number of panicle per plant; PL - panicle length (cm); SNP - number of spikelet per panicle; IL - internodes length (cm); FG - number of filled grains per panicle; UNG - number of unfilled grains per panicle; F - grain productivity (%); HGW - hundred grain weight (g), SL - grain length (mm); SW - grain width (mm); SL/W - grain length to width ratio; RY - ratton yield (kg ha-1); PW - panicle weight (g); AC - amylose content (%) and GT - gelatinization temperature (scale). The name of genotypes is presented in