Abstract
Sugarcane (Sacharum officinarum L.) monocropping has had a great socio-economic and environmental impact in Brazil, and agroforestry systems have been considered as an alternative for more sustainable production; however, there is a lack of field research under such conditions. The aim of this study was to evaluate the growth rates, radiation use efficiency and yield traits in sugarcane cultivated in the understory of Aleurites fordii, in two agroforestry arrangements and monocropping systems. A field experiment was conducted from July 2015 to June 2016 in the city of Frederico Westphalen, Rio Grande do Sul, Brazil. The radiation use efficiency, assimilate partitioning, leaf area index, absolute growth rate, net assimilation rate, number of tillers, plant height, % of intercepted solar radiation, extinction coefficient, and yield in each system was evaluated. In agroforestry systems, the dynamic interactions between multiple plant species change with the time and can result in unique microclimates. The use of agroforestry systems in 12 x 12m arrangements should be prioritized because it enables greater yields and radiation availability in the understory. This study sought to provide new sustainable alternatives for farmers in order to increase the diversification of the rural property and maintain the preservation of existing agroecosystems.
Key words
biomass partitioning; crop systems; growth rates; Sacharum officinarum; yield traits
INTRODUCTION
One of the greatest national and global challenges is to generate a balance between crop production and environmental preservation. In order to achieve this balance, it is necessary to meet the demand for food and energy without compromising existing agroecosystems (Godfray et al. 2010GODFRAY HCJ et al. 2010. Food security: the challenge of feeding 9 billion people. Science 327(5967): 812-818.). Agroforestry systems deserve to be highlighted in this scenario and are a promising strategy in order to achieve these objectives. These systems consist of integrated land uses, for example, land used for forestry purposes, crop production, and/or raising livestock. Such systems provide clear agro-ecological advantages over systems in which only one crop is grown (Brooker et al. 2014BROOKER RW et al. 2014. Improving intercropping: a synthesis of research in agronomy, plant physiology and ecology. New Phytol 206: 107-117.). Advantages include higher production per unit of land (Zhang et al. 2007ZHANG L, VAN DER WERF W, ZHANG S, LI B and SPIERTZ JHJ. 2007. Growth, yield and quality of wheat and cotton in relay strip intercropping systems. Field Crop Res 103: 178-188., Li et al. 2013LI L, ZHANG L and ZHANG F. 2013. Crop mixtures and the mechanisms of overyielding. In: Encyclopedia of Biodiversity. Waltham, MA, USA: Academic Press, p. 382-395.), greater resource-use efficiencies of water and nutrients (Vandermeer 1989VANDERMEER JH. 1989. The Ecology of Intercropping. Cambridge, UK: Cambridge University Press, p. 241., 2011VANDERMEER JH. 2011. The Ecology of Agroecosystems. Boston, MA, USA: Jones and Bartlett Publishers, p. 387.), greater carbon sequestration in the soil (Makumba et al. 2006MAKUMBA W, JANSSEN B, OENEMA O, AKINNIFESI FK, MWETA D and KWESIGA F. 2006. The long-term effects of a gliricidia–maize intercropping system in southern Malawi, on gliricidia and maize yields, and soil properties. Agric Ecosyst Environ 116: 85-92., Cong et al. 2014CONG WF, HOFFLAND E, LI L, SIX J, SUN JH, BAO XG, ZHANG FS and VAN DER WERF W. 2014. Intercropping enhances soil carbon and nitrogen. Glob Chang Biol 21: 1715-1726.), and an increased input of organic matter, which has been shown to improve chemical, physical and biological properties of soil (Tracy and Zhang 2008TRACY BF and ZHANG Y. 2008. Soil compaction, corn yield response, and soil nutrient pool dynamics within an integrated crop-livestock system in Illinois. Crop Sci 48(3): 1211-1218., Salton et al. 2013SALTON JC, MERCANTE FM, TOMAZI M, ZANATTA JA, CONCENÇO G, SILVA WM and RETOREA M. 2013. Integrated crop livestock system in tropical Brazil: toward a sustainable production system. Agric Ecosyst Environ 190: 70-79.).
Intercropping is a dominant strategy of agriculture in many parts of the world, i.e. sub-Saharan Africa and large parts of Latin America, and provides an estimated 20% of the world’s food supply (Altieri 2009ALTIERI MA. 2009. Agroecology, small farms, and food sovereignty. Monthly Review 61(3): 102-113., Chappell et al. 2013CHAPPELL MJ et al. 2013. Food sovereignty: an alternative paradigma for poverty reduction and biodiversity conservation in Latin America. F1000 Research 2: 235-253.). Despite the great potential of intercropping, little research has been carried out to determine the traits of cultivated species which drive the positive effects of intercropping systems.
Brazil is one of the major sugarcane producing countries in the world, with estimates for 2015/2016 of 8.97 million hectares in planted area, which yields 685 million tons of sugarcane, with an average yield of 76 tons ha-1 (Conab 2017CONAB - COMPANHIA NACIONAL DE ABASTECIMENTO. 2017. Acompanhamento da Safra Brasileira de Cana-De-Açúcar. Disponível em: http://www.conab.gov.br/OlalaCMS/uploads/arquivos/16_08_18_12_03_30_boletim_cana_portugues_-_2o_lev_-_16-17.pdf. Acesso em 14 de junho de 2016.
http://www.conab.gov.br/OlalaCMS/uploads...
). Sugarcane (Sacharum officinarum L.) monocropping has had a great socio-economic and environmental impact in Brazil, and agroforestry systems (AFs) have been considered as an alternative for the sustainable production in threatened ecosystems. Despite the potential for AFs previously described, little research has been carried out to assess plant growth, yield traits, and the dynamics of resources available in these systems.
The dynamic interactions between plants in agroforestry systems are especially relevant in areas in which plants grow beneath trees, given that a tree’s height, crown projection, and leaf area index can influence the distribution of existing resources such as solar radiation (Muller et al. 2014MULLER MD, PACIULLO DSC, MARTINS CE, ROCHA WSD and CASTRO CRT. 2014. Desenvolvimento vegetativo de pinhão manso em diferentes arranjos de plantio em sistemas agrossilvipastoris. Pesq Agropec Bras 49(7): 506-514., Elli et al. 2016ELLI EF, CARON BO, ELOY E, BEHLING A, SOUZA VQ and SCHWERZ F. 2016. Productive, morphological and qualitative characteristics of sugarcane in the understory tree species in agroforestry systems. Afr J Agric Res 11(17): 1576-1584.). The amount of solar radiation transmitted through the canopy can be presented in direct or diffuse forms, which is a determining factor in the internal microclimate of a system (Pezzopane et al. 2015PEZZOPANE JRM, BOSI C, NICODEMO MLF, SANTOS PM, CRUZ PGD and PARMEJIANI RS. 2015. Microclimate and soil moisture in a silvopastoral system in southeastern Brazil. Bragantia 74(1): 110-119.). Direct and diffuse radiation can affect radiation use efficiency and light extinction coefficients (Campbell and Norman 1998CAMPBELL GS and NORMAN JM. 1998. The light environment of plant canopies. In: An Introduction to Environmental Biophysics. Springer New York, p. 247-278.), which in turn may modify the growth rate (Pinto et al. 2005PINTO LFG, BERNARDES MS, STAPE JL and PEREIRA AR. 2005. Growth, yield and system performance simulation of a sugarcane–eucalyptus interface in a sub-tropical region of Brazil. Agric Ecosyst Environ 105(1): 77-86.), assimilation and partitioning of photoassimilates produced by species in the understory (Mendes et al. 2013MENDES MMS. 2013. Desenvolvimento do milho sob influência de árvores de pau branco em sistema agrossilvipastoril. Pesq Agropec Bras 48(10): 1342-1350.). In the case of sugarcane, the response due to reduced radiation available within the canopy can be optimized. Sugarcane, a C4 metabolism plant, has a high solar radiation demand, in order to meet the photosynthetic rates of plants.
Biomass production in plants depends upon the quantity of absorbed photosynthetically active radiation (PARa) by leaves, and the efficiency by which leaves convert and assimilate the radiant light through photosynthesis. Thus, the intercepted photosynthetically active radiation (PARi) that is converted into biomass reveals the efficiency of the use of radiation (εb) by a species (Monteith 1977MONTEITH JL. 1977. Climate and the efficiency of crop production en Britain. Philos T Roy Soc B 181: 277-294., Van Heerden et al. 2010VAN HEERDEN PDR, DONALDSON RA, WATT DA and SINGELS A. 2010. Biomass accumulation in sugarcane: unravelling the factors underpinning reduced growth phenomena. J Exp Bot 61(11): 2877-2887.). While photosynthesis is the basis for the production of biomass, little attention has been given to the radiation use efficiency in order to improve sugarcane yields (Zhu et al. 2010ZHU XG, LONG SP and ORT DR. 2010. Improving photosynthetic efficiency for greateryield. Annu Rev Plant Biol 61: 235-261., Flood et al. 2011FLOOD PJ, HARBINSON J and AARTS MGM. 2011. Natural genetic variation in plant photosynthesis. Trends Plant Sci 16(6): 327-335.). Solar radiation intercepted by the plant canopy is the most important component for growth analysis, but to estimate this radiation, it is necessary to know the LAI and the extinction coefficient.
Solar radiation can change at different points in the understory of agroforestry systems (Paciullo et al. 2011PACIULLO DSC, GOMIDE CAM, CASTRO CD, FERNANDES PB, MÜLLER MD, PIRES MFA, FERNANDES EM and XAVIER DF. 2011. Características produtivas e nutricionais do pasto em sistema agrossilvipastoril, conforme a distância das árvores. Pesq Agropec Bras 46(10): 1173-1186.), depending on the area of shade provided by the canopy, and the orientation and spacing of the trees. Thus, new projects should be developed in order to evaluate the growth, yield, and radiation use efficiency of sugarcane cultivated in different agroforestry arrangements, as well as in different positions within each system. There is a lack of published results for field experiments under such conditions.
To address this lack of information, the following hypothesis was created: The cultivation of sugarcane in agroforestry systems provides greater yield, radiation use efficiency, and plant growth, and thus can be recommended to farmers as a sustainable alternative of production in threatened ecosystems. The aim of this study was to evaluate the growth rates, radiation use efficiency, and yield traits of sugarcane cultivated in the Aleurites fordii understory, in two agroforestry arrangements and a monocropping system.
MATERIALS AND METHODS
STUDY AREA AND EXPERIMENTAL DESIGN
A field experiment was conducted from July 2015 to June 2016 in the city of Frederico Westphalen, Rio Grande do Sul, Brazil, at the coordinates 27º23’48’’ S, 53º25’45’’ W and an altitude of 490 m. According to Köppen’s climate classification (Alvares et al. 2013ALVARES CA, STAPE JL, SENTELHAS PC, MORAES G, LEONARDO J and SPAROVEK G. 2013. Köppen’s climate classification map for Brazil. Meteorol Z 22: 711-728.), the climate is Cfa, i.e., humid subtropical with a mean annual temperature of 19.1°C, and varying maximum and minimum temperatures of 38ºC and 0°C, respectively. The experiment was performed in ratoon sugarcane (1st cut performed on 07/26/2012), and the analyses were conducted in the 4th cut, crop cycle 2015/2016. The soil of the experimental area was classified as typical Oxisol. Fertilization was carried out in response to a soil analysis following the recommendations for sugarcane crops by soil chemistry and fertility committee (SCFC 2004SCFC - SOIL CHEMISTRY and FERTILITY COMMITTEE. 2004. Manual de adubação e calagem para os estados do Rio Grande do Sul e Santa Catarina. Porto Alegre: Sociedade Brasileira de Ciência do Solo – Núcleo Regional Sul, p. 400.).
The experimental design was a randomized complete block, characterized by a factorial arrangement of 3 x 3 x 8, with three cropping systems, two agroforestry systems (12 x 12 and 6 x 6) and an isolated system with sugarcane; three positions in line of the agroforestry systems (Line 1, Line 2 and Line 3); and eight months of plant collection, with three repetitions. The first evaluation of sugarcane occurred in September 2015 and the last in May 2016. The sugarcane utilized was developed by the Agronomic Institute of Campinas (IAC), cultivar IAC 87-3396, which is characterized by a high yield, sucrose content, and excellent adaptation to soils with lower fertility.
In the 12 x 12 system, forest species were distributed in lines spaced at 12m. The sugarcane was distributed in eight lines arranged in correspondence to each interval between the lines of forest species, totaling 16 lines throughout the system. In the 6 x 6 system, the forest species was planted in lines spaced at 6m. The sugarcane was distributed in four lines in each interval corresponding with lines of Aleurites fordii plants. A total of 15 trees were allocated to each experimental unit. The forest species were planted in the experimental field in September, while the sugarcane was planted in November 2011. After plowing and harrowing seedlings were manually planted. In both systems, the sugarcane had a spacing of 1.20m and a density of 16 buds per meter, with both tree and sugarcane lines oriented from East to West. After planting the sugarcane, plots were delineated by stakes set two meters apart and were distributed at different points in the understory of each experimental unit. In the 12 x 12 system lines L1, L2 and L3 of the evaluation were positioned at a distance of 1.2m, 3.6m and 4.8m from the Aleurites fordii species, respectively. Differently, in the 6 x 6 system lines L1, L2 and L3 were positioned at 1.2m, 2.4m and 1.2m, respectively. These plot areas were chosen with the objective of representing microclimate conditions in areas under the canopy of each agroforestry system. For subsequent analyses of the data, average values of the lines in each system were calculated in order to comply with the objectives of this study. The arrangement of tree, sugarcane, and plot of evaluation are shown in Figure 1.

A sketch of an experimental unit of the agroforestry systems (12 x 12 and 6 x 6) and the isolated system. Black circles represent the trees, continuous lines indicate where the sugarcane was planted, and the rectangles in grey represent the monthly evaluation plots of sugarcane.
Forest species Tung (Aleurites fordii), which belongs to the Euphorbiaceae family, an exotic species with deciduous characteristics, was used to establish the agroforestry system. It was chosen because of its adaptability to environmental conditions and high oil content in its fruits, which make it a viable option for the composition of agroforestry systems. Allometric characteristics of Aleurites fordii trees were evaluated using descriptive statistics (Table I).
Height (H), stem diameter (SD), diameter at breast height (DBH) and mean diameter of crown (MDC) of Aleurites fordii, in agroforestry systems (12 x 12 and 6 x 6), the plants were five years old.
PLANT GROWTH EVALUATIONS
The sugarcane was cut on July 2, 2015; evaluations started 84 days after cutting (DAC), due to the slow initial growth of shoots, evaluations were performed every 30 days, with the last at 332 DAC, amounting to 8 months of plant collection. In each evaluation period, a total of 42 plants were collected, and two representative plants per evaluation plot were analyzed, resulting in a total of 332 evaluated plants. On the day of collection, tiller numbers were counted and plant height was measured with a metric tape measure.
In the laboratory, plant sectioning was performed, as well as the preparation of leaf discs to determine the leaf area and dry matter partitioning. The total dry matter (TDM) of the plants was determined as the sum of the components: leaf, pseudoculm+senescent, and stalk. Each component was gathered and placed in labeled, individual paper sacks. The sacks were then sent into a forced circulation oven at 60°C until a consistent mass was obtained. The samples were later weighed on a precision balance in order to obtain the dry mass of each component, which together resulted in the TDM.
Leaf area (LA) was calculated according to the equation:
Where, n° discs = number of discs by sample; punch area = punch disc area in mm2; DM leaves = total dry matter of the leaves, in grams; and DM discs = dry matter of the disc, in grams. The leaf area index (LAI) from the total leaf area of each plant and the soil area (SA) occupied by plants was determined according to the equation: LAI = LA/SA.
Based on the results of dry matter and leaf area, the growth analysis of the variables was conducted: total dry matter (TDM, g m-2), absolute growth rate (AGR, g day-1); net assimilation rate (NAR, g m-2 day-1) according to the methodology described in the literature (Thornley 1976THORNLEY JMH. 1976. Mathematical models in plant physiology. Academic Press, London, p. 318., Marafon et al. 2012MARAFON AC. 2012. Análise quantitativa de crescimento em cana-de-açúcar: uma introdução ao procedimento prático. Documentos - Embrapa Tabuleiros Costeiros, p. 29.).
EXTINCTION COEFFICIENT AND LIGHT INTERCEPTION
Solar radiation at each evaluation period was measured using a portable sensor pyranometer (LICOR PY32164) coupled to a Datalogger (LICOR 1400). The values of incident global solar radiation were obtained from the meteorological station of the National Meteorology Institute, situated roughly 200m from the experiment. The values of active photosynthetically radiation were estimated to be 45% of global solar radiation. This fraction follows the average values found by Assis and Mendez (1989)ASSIS FN and MENDEZ MEG. 1989. Relação entre radiação fotossinteticamente ativa e radiação global. Pesq Agropec Bras 24(7): 797-800.. The estimation of accumulated photosynthetically active radiation was based on the methods by Monteith (1977) and Varlet-Grancher et al. (1989)VARLET-GRANCHER CG, GOSSE M, CHARTIER H, SINOQUET R, BONHOMME R and ALLIRAND JM. 1989. Mise au point: rayonnement solaire absorbé ou intercepté par un couvert végétal. Agronomie 9(5): 419-439..
The extinction coefficient (k) was calculated using the following equation:
Where k = extinction coefficient; Rn = solar radiation measured under the plant canopy (MJ m-2); Rt = radiation above the plant canopy (MJ m-2); LAI = leaf area index.
The values for intercepted global radiation (IGR) were measured monthly, where the incident radiation was measured above and under the plant canopy with a portable pyranometer, which recorded measurements in the period from 10 to 12h. The values of intercepted global radiation were obtained according to the following equation:
Where: Rn = incident radiation under the canopy; Rt = incident radiation above the canopy.
RADIATION USE EFFICIENCY
Production of dry matter was based on the model proposed by Monteith (1977), whereby the dry matter production was calculated from intercepted photosynthetically active radiation (PARi) multiplied by the use efficiency. The εb was calculated by the relation between the average production of accumulated TDM and the PARi involved in the production of biomass according to the following expression:
Where TDM = total dry matter produced (g m-2); PARi = intercepted photosynthetically active solar radiation (MJ.m-2); and εb = radiation use efficiency of dry matter produced (g. MJ-1). The value of the radiation use efficiency given by the angular coefficient represents the amount of accumulated biomass for each unit of intercepted energy.
Values for intercepted photosynthetically active radiation were based on the model proposed by Varlet-Grancher et al. (1989):
Where: PARi = intercepted photosynthetically active radiation (MJ.m-2); PARinc = incident irradiant photosynthetically active radiation (MJ.m-2); k = extinction coefficient, which was set to 0.20 for all systems, as this was the average value obtained in this study; LAI = leaf area index.
YIELD TRAITS AND STATISTICAL ANALYSIS
The yield traits were evaluated at 350 DAP, by collecting and weighing the sugarcane stalk samples from each plot, and each of the twelve different positions in each system, in order to obtain greater homogeneity of the samples. The yield was determined on the basis of the variables stalk weight and juice volume. The stalk weight (SW, t ha-1) was obtained with the aid of a digital scale. The juice volume (JV, m3 ha-1), was obtained from milling the stalk and measuring the obtained juice with the aid of a graduated cylinder with a capacity of 1 L.
The data were statistically analyzed with the software “Statistical Analysis System” (SAS 2003SAS. 2003. Getting started with the SAS Learning Edition. Cary, 200 p.). According to the F test, significant differences were found at 5% probability among the cropping systems. We reject the null hypothesis H0. The Dunnet test (p> 0.05) was used to compare the 12 x 12 and 6 x 6 intercropping systems with the control (monocropping system) and the Tukey test (p> 0.05) to compare the difference between intercropping systems 12 x 12 and 6 x 6. In addition, a regression analysis for the variable of intercepted global radiation was performed.
RESULTS
METEOROLOGICAL CONDITIONS
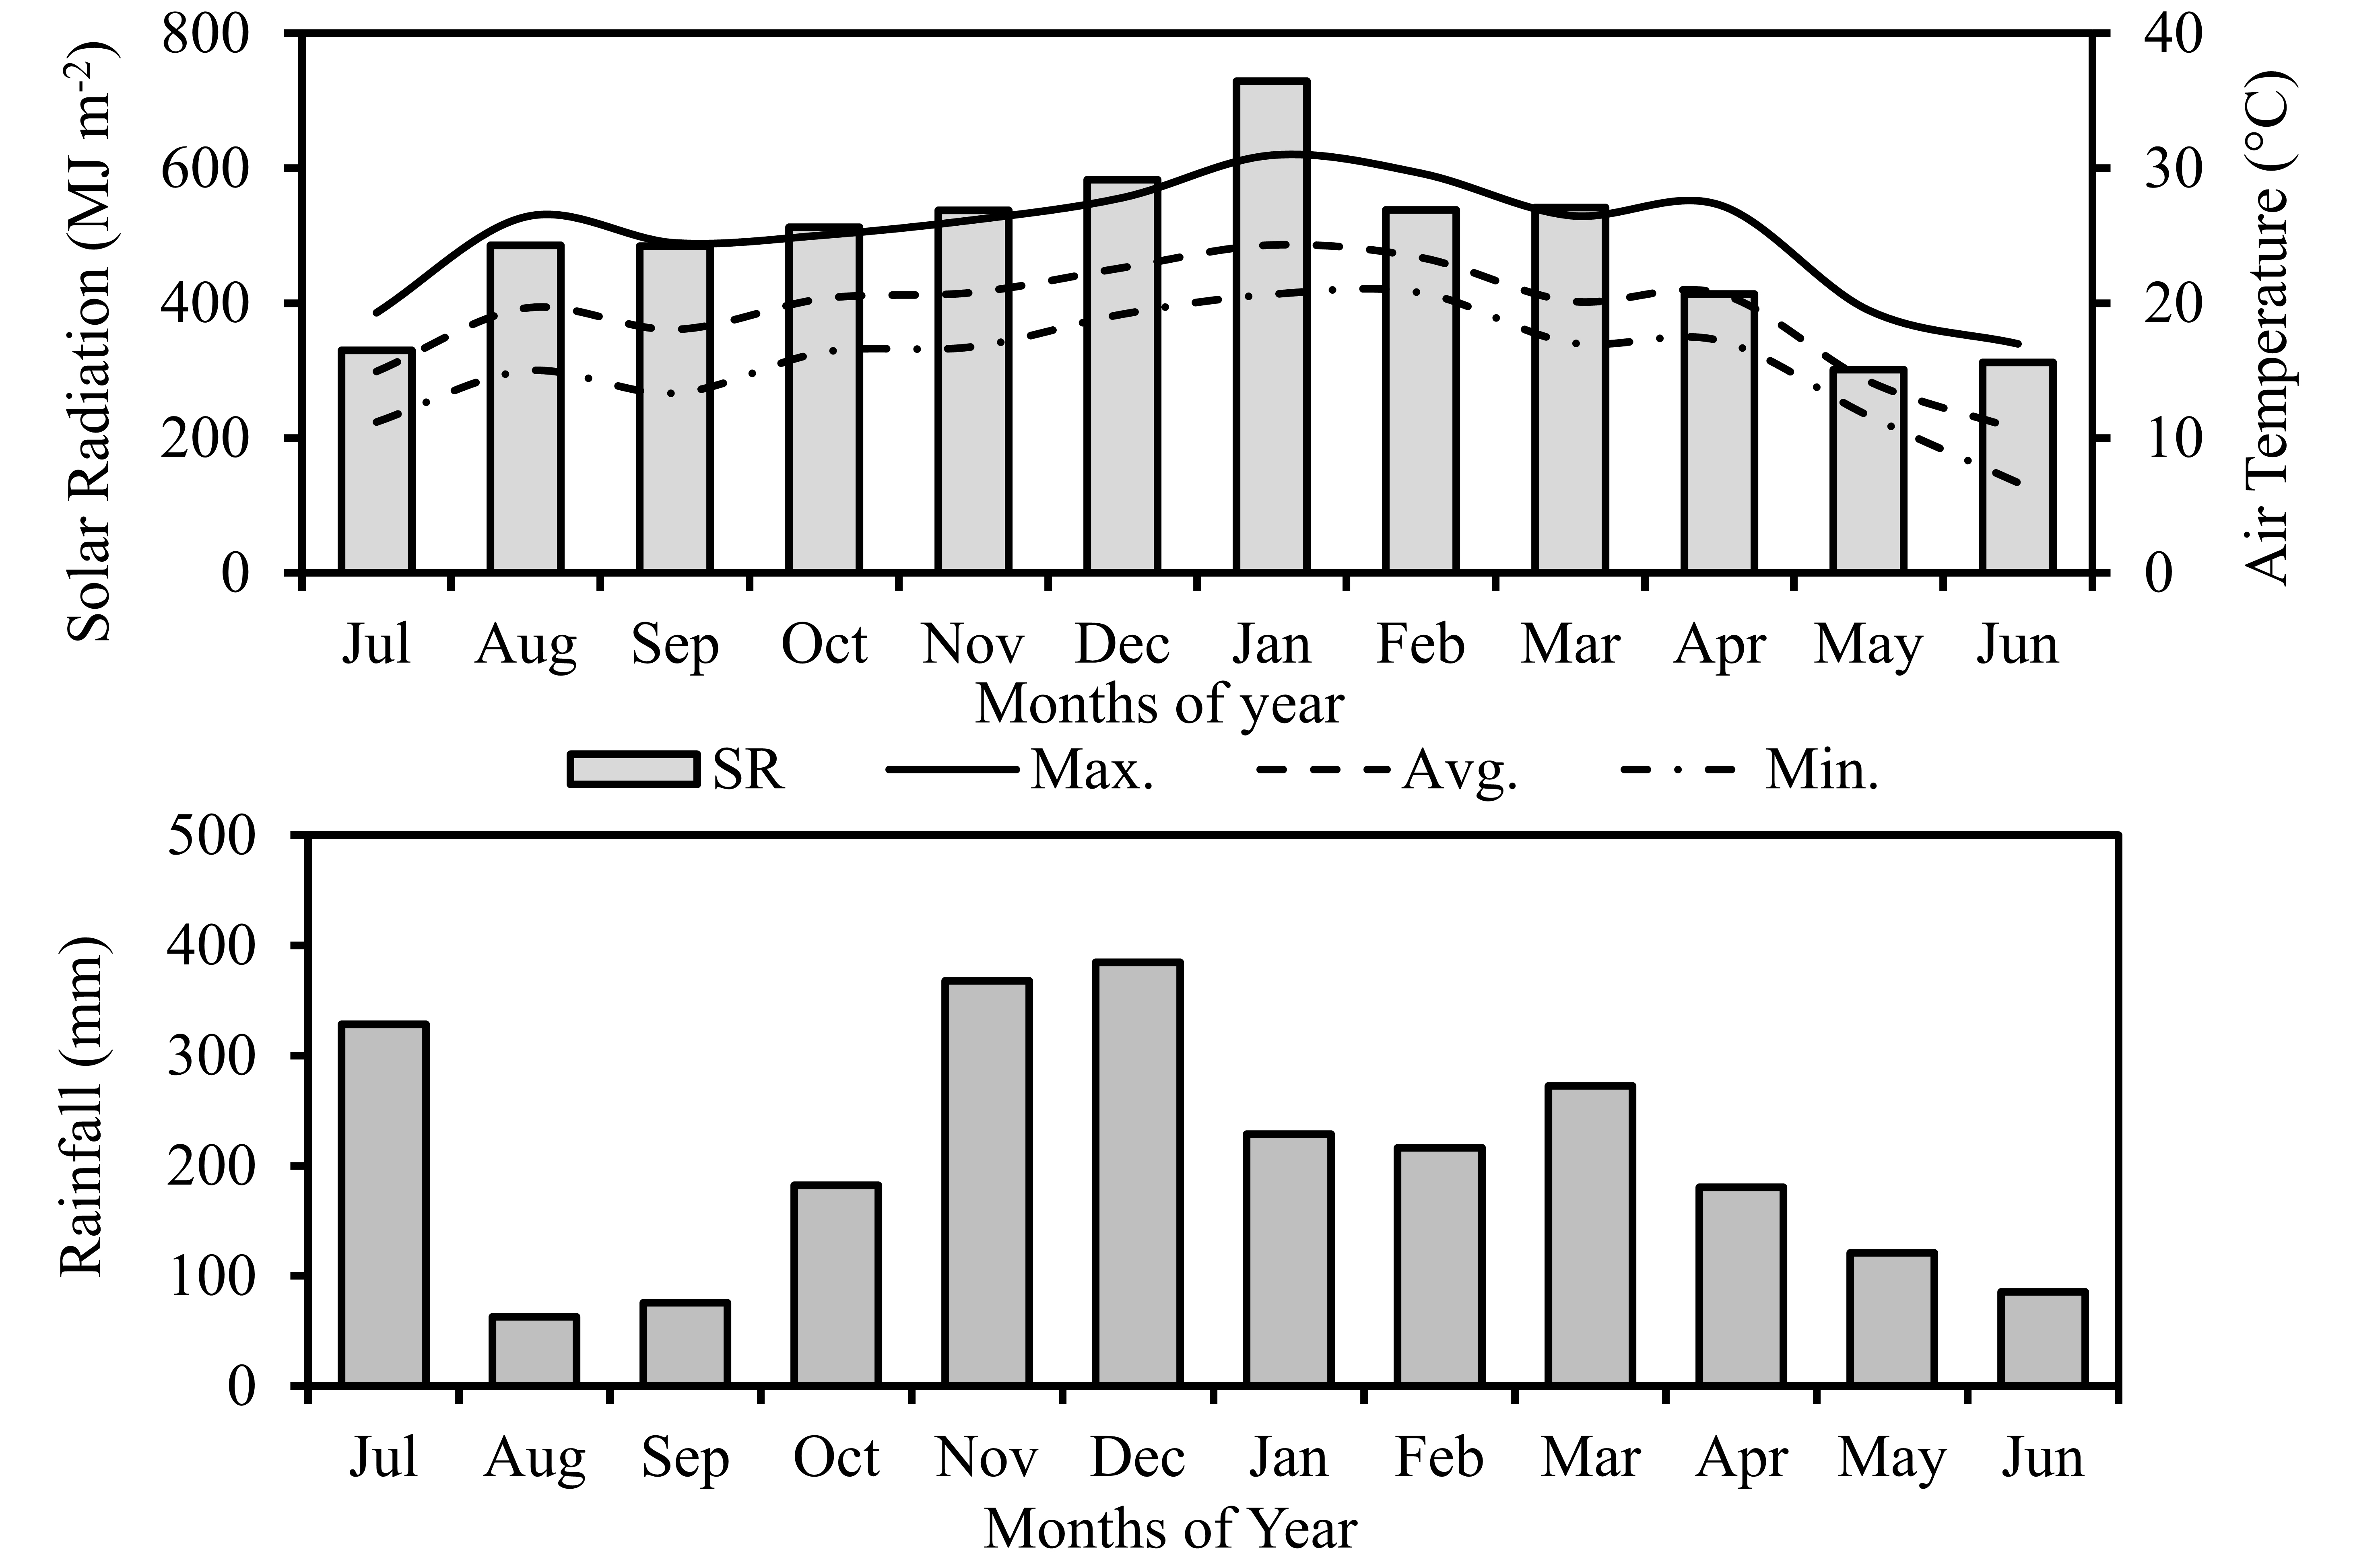
The air temperature during the sugarcane crop cycle ranged from 6.3ºC to 31.0ºC, with an average temperature of 19.2ºC; the flux of global solar radiation was 15.89 MJ.m-2.dia-1 on average, with a variation of 1.98 to 33.03 MJ.m-2.dia-1; the rainfall accumulated during the crop cycle was 2587.5mm (Figure 2).

Monthly average values of minimum, maximum and average temperature, accumulated incident solar radiation, and accumulated rainfall during the experimental period (07/02/2015 to 06/24/2016).
RADIATION USE EFFICIENCY AND LIGHT INTERCEPTION
Growth of TDM presented a positive linear relationship with PARia during the crop cycle and presented high correlation coefficients (Figure 3a). We observed variations in the radiation use efficiency of the conversion into biomass, in different cropping systems and evaluation lines within the agroforestry systems.

The relationship between accumulated intercepted photosynthetically active radiation (PARiac) and dry matter produced (DM) (a); and intercepted global radiation of sugarcane in agroforestry and isolated systems in different lines of evaluation throughout the days after cutting (b).
Of the crop systems, the greatest radiation use efficiency of sugarcane was obtained by the isolated system (2.28 g MJ-1). In relation to the evaluation lines, we observed that for the 12 x 12 system, line 3 showed a greater efficiency, 2.03 g MJ-1, when compared to the lines L1 and L2, which showed values of 1.89 and 1.85 g MJ-1, respectively, revealing a 9% difference for plants located in the center of the plot. For the 6 x 6 system, we observed a greater radiation use efficiency in line 2, which demonstrated 1.96 g MJ-1, i.e., 10 and 6% higher than the values in line 1 (1.77 g MJ-1) and line 3 (1.84 g MJ-1) of the evaluation, respectively (Figure 3a).
The intercepted global radiation showed a quadratic response for the different cropping systems and evaluation lines (Figure 3b). The greatest amount of intercepted global radiation was observed for the isolated system of sugarcane, which intercepted 89.3% of incident radiation at 237 DAC. In the agroforestry systems, we found different response values for each evaluation line. In the 12 x 12 system, we observed a reduction of 16.5 and 12.5% in the interception of radiation with the sugarcane lines nearest to the forest species (L1 and L2), when compared to L3, which intercepted 85.4% of the radiation at 265 DAC. Furthermore, the 6 x 6 system showed a similar response, where lines L1 and L3 presented lower values of 13 and 8.5% in the interception of radiation compared to the L2 evaluation line, which showed 82.3% interception of the incident solar radiation at 265 DAC (Figure 3b).
LIGHT EXTINCTION COEFFICIENT
The k values were similar in the different cropping systems (Table II). In the initial stages of plant growth, k values were 0.15 on average. Due to the plant growth, through the elevated LAI and dry matter accumulation (Figure 4), the extinction coefficient showed increased values, with a maximum value of 0.32 at 237 DAC. Considering the crop cycle and generalizing the crop systems, the average light extinction coefficient for the sugarcane crop was 0.20.

Leaf area index (a) and total dry matter (b) of sugarcane in agroforestry and isolated systems in different lines of evaluation throughout the days after cutting.
Light extinction coefficient with (± standard error) in different cropping systems of sugarcane cultivation throughout the days after cutting (DAC).
LEAF AREA INDEX AND DRY MATTER PRODUCTION
The highest values of LAI were observed in the stage of stalk growth, a period between 237-265 DAC. The isolated system had the highest LAI, 7.1; additionally, the intercropping system provided changes in values of LAI in accordance with the line position. The 12 x 12 system showed the highest value in line 3, with a value of 6.2, which is 15.6 and 12.5% higher than in lines 1 and 2, respectively. In the 6 x 6 system, the highest LAI was found in line 2, with values around 6.4; these values were 14.5 and 11.6% higher than those obtained by lines 1 and 3, respectively (Figure 4a).
Dry matter accumulated during the cycle of sugarcane presented a positive linear relation, with an observed stabilization for 300 DAC. This period marks the beginning of the maturation of stalks, which can be noted by the reductions in growth rates and an increase in sucrose content of stalks (Figure 4b). The greatest values for total accumulated dry matter were observed in the isolated system, which increased a total of 592.7 g plant-1. For the intercropping systems, a similar response in accumulated dry matter was obtained from the different evaluation positions in the understory. While the 12 x 12 system had a total of 504.8 g plant-1 on average, the accumulation total of dry matter of the 6 x 6 system was found to be 469.3 g plant-1 (Figure 4b).
GROWTH RATES
The absolute growth rate and net assimilation rate throughout the crop cycle are shown in Figure 5. The response curves demonstrated similar behavior for the analyzed variables. We were able to observe two peaks during the crop cycle; the first occurred at 200 DAC and the second at 300 DAC, with a subsequent decrease in growth rates in accordance with the senescence of the leaves and stalk maturation. In addition, a similar response in the different crop systems and lines of evaluation was verified. Overall, the largest absolute growth rate and net assimilation rates were observed at 206 DAC, this stage corresponds with intense stalk growth.

Absolute growth rate (a) and net assimilation rate (b) of sugarcane in agroforestry and isolated systems in different lines of evaluation throughout the days after cutting.
The number of tillers in sugarcane reduces in accordance to the DAC, stabilizing at 265 DAC (Figure 6a). Overall, a similar response between the crop systems and lines of evaluation throughout the crop cycle were observed. In the initial growth stages, a period of intense tillering, we observed an average of 10 tillers m-2. In the stage of maturation, we found values between 4 to 5 tillers m-2, a reduction of more than 50% in the number of tillers. In relation to plant height (Figure 6b), we observed a linear response in accordance to the DAC, with stabilization in height from 300 DAC onwards. Overall, the plants presented values of approximately 265 cm.

Number of tillers (a) and plant height (b) of sugarcane in agroforestry and isolated systems in different lines of evaluation throughout the days after cutting.
BIOMASS PARTITIONING
The pattern of dry matter accumulation in the leaves, pseudoculm+senescent, and stalks of sugarcane was similar for the different cropping systems (Figure 7). In the initial stages of plant growth, up to 115 DAC, the leaves and pseudoculm+senescent were responsible for 100% of total dry matter accumulation, 50% for each compartment on average; the dry matter of the stalks was computed from 115 DAC onwards. At 206 DAC the plants showed stabilization in the partition of assimilates up to the harvest; where the leaves (20%) pseudoculm+senescent (5%) and stalk (75%) were responsible for the total dry matter accumulated by the sugarcane crop.

Biomass partitioning in sugarcane plants in different cropping systems throughout the days after cutting. Each bar represents the mean value of twelve replications (± s.e.).
YIELD TRAITS
According to the variance analysis, we observed a significant difference for the variables stalk weight and juice volume in the different cropping systems (Figure 8). The stalk weight and juice volume in sugarcane grown in the isolated system were higher than those observed in the agroforestry systems (Figure 8). We observed a reduction of 17.5 and 32.7% of stalk weight for the 12 x 12 and 6 x 6 systems, respectively, when compared to the isolated system by the Dunnet test (p> 0.05). Additionally, between the crop systems, the stalk yield was 18.4% greater in the 12 x 12 system than in the 6 x 6 according to the Tukey test (p> 0.05). In relation to the juice volume produced, a similar response to the stalk weight was observed, confirming the correlation between these variables, where the isolated system also showed a higher juice volume. We also observed a reduction of 16.6 and 35.3% by juice volume produced in the 12 x 12 and 6 x 6 systems, respectively. In addition, between agroforestry systems, the juice volume of the 12 x 12 system was 22.5% higher than in the 6 x 6 system. With this, we can infer that the 12 x 12 system showed greater stalk yields and volume of produced juice, compared to the 6 x 6 system.

Stalk weight and juice volume in sugarcane plants in different agroforestry and monocropping systems. Each bar represents the mean value of twelve replications (± s.e.). Means followed by the same letter do not differ among themselves. Uppercase compare the agroforestry systems with the control (Monocropping), by Dunnet test (p> 0.05); and lowercase compare the agroforestry systems (12 x 12 and 6 x 6m), by Tukey test (p> 0.05).
DISCUSSION
The meteorological conditions during the growing cycle were favorable for sugarcane, especially with respect to the air temperature and water availability. Sugarcane needs 1500 to 2500mm of water evenly distributed over the growing season (FAO 2013FAO - FOOD and AGRICULTURAL ORGANIZATION. 2013. Water, Natural Resources Management and Environment Department. Available at: http://www.fao.org/nr/water/index.html. Accessed on June 29, 2016.
http://www.fao.org/nr/water/index.html....
).
Within the agroforestry system the positioning of sugarcane lines is very important, and therefore should be considered in studies with intercropping systems; the canopy of forest species can result in changes to microclimates. In this case, the canopy provided a reduction in LAI (Figure 4a) and consequently in intercepted radiation (Figure 3b) in the lines of sugarcane near the tree species, resulting in an overall lower radiation use efficiency by plants. The growth and development of different species in the same area cause dynamic interactions in species planted near one another, which changes with the time. These interactions modify the distribution of existing resources in the system (Muller et al. 2014), with the solar radiation changing first.
The results observed are consistent with those of Marchiori et al. 2014MARCHIORI PE, MACHADO EC and RIBEIRO RV. 2014. Photosynthetic limitations imposed by self-shading in field-grown sugarcane varieties. Field Crop Res 155: 30-37., who reported that excessive shading may affect certain growth traits causing decreases in tillering and in photosynthetically active leaf area, as well as in the interception of solar radiation, producing thinner, elongated stalks. In addition, excessive shading during extended periods may affect the photosynthetic apparatus as a result of decreases in chlorophyll content (Chl), in nitrogen content, and in the Chl a/b ratio (Pearcy 1998PEARCY RW. 1998. Acclimation to sun and shade. In: Raghavendra AS (Ed), Photosynthesis: A Comprehensive Treatise. Cambridge University Press, Cambridge, p. 250-263., Dinç et al. 2012DINÇ E, CEPPI MG, TÓTH SZ, BOTTKA S and SCHANSKER G. 2012. The chl a fluorescenceintensity is remarkably insensitive to changes in the chlorophyll content of the leaf as long as the chl a/b ratio remains unaffected. Biochim Biophys Acta 1817(5): 770-779.).
The values of radiation use efficiency obtained in this study are similar to what has been observed by other authors: De Silva and De Costa (2012)DE SILVA ALC and DE COSTA WAJM. 2012. Growth and radiation use efficiency of sugarcane under irrigated and rain-fed conditions in Sri Lanka. Sugar Tech 14(3): 247-254. found values of RUE which vary from 1.63 to 2.09 g MJ-1 and 0.71 to 1.03 g MJ-1 under irrigated and rain-fed conditions in Sri Lanka; Anderson et al. (2015)ANDERSON RG, TIRADO-CORBALÁ R, WANG D and AYARS JE. 2015. Long-rotation sugarcane in Hawaii sustains high carbon accumulation and radiation use efficiency in 2nd year of growth. Agric Ecosyst Environ 199: 216-224., analyzing the RUE in two crop sites in Hawaii, USA, found average values of 1.24 ± 0.22 g MJ-1 during the period of growth for locations of low altitude and 1.15 ± 0 15 g MJ-1 for location of high altitude. The maximum RUE for sugarcane can vary between 1.7 g MJ-1 (Robertson et al. 1996ROBERTSON MJ, WOOD AW and MUCHOW RC. 1996. Growth of sugarcane under high input conditions in tropical Australia. Radiation use, biomass accumulation and partitioning. Field Crop Res 48(1): 11-25.) to 2.0 g MJ-1 (Muchow et al. 1997MUCHOW RC, EVENSEN CI, OSGOOD RV and ROBERTSON MJ. 1997. Yield accumulation in irrigated sugarcane: Utilization of intercepted radiation. Agron J 89(4): 646-652.).
In the national and international literature, RUE values for sugarcane grown in agroforestry systems have not been determined. Comparing the RUE values obtained from the monocropping system with those obtained in the intercropping systems in this study, even under the influence of the tree species, the sugarcane in the understory of agroforestry system showed high values for RUE and can, therefore, be recommended for cultivation in alternative production systems, such as agroforestry systems.
The lowest amount of radiation intercepted by the sugarcane in the 12 x 12 system, in the first and second lines of evaluation, as well as in the first and third lines in the 6 x 6 system, are associated with the effects of the canopy of the species Aleurites fordii, which shaded the sugarcane plants. Due to sugarcane’s high photosynthetic rate (C4 species), it needs a large amount of solar radiation to meet its photosynthetic demand. Plants submitted to different levels of shading (for example, in proximity of the evaluation line to the tree species) demonstrate changes in photosynthetic rate, and consequently, the production of assimilates, which influences the radiation use efficiency of plants.
The observed results are similar to those of Hardy et al. (2004)HARDY JP, MELLOH R, KOENIG G, MARKS D, WINSTRAL A, POMEROY JW and LINK T. 2004. Solar radiation transmission through conifer canopies. Agr Forest Meteorol 126: 257-270., who reported that the amount of radiation intercepted by the forestry species and consequently the radiation that reaches the ground level is determined by canopy characteristics, such as the average crown diameter and the size of the existing gaps in the canopy, which can all be affected modified by plant arrangement. Naturally, the probability of photosynthetically active radiation reaching the ground is inversely proportional to the degree in which it is intercepted by the canopy structure.
Péllico Netto et al. (2015)PÉLLICO NETTO S, SANQUETTA CR, CARON BO, BEHLING A, SIMON AA, CORTE APD and BAMBERG R. 2015. Ground level photosynthetically active radiation dynamics in stands of Acacia mearnsii De Wild. An Acad Bras Cienc 87: 1833-1845., evaluating the dynamics of solar radiation in the understory of Acacia mearnsii, concluded that in the center of the plot, i.e. between rows of trees, more than 70% of the radiation reaches the ground level. However, under the canopy, the values were reduced significantly, to only 20%, thereby diminishing the availability of radiation for understory crops. This confirmed the influence of the canopy trees on the interception of incident radiation. Our findings are in line with a study carried out by Pezzopane et al. (2015) and Bosi et al. (2014)BOSI C, PEZZOPANE JRM, SENTELHAS PC, SANTOS PM and NICODEMO MLF. 2014. Produtividade e características biométricas do capim-braquiária em sistema silvipastoril. Pesq Agropec Bras 49(6): 449-456. who reported the strong relation between levels of incident solar radiation, and its effect on microclimate, growth characteristics of plants, and soil moisture.
The growth of sugarcane was correlated to an increase in k values (Table II), coinciding with an increase in LAI. This result provides an increase in radiation interception up to a determined value when the plants reach a critical IAF and begin self-shading, resulting in an increased extinction coefficient. It can be inferred that independent of the cropping system, the k values depend primarily on the LAI, which determines the amount of solar radiation available in the understory of sugarcane. According to Behling et al. (2015)BEHLING A, SANQUETTA DR, DALLA CORTE AP, NETTO SP, RODRIGUES AL, CARON BO and SIMON AA. 2016. Tracking leaf area index and coefficient of light extinction over the harvesting cycle of black wattle. J For Res 27(6): 1211-1217., this condition is understandable since light attenuation of the plant canopy is determined by leaf density (which can be expressed by LAI) and also by the geometric characteristics of the leaves and the tree canopy, as well as the optical properties of the leaves. Thornley (1976) reported that the value of k may vary with leaf traits, sun angle, spacing, and latitude.
High values of LAI (> 6) resulted in the average k value of 0.20, for the conditions as observed in this study. Similar values were obtained by De Silva and De Costa (2012), who found values near to 0.27 in irrigated sugarcane in Sri Lanka, although other authors found values higher than those obtained in this study. Muchow et al. (1994MUCHOW RC, SPILLMAN MF, WOOD AW and THOMAS MR. 1994. Radiation interception and biomass accumulation in a sugarcane crop grown under irrigated tropical conditions. Aust J Agric Res 45(1): 37-50., 1997) reported k values near to 0.40 for irrigated sugarcane in Australia and Hawaii. Meki et al. (2015)MEKI MN et al. 2015. Two-year growth cycle sugarcane crop parameter attributes and their application in modeling. Agron J 107(4): 1310-1320. found a value of k equal to 0.53 for sugarcane in Hawaii. This is similar to a value obtained by Inman-Bamber et al. (2011)INMAN-BAMBER NG, JACKSON PA and HEWITT M. 2011. Sucrose accumulation in sugarcane stalks does not limit photosynthesis and biomass production. Crop Pasture Sci 62: 848. in a study conducted in Australia with a value of 0.58. It can be highlighted that in both national and international literature, k values were not determined for sugarcane grown in agroforestry systems.
The greatest values of LAI were found in periods of intense vegetative growth (237 to 265 DAC), with values near to 7. In accordance with the results of Inman-Bamber (1994), for the cultivation of sugarcane, the critical value of LAI to intercept 95% of the radiation is near 4, thus average values obtained in this study are above the critical value of LAI.
According to Pinto et al. (2005), the main limiting factor in agroforestry systems is the availability of solar radiation, which together with the competition for water and nutrients limits the growth of sugarcane near the forest species. In new research conducted with agroforestry systems, the effect of a reduction in radiation availability must be considered due to the influence in the growth and development of the species in intercropping systems.
The changes in the microclimatic conditions in different cropping environments resulted in variations of the absolute growth rate and net assimilation rate of plants (Figure 5). The reduction in growth rates is explained by the effect of self-shading due to an increase in the LAI (Figure 4a), as well as in the ripening stage due to leaf senescence as a result of reduced air temperature. In accordance with the results of Cardozo and Sentelhas (2013)CARDOZO NP and SENTELHAS PC. 2013. Climatic effects on sugarcane ripening under the influence of cultivars and crop age. Sci Agric 70(6): 449-456., in the south of Brazil, the lowest air temperature in the months of autumn-winter, combined with the occurrence of moderate water deficit, are the main factors responsible for the reduction of growth rates, except, at the beginning stage of maturation where it results in a high increase in sucrose content.
The reduction in the number of tillers up to DAC 237 is due to the effect of intraspecific competition among plants, especially in the initial stages of growth, i.e., the stage of high tillering. The competition occurs mainly for solar radiation since this is the limiting factor in the agroforestry system. In addition, we recorded low levels of cumulative rainfall in August and September, periods that corresponded to approximately 50 and 80 DAC and the tiller emission stage, which affected the tillering of sugarcane.
The tillering pattern found in this study is similar to that described by Bezuidenhout et al. (2003), but with a lower tiller density than what was reported in that study: peak tillering at 12 to 14 tiller m-2. After the senescence stage, tiller density stabilized at 7 tiller m-2 regardless of water source (rain or irrigation) or planting site. This implies that tillering rate and survival of tillers is related to the quantity and quality of the solar radiation intercepted by plants (Inman-Bamber 1994INMAN-BAMBER NG. 1994. Temperature and seasonal effects on canopy development and light interception of sugarcane. Field Crop Res 36(1): 41-51., Bezuidenhout et al. 2003BEZUIDENHOUT CN, O’LEARY GJ, SINGELS A and BAJIC VB. 2003. A process-based model to simulate changes in tiller density and light interception of sugarcane crops. Agric Syst 76(2): 589-599.).
Regarding the partitioning of assimilates, the biomass accumulated in the leaves decreased gradually throughout the crop cycle, especially in the maturation stage due to the senescence of lower leaves. Another important aspect to be emphasized is the exportation of sucrose and starch from leaves to other compartments. In our study, the total dry matter in the stalk in the sugarcane plants resulted in an average accumulation of 75% (Figure 7).
The metabolism and partitioning of sucrose are essential for all stages of the sugarcane crop cycle and requires hydrolysis to use it as a source of energy (Leite et al. 2009LEITE GHP, CRUSCIOL CAC, LIMA GPP and SILVA MDA. 2009. Reguladores vegetais e atividade de invertases em cana-de-açúcar em meio de safra. Cienc Rural 45(10): 718-725.). In leaves (the source), the synthesis of carbohydrates is realized, which is translocated to the stalks (sink) in the form of sucrose, in order to meet plant maintenance and growth metabolism demands (Taiz and Zeiger 2013TAIZ L and ZEIGER E. 2013. Plant Physiology. 5th ed., Porto Alegre: Artmed, p. 918.). These processes are accompanied by constant changes in source-sink relations (Roitsch and González 2004ROITSCH T and GONZÁLEZ MC. 2004. Function and regulation of plant invertases: sweet sensations. Trends Plant Sci 9(12): 606-613.), which was confirmed in this study through the partitioning of dry matter by the sugarcane (Figure 7).
The observed results are similar to those of Marin et al. (2011)MARIN FR, JONES JW, ROYCE F, SUGUITANI C, DONZELI JL and NASSIF DS. 2011. Parameterization and evaluation of predictions of DSSAT/CANEGRO for Brazilian sugarcane. Agron J 103(2): 304-315., who, evaluating the partition of biomass throughout the sugarcane cycle, found higher initial biomass accumulated in the leaves and in stalks starting from 129 DAP. This is equivalent to 9% of TDM with increasing values, reaching 70% at 330 DAP. In a study conducted in southern Brazil, Simões et al. (2005)SIMÕES MS, ROCHA JV and LAMPARELLI RAC. 2005. Growth indices and productivity in sugarcane. Sci Agric 62(1): 23-30. found ratios of around 80% of dry matter accumulated in stalks at 400 DAP. Muchow et al. (1994) found the stalk biomass values change from 60% to 80% for DAP 300 to 450 DAP, in Australia.
The greatest stalk yield and juice volume observed for the monocropping system is explained by the favorable meteorological conditions during the crop cycle (Figure 2). The average stalk yield of 61.8 t ha-1 is consistent with the values found in the literature. In the study conducted by Liu et al. (2016)LIU J et al. 2016. Growth and yield of sugarcane genotypes are strongly correlated across irrigated and rainfed environments. Field Crop Res 196: 418-425., who evaluated the yield of sugarcane in China, observed an average yield of 56.1 and 79.9 t ha-1 for Kaiyuan and Yuanjiang, respectively. Abreu et al. (2013)ABREU ML, ALMEIDA SM, TEODORO I, HOLANDA LA and NETO GDS. 2013. Crescimento e produtividade de cana-de-açúcar em função da disponibilidade hídrica dos Tabuleiros Costeiros de Alagoas. Bragantia 72(3): 262-270., studying five cultivars of sugarcane, found the following average yields: 89 t ha-1 in the first year of cultivation, 75 t ha-1 in the second year and 88 t ha-1 in the third year of cultivation in the state of Alagoas, Brazil.
The sugarcane yield is reduced in agroforestry systems. This reduction in stalk weight and juice volume may be related to the morphophysiological adjustments, for example as a shade tolerance strategy. These adaptations were not able to compensate for the reduction of radiation in the understory of Aleurites fordii, which reduced overall yields. However, even under the influence of tree species, the 12 x 12 system showed satisfactory values with relation to the stalk weight (50.9 t ha-1) and produced juice volume (26.8 m3 h-1). This value is near the average stalk yield for the state of Rio Grande do Sul of 53.9 t ha-1 (Conab 2017). This result confirms the viability of the intercropping system for the production of sugarcane. Pinto et al. (2005), evaluating the yield of sugarcane in agroforestry systems with Eucalyptus grandis, found differences in sugarcane yields in different evaluation spacings. Plants spaced 11.6 m from the tree species obtained average yields of 64.1 t ha-1 in the state of São Paulo, Brazil.
The satisfactory yield values in the 12 x 12 system are related to the greater availability of radiation within the system, which enabled a greater plant growth, confirmed by the elevated TDM and LAI (Figure 4). In addition, the Aleurites fordii (deciduous species), displays leaf senescence in the colder seasons (winter-autumn). Senescence can increase the radiation intercepted by sugarcane, especially in the final stage of maturation, resulting in an increase of the stalk weight and produced juice (Figure 8). This result highlights the importance of appropriate selection of tree species used in the composition of the agroforestry system.
These results are consistent with those obtained by Elli et al. (2016), who, evaluating the yield of sugarcane in different agroforestry systems, found higher stalk yields for intercropping with the species Parapiptadenia rígida, where the values of 61.9, 53.1, and 41.6 t ha-1 were obtained in three cultivation cycles. The greater yields observed by the authors is related to the characteristics of their forest species. Above all, because they enable greater radiation availability in the understory, an important characteristic of deciduous species.
The study of the growth variables, yield traits, and dynamics of solar radiation in agroforestry systems are underfunded. Thus, the information generated in this study is relevant, as it provides information to farmers for the planning of more effective agroforestry arrangements. It also confirms the viability of the cultivation of sugarcane in agroforestry systems. Additionally, Brazilian law No. 12,651, May 25, 2012, which established a new Forest Code, allows small farmers to plant agroforestry systems in areas of permanent preservation (APP) and legal reserves (RL), provided that those systems are subject to a sustainable management plan.
CONCLUSIONS
The cultivation of sugarcane in agroforestry system did not present higher yields and radiation use efficiency, thus, the hypothesis of the study was rejected. However, even under the influence of the species Aleurites fordii, the cultivation of sugarcane in agroforestry systems showed satisfactory values of yield and radiation use efficiency and can be recommended for cultivation in alternative production systems. The use of agroforestry systems with 12 x 12m arrangements should be prioritized because this enabled greater yields and radiation availability in the understory.
This study sought to provide new sustainable alternatives for farmers, in order to increase the diversification of rural properties and preserve existing agro-ecosystems. It is important that research is conducted in order to study the implementation of agroforestry systems in threatened ecosystems, such as in permanent preservation areas (APP’s) and legal reserve (RL’s). It is necessary to study the responses of these areas in with regard to environmental preservation, the maintenance of biodiversity, and economic return of agroforestry systems, and to do so while adapting to modern environmental legislation.
ACKNOWLEGMENTS
The authors wish to acknowledge the Conselho Nacional de Desenvolvimento Científico e Tecnológico (CNPq-Brazil) and the Coordenação de Aperfeiçoamento de Pessoal de Nível Superior (CAPES-Brazil) for their financial support.
REFERENCES
- ABREU ML, ALMEIDA SM, TEODORO I, HOLANDA LA and NETO GDS. 2013. Crescimento e produtividade de cana-de-açúcar em função da disponibilidade hídrica dos Tabuleiros Costeiros de Alagoas. Bragantia 72(3): 262-270.
- ALTIERI MA. 2009. Agroecology, small farms, and food sovereignty. Monthly Review 61(3): 102-113.
- ALVARES CA, STAPE JL, SENTELHAS PC, MORAES G, LEONARDO J and SPAROVEK G. 2013. Köppen’s climate classification map for Brazil. Meteorol Z 22: 711-728.
- ANDERSON RG, TIRADO-CORBALÁ R, WANG D and AYARS JE. 2015. Long-rotation sugarcane in Hawaii sustains high carbon accumulation and radiation use efficiency in 2nd year of growth. Agric Ecosyst Environ 199: 216-224.
- ASSIS FN and MENDEZ MEG. 1989. Relação entre radiação fotossinteticamente ativa e radiação global. Pesq Agropec Bras 24(7): 797-800.
- BEHLING A, SANQUETTA DR, DALLA CORTE AP, NETTO SP, RODRIGUES AL, CARON BO and SIMON AA. 2016. Tracking leaf area index and coefficient of light extinction over the harvesting cycle of black wattle. J For Res 27(6): 1211-1217.
- BEZUIDENHOUT CN, O’LEARY GJ, SINGELS A and BAJIC VB. 2003. A process-based model to simulate changes in tiller density and light interception of sugarcane crops. Agric Syst 76(2): 589-599.
- BOSI C, PEZZOPANE JRM, SENTELHAS PC, SANTOS PM and NICODEMO MLF. 2014. Produtividade e características biométricas do capim-braquiária em sistema silvipastoril. Pesq Agropec Bras 49(6): 449-456.
- BROOKER RW et al. 2014. Improving intercropping: a synthesis of research in agronomy, plant physiology and ecology. New Phytol 206: 107-117.
- CAMPBELL GS and NORMAN JM. 1998. The light environment of plant canopies. In: An Introduction to Environmental Biophysics. Springer New York, p. 247-278.
- CARDOZO NP and SENTELHAS PC. 2013. Climatic effects on sugarcane ripening under the influence of cultivars and crop age. Sci Agric 70(6): 449-456.
- CHAPPELL MJ et al. 2013. Food sovereignty: an alternative paradigma for poverty reduction and biodiversity conservation in Latin America. F1000 Research 2: 235-253.
- CONAB - COMPANHIA NACIONAL DE ABASTECIMENTO. 2017. Acompanhamento da Safra Brasileira de Cana-De-Açúcar. Disponível em: http://www.conab.gov.br/OlalaCMS/uploads/arquivos/16_08_18_12_03_30_boletim_cana_portugues_-_2o_lev_-_16-17.pdf. Acesso em 14 de junho de 2016.
» http://www.conab.gov.br/OlalaCMS/uploads/arquivos/16_08_18_12_03_30_boletim_cana_portugues_-_2o_lev_-_16-17.pdf. - CONG WF, HOFFLAND E, LI L, SIX J, SUN JH, BAO XG, ZHANG FS and VAN DER WERF W. 2014. Intercropping enhances soil carbon and nitrogen. Glob Chang Biol 21: 1715-1726.
- DE SILVA ALC and DE COSTA WAJM. 2012. Growth and radiation use efficiency of sugarcane under irrigated and rain-fed conditions in Sri Lanka. Sugar Tech 14(3): 247-254.
- DINÇ E, CEPPI MG, TÓTH SZ, BOTTKA S and SCHANSKER G. 2012. The chl a fluorescenceintensity is remarkably insensitive to changes in the chlorophyll content of the leaf as long as the chl a/b ratio remains unaffected. Biochim Biophys Acta 1817(5): 770-779.
- ELLI EF, CARON BO, ELOY E, BEHLING A, SOUZA VQ and SCHWERZ F. 2016. Productive, morphological and qualitative characteristics of sugarcane in the understory tree species in agroforestry systems. Afr J Agric Res 11(17): 1576-1584.
- FAO - FOOD and AGRICULTURAL ORGANIZATION. 2013. Water, Natural Resources Management and Environment Department. Available at: http://www.fao.org/nr/water/index.html. Accessed on June 29, 2016.
» http://www.fao.org/nr/water/index.html. - FLOOD PJ, HARBINSON J and AARTS MGM. 2011. Natural genetic variation in plant photosynthesis. Trends Plant Sci 16(6): 327-335.
- GODFRAY HCJ et al. 2010. Food security: the challenge of feeding 9 billion people. Science 327(5967): 812-818.
- HARDY JP, MELLOH R, KOENIG G, MARKS D, WINSTRAL A, POMEROY JW and LINK T. 2004. Solar radiation transmission through conifer canopies. Agr Forest Meteorol 126: 257-270.
- INMAN-BAMBER NG. 1994. Temperature and seasonal effects on canopy development and light interception of sugarcane. Field Crop Res 36(1): 41-51.
- INMAN-BAMBER NG, JACKSON PA and HEWITT M. 2011. Sucrose accumulation in sugarcane stalks does not limit photosynthesis and biomass production. Crop Pasture Sci 62: 848.
- LEITE GHP, CRUSCIOL CAC, LIMA GPP and SILVA MDA. 2009. Reguladores vegetais e atividade de invertases em cana-de-açúcar em meio de safra. Cienc Rural 45(10): 718-725.
- LI L, ZHANG L and ZHANG F. 2013. Crop mixtures and the mechanisms of overyielding. In: Encyclopedia of Biodiversity. Waltham, MA, USA: Academic Press, p. 382-395.
- LIU J et al. 2016. Growth and yield of sugarcane genotypes are strongly correlated across irrigated and rainfed environments. Field Crop Res 196: 418-425.
- MAKUMBA W, JANSSEN B, OENEMA O, AKINNIFESI FK, MWETA D and KWESIGA F. 2006. The long-term effects of a gliricidia–maize intercropping system in southern Malawi, on gliricidia and maize yields, and soil properties. Agric Ecosyst Environ 116: 85-92.
- MARAFON AC. 2012. Análise quantitativa de crescimento em cana-de-açúcar: uma introdução ao procedimento prático. Documentos - Embrapa Tabuleiros Costeiros, p. 29.
- MARCHIORI PE, MACHADO EC and RIBEIRO RV. 2014. Photosynthetic limitations imposed by self-shading in field-grown sugarcane varieties. Field Crop Res 155: 30-37.
- MARIN FR, JONES JW, ROYCE F, SUGUITANI C, DONZELI JL and NASSIF DS. 2011. Parameterization and evaluation of predictions of DSSAT/CANEGRO for Brazilian sugarcane. Agron J 103(2): 304-315.
- MEKI MN et al. 2015. Two-year growth cycle sugarcane crop parameter attributes and their application in modeling. Agron J 107(4): 1310-1320.
- MENDES MMS. 2013. Desenvolvimento do milho sob influência de árvores de pau branco em sistema agrossilvipastoril. Pesq Agropec Bras 48(10): 1342-1350.
- MONTEITH JL. 1977. Climate and the efficiency of crop production en Britain. Philos T Roy Soc B 181: 277-294.
- MUCHOW RC, EVENSEN CI, OSGOOD RV and ROBERTSON MJ. 1997. Yield accumulation in irrigated sugarcane: Utilization of intercepted radiation. Agron J 89(4): 646-652.
- MUCHOW RC, SPILLMAN MF, WOOD AW and THOMAS MR. 1994. Radiation interception and biomass accumulation in a sugarcane crop grown under irrigated tropical conditions. Aust J Agric Res 45(1): 37-50.
- MULLER MD, PACIULLO DSC, MARTINS CE, ROCHA WSD and CASTRO CRT. 2014. Desenvolvimento vegetativo de pinhão manso em diferentes arranjos de plantio em sistemas agrossilvipastoris. Pesq Agropec Bras 49(7): 506-514.
- PACIULLO DSC, GOMIDE CAM, CASTRO CD, FERNANDES PB, MÜLLER MD, PIRES MFA, FERNANDES EM and XAVIER DF. 2011. Características produtivas e nutricionais do pasto em sistema agrossilvipastoril, conforme a distância das árvores. Pesq Agropec Bras 46(10): 1173-1186.
- PEARCY RW. 1998. Acclimation to sun and shade. In: Raghavendra AS (Ed), Photosynthesis: A Comprehensive Treatise. Cambridge University Press, Cambridge, p. 250-263.
- PÉLLICO NETTO S, SANQUETTA CR, CARON BO, BEHLING A, SIMON AA, CORTE APD and BAMBERG R. 2015. Ground level photosynthetically active radiation dynamics in stands of Acacia mearnsii De Wild. An Acad Bras Cienc 87: 1833-1845.
- PEZZOPANE JRM, BOSI C, NICODEMO MLF, SANTOS PM, CRUZ PGD and PARMEJIANI RS. 2015. Microclimate and soil moisture in a silvopastoral system in southeastern Brazil. Bragantia 74(1): 110-119.
- PINTO LFG, BERNARDES MS, STAPE JL and PEREIRA AR. 2005. Growth, yield and system performance simulation of a sugarcane–eucalyptus interface in a sub-tropical region of Brazil. Agric Ecosyst Environ 105(1): 77-86.
- ROBERTSON MJ, WOOD AW and MUCHOW RC. 1996. Growth of sugarcane under high input conditions in tropical Australia. Radiation use, biomass accumulation and partitioning. Field Crop Res 48(1): 11-25.
- ROITSCH T and GONZÁLEZ MC. 2004. Function and regulation of plant invertases: sweet sensations. Trends Plant Sci 9(12): 606-613.
- SALTON JC, MERCANTE FM, TOMAZI M, ZANATTA JA, CONCENÇO G, SILVA WM and RETOREA M. 2013. Integrated crop livestock system in tropical Brazil: toward a sustainable production system. Agric Ecosyst Environ 190: 70-79.
- SAS. 2003. Getting started with the SAS Learning Edition. Cary, 200 p.
- SCFC - SOIL CHEMISTRY and FERTILITY COMMITTEE. 2004. Manual de adubação e calagem para os estados do Rio Grande do Sul e Santa Catarina. Porto Alegre: Sociedade Brasileira de Ciência do Solo – Núcleo Regional Sul, p. 400.
- SIMÕES MS, ROCHA JV and LAMPARELLI RAC. 2005. Growth indices and productivity in sugarcane. Sci Agric 62(1): 23-30.
- TAIZ L and ZEIGER E. 2013. Plant Physiology. 5th ed., Porto Alegre: Artmed, p. 918.
- THORNLEY JMH. 1976. Mathematical models in plant physiology. Academic Press, London, p. 318.
- TRACY BF and ZHANG Y. 2008. Soil compaction, corn yield response, and soil nutrient pool dynamics within an integrated crop-livestock system in Illinois. Crop Sci 48(3): 1211-1218.
- VANDERMEER JH. 1989. The Ecology of Intercropping. Cambridge, UK: Cambridge University Press, p. 241.
- VANDERMEER JH. 2011. The Ecology of Agroecosystems. Boston, MA, USA: Jones and Bartlett Publishers, p. 387.
- VAN HEERDEN PDR, DONALDSON RA, WATT DA and SINGELS A. 2010. Biomass accumulation in sugarcane: unravelling the factors underpinning reduced growth phenomena. J Exp Bot 61(11): 2877-2887.
- VARLET-GRANCHER CG, GOSSE M, CHARTIER H, SINOQUET R, BONHOMME R and ALLIRAND JM. 1989. Mise au point: rayonnement solaire absorbé ou intercepté par un couvert végétal. Agronomie 9(5): 419-439.
- ZHANG L, VAN DER WERF W, ZHANG S, LI B and SPIERTZ JHJ. 2007. Growth, yield and quality of wheat and cotton in relay strip intercropping systems. Field Crop Res 103: 178-188.
- ZHU XG, LONG SP and ORT DR. 2010. Improving photosynthetic efficiency for greateryield. Annu Rev Plant Biol 61: 235-261.
Publication Dates
-
Publication in this collection
Oct-Dec 2018
History
-
Received
25 Nov 2016 -
Accepted
6 Nov 2017