Abstract
This study aimed to elaborate a sequential sampling plan for Anastrepha species in commercial orchards of guava Psidium guajava Novo Milênio cultivar. Samplings were carried out in three orchards in the State of Mato Grosso do Sul. Fruit flies were sampled for 23 weeks. Data were subjected to the sequential probability ratio test. We adopted the mean of 0.3 Anastrepha individuals for the safety level and 0.7 for the control level and the observed frequency was adjusted to the negative binomial expected frequency (Bn) for the equation of the line. The condition of adopting a control method recommended by S1 = 6.5554 + 0.5362n was observed in the upper line. In turn, the lower line, which does not require the use of a control method, is defined by So = -2.8229 + 0.5362n. The sequential sampling plan predicted the expected maximum number of 37 sampling units to decide whether or not to use control method(s). This sequential plan was defined with mean number of 0.54 adults for each McPhail trap unit (sample). The sequential plan generated is unprecedented and will contribute to the rapid and safe decision making in the control of Anastrepha species of economic importance in guava farming.
Key words
Fruit farming; decision making; population monitoring; integrated pest management
INTRODUCTION
Fruit production in the world has 90% of its consumption in the producing countries, ensuring high potential for the economic development of each region. In Brazil, the Gross Domestic Product (GDP) reaches two billion reais. Among the tropical fruit, guava is genuinely South American and appreciated on all continents. In 2012, the internal production of this fruit reached 0.2% of the total Brazilian agricultural production. The marketing of this fruit in the country reached R$ 331.877 million; in the Central West region, it was R$ 29.992 million and in the State of Mato Grosso do Sul (MS), it was R$ 1.459 million. Production in MS is concentrated in the municipalities of Itaporã, producing R$ 612 thousand in 18 hectares (ha), Ivinhema with R$ 780 thousand in 30 ha and Novo Horizonte do Sul with R$ 67 thousand in six ha (IBGE 2014IBGE - INSTITUTO BRASILEIRO DE GEOGRAFIA E ESTATÍSTICA. 2014. Produção Agrícola Municipal: Culturas temporárias e permanentes. 41: 1-100.).
Farming guava in MS is predominantly for domestic consumption. However, there is industry of sweet, jelly and pulp in Itaporã and the guava production contributes to the creation of jobs and income for family agriculture. The incentive for guava farming can qualify manpower and fix man in the field (Petinari et al. 2008PETINARI RA, TERESO MJA AND BERGAMASCO S. 2008. A importância da fruticultura para os agricultores familiares da região de Jales-SP. Rev Bras Frutic 30: 356-360.). There is a need for proper monitoring and management of fruit flies for the production of guava. Therefore, it is very important to keep up-to-date information about the fruit fly populations of the genus Anastrepha, one of the main groups of pests in the fruit- and horticulture of the Neotropical Region. In this way, the use of monitoring technique and population suppression of these insects is important to minimize the injuries to the fruits. Signs of egg laying left on the surface of fruit make them unfeasible for the market, besides inducing the farmer to increase the use of inputs, mainly insecticides, increasing production costs and contributing to environmental pollution.
In Brazil, there are several Anastrepha species occurring in guava fruit and other commercial and native fruit in all regions (Nicácio et al. 2011NICÁCIO JN, UCHOA MA, FACENDA O, GUIMARÃES JA AND MARINHO CF. 2011. Native larval parasitoids (Hymenoptera) of frugivorous Tephritoidea (Diptera) in South Pantanal Region, Brazil. Fla Entomol 94: 407-419., Uchoa 2012UCHOA MA. 2012. Fruit Flies (Diptera: Tephritoidea): Biology, host plants, natural enemies, and the implications to their natural control. In: Larramendy ML and Soloneskii eS (Eds), Integrated pest management and pest control: current and future tactics. Croatia: Intech, 668 p.). The monitoring method currently used as a parameter to evaluate the population levels of fruit flies in orchards is the MAD index (number of fruit flies per trap per day), proposed by Salas and Chavez (1981)SALAS JAS AND CHAVEZ JEP. 1981. Fluctuación poblacional de la mosca mexicana de la fruta Anastrepha ludens (Loew), en General Terán y Montemorelos, Nuevo León. Agric Tec Méx 7: 65-75.. According to Nascimento et al. (2000)NASCIMENTO AS, CARVALHO RS AND MALAVAS A. 2000. Monitoramento populacional. In: Malavas A and Zucchi RA (Eds), Moscas-das-frutas de importância econômica no Brasil: conhecimento básico e aplicado. Ribeirão Preto: Holos, 200 p., this index has been used to evaluate the level of infestation and to guide the decision making in effective control of fruit fly species. In practice, it is recommended to use a McPhail trap per hectare when the orchard occupies over ten hectares. Traps should be supplied with attractive food or pheromone. Control actions should start when the MAD index reaches the recommended threshold of 0.5.
Sequential sampling was more efficient and faster to assess the damage potential by means of frequency distributions of fruit flies compared to the conventional sampling, which requires a fixed and longer pattern of sampling effort (Barbosa 1992BARBOSA JC. 1992. A amostragem sequencial. In: Fernandes OA, Correia ACB and de Bortoli SA (Eds), Manejo integrado de pragas e nematoides. Jaboticabal, FUNEP, p. 205-211.). Monitoring with a continuous assessment of the presence of Anastrepha species will aid in the control of this pest group. This is the first step in any integrated pest management program, since it allows to observe the initial moment of infestation of fruit fly in the orchard, identification of the predominant species and their population densities. The cost of monitoring fruit fly in orchards can be estimated in reais per hectare month-1, and conversely, the loss in production caused by these flies.
In this context, aiming to provide subsidies for the population monitoring of fruit fly species of the genus Anastrepha in fruit orchards, the goals of this study were: to elaborate a sequential sampling plan for fruit fly of the genus Anastrepha in commercial orchards of guava.
MATERIALS AND METHODS
CHARACTERIZATION OF SAMPLING AREAS
The sampling area is located in the municipality of Ivinhema (22°18’18”S/053°49’08”W), at an altitude of 367 m, southern State of Mato Grosso do Sul. The climate is semi-humid tropical, but some areas are characterized as high-altitude tropical, with dry winter and rainy summer. Due to the longitudinal position of South America, the atmospheric dynamics of this region is linked to the action of the intertropical and extrapositive action centers with their negative and subtropical high pressure, represented by the Amazon depression and Chaco (Peel et al. 2007PEEL MC, FINLAYSON BL and MCMAHON TA. 2007. Updated world map of the Köppen-Geiger climate classification. Hydrol Earth Syst Sci 11: 1633-1644.). The regional climate is classified as Cwa (humid mesothermal climate, warm rainy summers and dry winters), with the lowest temperatures (below 18 °C) occurring in June and July and the hottest month is January (above 22 °C) (Peel et al. 2007PEEL MC, FINLAYSON BL and MCMAHON TA. 2007. Updated world map of the Köppen-Geiger climate classification. Hydrol Earth Syst Sci 11: 1633-1644.).
Samplings were conducted in ‘Novo Milênio’ guava cultivar in three different orchards: at the Santa Luzia Farm, with four years of age (22°17’10”S/053°56’46”W), 420 m altitude; at the São José Farm, site 1, with six years of age (22°16’18”S/053°54’58”W), 397 m altitude, and at the São José Farm, with three years of age (22º15’59”S and 53º54’01”W) and 409 m altitude.
MONITORING
Species of Anastrepha were sampled with McPhail traps installed at about 1.80 m from the ground level in commercial guava orchards (Novo Milênio cultivar). In the three areas, the samplings occurred from August 2013 to January 2014, corresponding a sampling period of 23 weeks.
Thirty traps were installed in the guava trees of each orchard. The distribution was systematized, crosswise and longitudinally, after the area was gridded from one to 12 (number of plants in the rows) and repeated 30 times per plant. The odd streets were used. Each trap was baited with hydrolyzed corn protein (5%), replaced each week. The species of fruit flies caught were preserved in 92.8% alcohol and identified by Manoel A. Uchoa-LabTaxon-UFGD.
DATA ANALYSIS
The mean number of fruit flies above the threshold of 20 individuals, which adhered to the Negative Binomial (Bn) adjustment, was used to describe the spatial dispersion of populations of Anastrepha species. It was also used to define the decision-making lines, which make up the field sampling worksheet, using the equations as in Fernandes et al. (2003)FERNANDES MG, BUSOLI AC AND BARBOSA JC. 2003. Amostragem sequencial de Alabama argillacea (Hübner) (Lepidoptera: Noctuidae) em algodoeiro. Neot Entomol 32: 117-122..
The mean numbers of fruit flies of 0.4 and 0.7 were used for the safety and control level, respectively, with α = 0.02 and β = 0.20. Then, the field worksheet for the sequential sampling plan of the Anastrepha species was prepared using the Sequential Probability Ratio Test (SPRT) proposed by Wald (1947)WALD A. 1947. Sequential analysis. New York: J Wiley & Sons, Inc., 212 p..
The Sequential Probability Ratio Test is based on the Operating Characteristic Curve {CO(p)} and the Curve of Expected Size of Sampling Units Ep(n) for any type of spatial distribution. To test the hypotheses H0: μ0 = 0.4 and H1: μ1 = 0.7 with the smallest possible number of sampling units. The reliability of adopting a right or wrong decision was represented by the probability indicated in CO (p), which provides a perspective of ending sampling and not suggesting control for a level of infestation by Anastrepha species in guava farms. In turn, Ep (n) represents the mean number of observations required for the decision-making to carry out the population control of fruit fly or not. In both curves, were used the functions proposed by Young and Young (1998)YOUNG LJ AND YOUNG JH. 1998. Statistical ecology: a population perspective. Boston: Kluwer Academic Publishers, 565 p..
The worksheet for sequential sampling in the field, derived from the frequency distribution data, was compared to the number of fruit flies per trap per day (MAD). It was tested in three other sites and compared to the results of the original experiment conducted in the municipality of Ivinhema, State of Mato Grosso do Sul, in areas with guava farms (22°18’17”S / 053°48’55”W, 393 m altitude).
The three evaluated orchards presented different sample sizes, and in these, population control of fruit fly was not used until the beginning of the samplings. The first control was in Chácara Dourados, an orchard with four intercrops of different fruit species: consortium 1 - Psidium guajava (guava), Mangifera indica (mango), Bactris gasipaes (pupunha) and Persea americana (avocado); consortium 2 - Citrus sinensis (orange) and Híbrido Citrus reticulata x Citrus deliciosa (ponkan); consortium 3- Mangifera indica (mango), Citrus sinensis (orange) and Citrus aurantium (bergamot) and consortium 4 - Híbrido Citrus sinensis x Citrus reticulata (murcote), Citrus reticulata (tangerine) and Híbrido Citrus reticulata x Citrus deliciosa (ponkan). All with predominance of the Híbrido Citrus latifolia (lemon taiti) crop (22º15’59” and 54º48’25”W), 385 m altitude. In this site, there was also an intercropping orchard, with four species of fruit trees: lemon taiti, guava, mango, avocado and pupunha (Bactris gasipaes).
In Estância Janzenski, Santa Terezinha settlement, municipality of Itaporã, State of Mato Grosso do Sul, two other areas were also evaluated exclusively with ‘Novo Milênio’ guava cultivar. The second control was an area close to a pig farm (Latitude - 21°54’22,43”S/Longitude - 54°41’57,18”W and 314 m altitude). The third control was an area surrounded by a watercourse surrounded by native forest: Latitude - 21°54’22,55” S/Longitude - 54°42’32,04”W and 306 m altitude. The distances from Ivinhema, State of Mato Grosso do Sul, to Dourados, State of Mato Grosso do Sul, is 122 km and from Dourados to the Santa Terezinha settlement in Itaporã, State of Mato Grosso do Sul, is 47 km.
The present field worksheet was prepared considering the experimental procedures described above and was validated in three other orchards with guava. The data on the number of fruit flies collected with McPhail traps, which represent the sampling units and the records in the worksheet of these samples were analyzed by the MAD and negative binomial models and compared with the controls described.
RESULTS
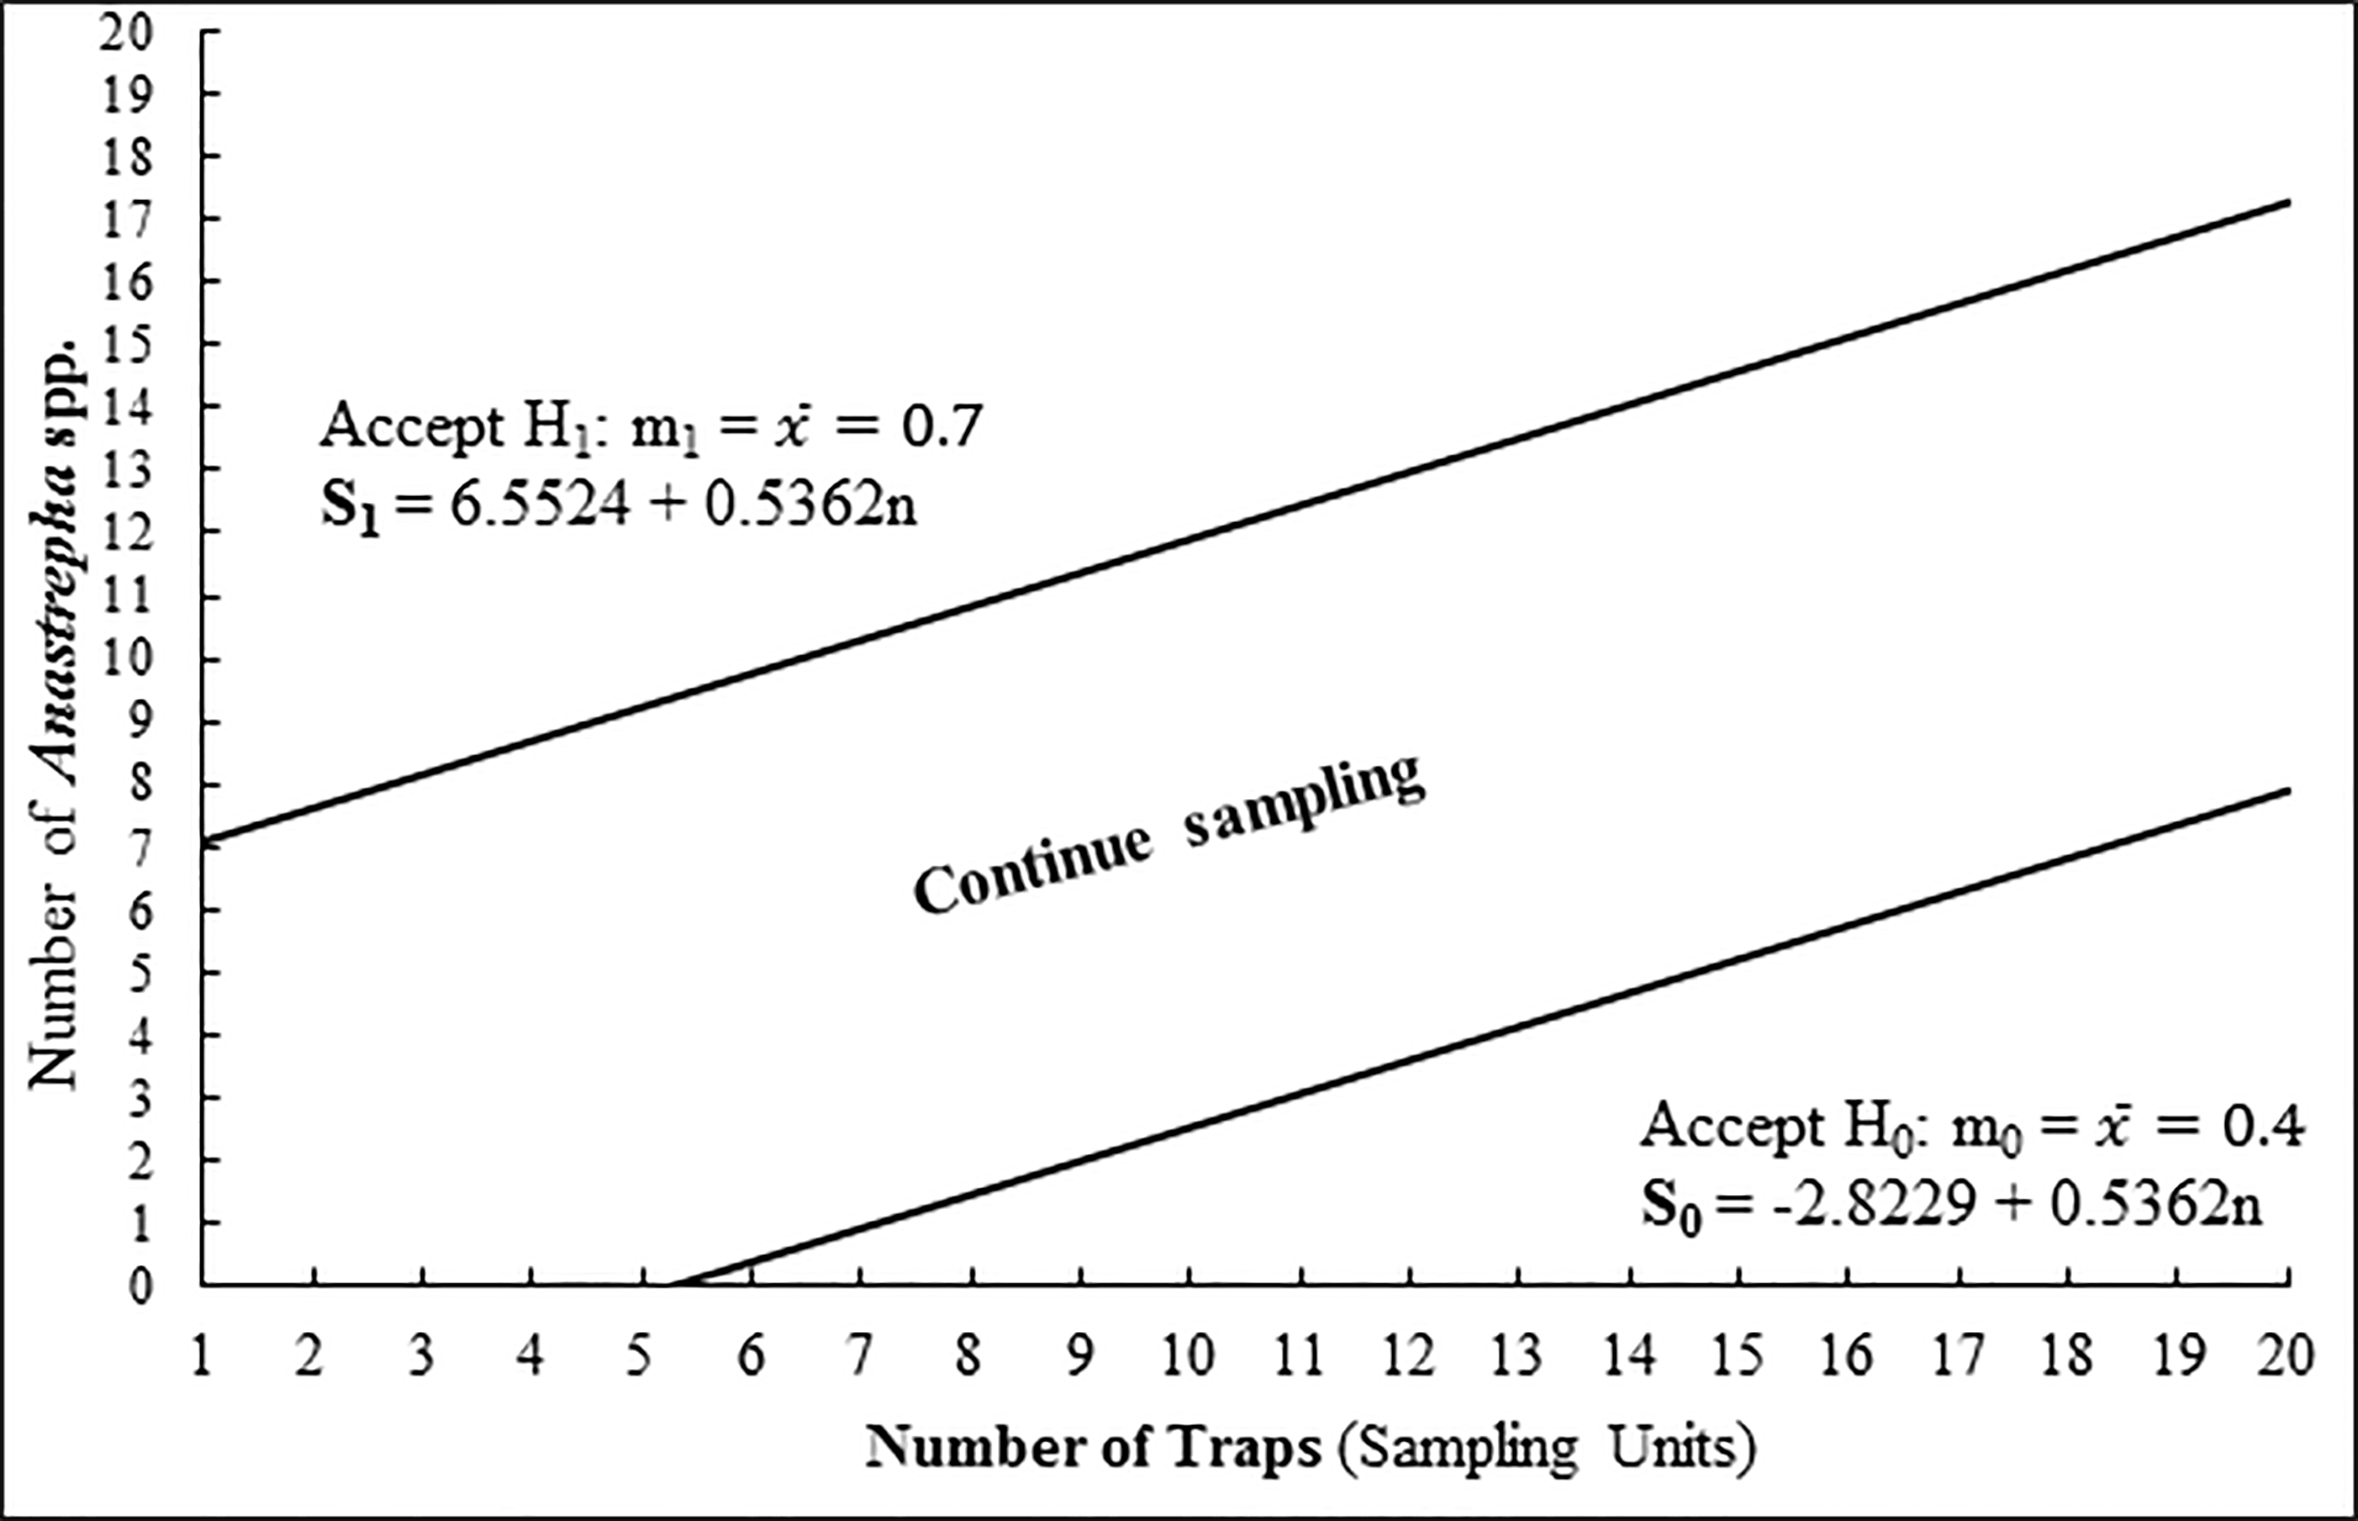
From the data provided by the equations of the lines, upper (H1 Hypothesis) and lower (H0 Hypothesis), the sequential sampling plan for the decision making on population control action of Anastrepha species in guava orchards was designed.
The line for the action level was set at S1 = 6.5524 + 0.5362n and for the safety level at S0 = -2.8229 + 0.5362n. The safety level in this plan was defined from the 8th sampling unit (repetition) with the cumulative number of an adult of Anastrepha spp. in the sample with McPhail traps and, in the 1st sampling unit, the action level is already established with six adults of Anastrepha spp., according to Figure 1 and Table I. At least, three McPhail traps initially randomly distributed in the area of one hectare and two traps up to 10 hectares. In the case of an orchard with an area of more than 10 hectares, the number may have a random distribution of one trap per hectare or more, based on the field worksheet (Table I).

Decision lines of the sequential sampling plan for the number of Anastrepha spp. defined by thetheoretical Negative Binomial distribution (Bn) in three orchards of ‘Novo Milênio’ guava cultivar, Ivinhema, State of Mato Grosso do Sul, Brazil (August 2013 to January 2014). Sequential Probability Ratio Test.
Field worksheet for sequential sampling, aiming to evaluate the infestation by fruit fly species of the genus Anastrepha in three orchards of ‘Novo Milênio’ guava cultivar for 23 weeks in three sites in the municipality of Ivinhema, State of Mato Grosso do Sul, Brazil (August 2013 to January 2014).
The Operating Characteristic Curve CO (p) (Figure 2) indicates the value of 0.4 Anastrepha spp. on average per sample for a 1% probability error for accepting H0, that is, of not recommending the control when it is necessary. From the mean of an adult of Anastrepha spp., this probability of error becomes zero. The CO (p) curve showed a marked slope, which indicates a high power of distinguishing between these two competitive hypotheses.

Operating Characteristic Curve CO (p) of the Sequential Probability Ratio Test for populations of fruit fly species of the genus Anastrepha in ‘Novo Milênio’ guava cultivar for 23 weeks in three orchards in the region of Ivinhema, State of Mato do Sul, Brazil (August 2013 to January 2014).
The expected numbers of sampling units Ep(n) of the Sequential Probability Ratio Test for the total population of Anastrepha species suggest that an average of 0.59 adults per sample will lead to the use of the maximum number of 36 sampling units (traps), resulting in the maximum sample size in that plan. For the mean of one adult of Anastrepha spp. per sample, approximately 13 traps (sampling units) will be used. With the mean of two adults per sample, the maximum sample size will be reached with approximately four traps (Figure 3). All samples adhered to the negative binomial (Bn), with the control level beginning, at the maximum, from the third sampling unit (UA) and (Figure 1).

Curve of Expected Size of Sampling Units Ep(n) of the Sequential Probability Ratio Test for populations of fruit fly species of the genus Anastrepha in ‘Novo Milênio’ guava cultivar for 23 weeks in three orchards in the region of Ivinhema, State of Mato Grosso do Sul, Brazil (August 2013 to January 2014).
DISCUSSION
The sequential sampling plan for population monitoring of Anastrepha species is provided by the equations of the upper (H1 Hypothesis) and lower (H0 Hypothesis) lines and is intended for use in the Integrated Pest Management Program (IPM) in guava. It is intended for monitoring for decision-making on control actions for fruit fly species of the genus Anastrepha. As this model of spatial distribution fits to the theoretical pattern of the negative binomial (Bn) distribution, it reflects the dynamics of the population patterns of Anastrepha species in guava orchards (Figure 1).
The sampling worksheet based on the upper decision lines (indicating the need for control measures), and lower decision lines (which indicate no need for control), facilitates and optimizes field sampling to evaluate the incidence of fruit fly. It is recommended to use and interpret the worksheet for the sequential sampling of fruit fly, as follows: 1. Expose the McPhail model traps for seven days in the guava trees; 2. Collect and count individuals of Anastrepha spp. caught in the first trap; 3. Record the number of individuals of Anastrepha spp. of the first trap and register it in the line corresponding to the first collection (Table I); 4. The second trap evaluated will have in its respective line the record of its captured individuals, added with the result of the number of adults of Anastrepha spp. of the previous trap; 5. Repeat the same procedure for the other traps in succession until a maximum of 36 traps, as recommended in this sampling plan (Table I).
The identification of the captured Anastrepha genus (fruit fly) with the number of individuals counted will be recorded cumulatively in the field worksheet, in the said sampling units (traps) from the first and so on. This action is repeated until the values are equal to or greater than those in the upper limit column or those in the lower column, referring to the last quantified sampling unit (trap). Therefore, if the total number of fruit flies counted equals or exceeds the control action level (upper limit), it is recommended to suppress the population of fruit flies. Otherwise, when values do not exceed this upper limit, but are within the range of the two decision lines, it is recommended to continue sampling the population. When the values of this sampling procedure are below the bottom line, sampling can be stopped without the need for action for population suppression (Table I). However, it is recommended to keep at least one trap installed in the orchard for monitoring.
The method proposed here will allow the standardization of a sequential sampling plan, according to the number of fruit flies caught in the orchard for adequate decision making, within any of the levels evaluated: safety level or control level (Figure 1, Table I).
The reliability of this sampling plan, tested by the operating characteristic curve CO (p) (Figure 2), indicates that when obtaining the mean of 0.4 adults of Anastrepha spp. in the population per sample, there will be a 1% probability of making wrong decisions for population control (indicated by the upper line = control) and lower line (not controlling). Thus, there is a 1% or less chance of committing the so-called type one error (H0), that is, accepting H1 when the hypothesis is H0 (not recommending the control). From an adult of Anastrepha spp., on average, this probability of error becomes zero. This means that above this level of infestation (an adult of Anastrepha spp. on average per trap), the probability of committing the type one error (H0), that is, not recommending control when it is necessary (H1), is practically 0%.
The hypotheses tested (H0: μ0 = 0.4 and H1: μ1 = 0.7) by this sampling plan using the field worksheet for decision making in guava farming anticipate any surprise of lack of information about the presence of Anastrepha spp. in orchards. This sampling plan will also support farmers in controlling species of Anastrepha pests and non-pests.
The control of these fruit flies is facilitated by their aggregate distribution behavior, since the management used for suppression will have a greater effect of reaching the number of the population. Moreover, the plan should enable the rural producer to constantly monitor the Anastrepha species, avoiding their attack on other host plants by anticipating the infestation on commercial or non-commercial farms.
Also, the number of traps for this population monitoring practice of Anastrepha species in orchards is considered small, with low cost (trap R$ 20.00 unit-1 + bait R$ 20.00 liter-1) compared to expenses with other inputs, if their level of damages is not detected in advance. The normal management of the crop would have spent approximately R$ 30.00 per guava tree per year, without having any effect on the control. With low mean of Anastrepha spp. adults per sample, a more accurate decision on the infestations by these tephritides is shown per sample (Figure 3). It is also verified that a continuous monitoring activity in the conditions that the fruit flies are randomly distributed, the number of traps used to observe the population level can be up to three per orchard (Figure 3). The mean number of adult fruit fly caught determines the increase in the number of McPhail traps. After reaching the maximum sampling size, the number of traps will decrease as the mean number of adults of Anastrepha spp. is captured (Figure 3).
CONCLUSIONS
1. A sequential sampling plan was established for the first time to monitor fruit fly of the genus Anastrepha in guava farms; 2. A field worksheet was developed to support decision making in a practical and rapid way with low error level for the control of fruit fly species of the genus Anastrepha in guava orchards; 3. For this sampling plan, the number of sampling units (traps) required ranged from 5 to 36 traps per sample to support an Anastrepha species control decision-making, based on the mean number of captured adults imbued with the method; and 4. The field worksheet is based on the aggregate distribution pattern of the populations of Anastrepha spp. by the negative binomial method in guava orchards and refers to levels of safety and control corresponding to the index of 0.1 of MAD.
REFERENCES
- BARBOSA JC. 1992. A amostragem sequencial. In: Fernandes OA, Correia ACB and de Bortoli SA (Eds), Manejo integrado de pragas e nematoides. Jaboticabal, FUNEP, p. 205-211.
- FERNANDES MG, BUSOLI AC AND BARBOSA JC. 2003. Amostragem sequencial de Alabama argillacea (Hübner) (Lepidoptera: Noctuidae) em algodoeiro. Neot Entomol 32: 117-122.
- IBGE - INSTITUTO BRASILEIRO DE GEOGRAFIA E ESTATÍSTICA. 2014. Produção Agrícola Municipal: Culturas temporárias e permanentes. 41: 1-100.
- NASCIMENTO AS, CARVALHO RS AND MALAVAS A. 2000. Monitoramento populacional. In: Malavas A and Zucchi RA (Eds), Moscas-das-frutas de importância econômica no Brasil: conhecimento básico e aplicado. Ribeirão Preto: Holos, 200 p.
- NICÁCIO JN, UCHOA MA, FACENDA O, GUIMARÃES JA AND MARINHO CF. 2011. Native larval parasitoids (Hymenoptera) of frugivorous Tephritoidea (Diptera) in South Pantanal Region, Brazil. Fla Entomol 94: 407-419.
- PEEL MC, FINLAYSON BL and MCMAHON TA. 2007. Updated world map of the Köppen-Geiger climate classification. Hydrol Earth Syst Sci 11: 1633-1644.
- PETINARI RA, TERESO MJA AND BERGAMASCO S. 2008. A importância da fruticultura para os agricultores familiares da região de Jales-SP. Rev Bras Frutic 30: 356-360.
- SALAS JAS AND CHAVEZ JEP. 1981. Fluctuación poblacional de la mosca mexicana de la fruta Anastrepha ludens (Loew), en General Terán y Montemorelos, Nuevo León. Agric Tec Méx 7: 65-75.
- UCHOA MA. 2012. Fruit Flies (Diptera: Tephritoidea): Biology, host plants, natural enemies, and the implications to their natural control. In: Larramendy ML and Soloneskii eS (Eds), Integrated pest management and pest control: current and future tactics. Croatia: Intech, 668 p.
- WALD A. 1947. Sequential analysis. New York: J Wiley & Sons, Inc., 212 p.
- YOUNG LJ AND YOUNG JH. 1998. Statistical ecology: a population perspective. Boston: Kluwer Academic Publishers, 565 p.
Publication Dates
-
Publication in this collection
Oct-Dec 2018
History
-
Received
1 Mar 2018 -
Accepted
18 May 2018