
Abstract
Abstract: Expanding populations may loss genetic diversity because sequential founder events throughout a wave of demographic expansion may cause “allele surfing”, as the alleles of founder individuals may propagate rapidly through space. The spatial components of allele surfing have been studied by geneticists, but have never been investigate on dynamic and shifting habitats. Here we used an individual-based-model (IBM) to study how interactions between different habitat restoration scenarios and biological characteristics (dispersal capacity) affect the spatial patterns of the genetic structure of a population during demographic expansion. We found that both habitat dynamics and dispersal capacity, as well as their interaction, were the drivers of emergent pattern of genetic diversity and allele surfing. Specifically, allele surfing is more common when a species with low dispersal capacity colonizes a large geographic area with slow restoration (low carrying capacity). Despite this, we showed that allele surfing can be reduced, or even avoided, by dispersal management through suitable habitat restoration. Thus, investigating how colonization generates a spatial variation in genetic diversity, and which parameters control the emergent genetic pattern, are essential steps to planning assisted gene flow, which is fundamental for an effective planning of habitat restoration.
Key words
allele surfing; dispersal; habitat suitability; individual-based-model; simulation
INTRODUCTION
Population expansions commonly occur during the evolutionary history of many species, and are expected to be followed by retraction and subsequent population re-expansion (RicklefsRICKLEFS RE and BERMINGHAM E. 2002. The concept of the taxon cycle in biogeography. Global Ecol Biogeogr 11(5): 353-361. and Bermingham 2002). Range dynamics may occur by a stochastic expansion of populations spreading from initial source by neutral dynamics (LandeLANDE R. 1988. Genetics and demography in biological conservation. Science 41(4872): 1455-1460. 1988) or by tracking natural climatic changes, resulting on population fluctuations and reorganization of genetic diversity patterns within and among populations (ArenasARENAS M et al. 2014. The scaling of genetic diversity in a changing and fragmented world. In: Henle K et al. (Eds), Scaling in Ecology and Biodiversity Conservation. Sofia: Pensoft Publishers, p. 55-60. et al. 2012, 2013ARENAS M, FRANÇOIS O, CURRAT M, RAY N and EXCOFFIER L. 2013. Influence of admixture and paleolithic range contractionns on current European diversity gradients. Mol Biol Evol 30: 57-61., 2014ARENAS M, RAY N, CURRAT M and EXCOFFIER L. 2012. Consequences of Range Contractions and Range Shifts on Molecular Diversity. Mol Biol Evol 29: 207-218., MonaMONA S, RAY N, ARENAS M and EXCOFFIER L. 2014. Genetic consequences of habitat fragmentation during a range expansion. Heredity 112: 291-299. et al. 2014, AlvesALVES I, ARENAS M, CURRAT M, HANULOVA AS, SOUSA VC, RAY N and EXCOFFIER L. 2016. Long-Distance Dispersal Shaped Patterns of Human Genetic Diversity in Eurasia. Mol Biol Evol 33: 946-958. et al. 2016). However, anthropogenic habitat destruction and fast climatic changes have increased the speed and intensity in which populations expand or retract (AmosAMOS JN, BENNETT AF, MAC NALLY R, NEWELL G, PAVLOVA A, RADFORD JQ, THOMSON JR, WHITE M and SUNNUCKS P. 2012. Predicting landscape-genetic consequences of habitat loss, fragmentation and mobility for multiple species of woodland birds. PLoS ONE 7: e30888. et al. 2012), with unexpected ecological and evolutionary consequences, such as a decrease of genetic variability, which would occur naturally over much larger temporal scales (Ricklefs and Bermingham 2002). The reduction in genetic diversity can reduce the population survival probability against selective pressures (AnnaviANNAVI G, NEWMAN C, BUESCHING CD, MACDONALD DW, BURKE T and DUGDALE HL. 2014. Heterozygosity – fitness correlations in a wild mammal population: accounting for parental and environmental effects. Ecol and Evol 4(12): 2594-2609. et al. 2014, Arenas et al. 2012) and make more difficult to quickly adapt to new environments (i.e., evolutionary rescue) (BellBELL G. 2013. Evolutionary Rescue and the limits of adaptation. Phil Trans R Soc B 368: 20120080. 2013).
The effect of population retraction induced by human processes usually trigger intense population isolation and, consequently, rapid decrease in population genetic diversity (FrankhamFRANKHAM R, BALLOU JD and BRISCOE DA. 2002. Introduction to Conservation Genetics. Cambridge University Press, Cambridge. et al. 2002). There are potential demographic benefits of population expansion to species conservation because it commonly increases population size and connections with other populations, increasing resilience and stabilizing-increasing overall genetic diversity (MetzgerMETZGER JP. 2001. O que é ecologia de paisagens? Biota Neotrop 1(1): 1-9. 2001). Often, expanding populations are less susceptible to genetic drift than stationary populations (ExcoffierEXCOFFIER L, FOLL M and PETIT RJ. 2009. Genetic consequences of range expansions. Annual Rev Ecol Evol Syst 40: 481-501. et al. 2009, HartlHARTL DL and CLARK AG. 2010. Princípios de Genética de Populações. Quarta Edição. Art Med Editora: Porto Alegre. and Clark 2010). However, during rapid demographic expansions, the expanding population may have substantially less genetic diversity due to a founder effect, wherein, the genetic pool of newly occupied habitats originates from a small sample of pioneer individuals (HallatschekHALLATSCHEK O and NELSON DR. 2008. Gene surfing in expanding populations. Theor Pop Biol 73: 158-170. and Nelson 2008, SlatkinSLATKIN M and EXCOFFIER L. 2012. Serial founder effects during range expansion: a spatial analog of genetic drift. Genetics 191: 171-181. and Excoffier 2012). Sequential founder events throughout a wave of demographic expansion may therefore cause the “allele surfing”, which occurs as the alleles of founder individuals may propagate rapidly and be maintained through space (Excoffier et al. 2009, GoodsmanGOODSMAN DW, COOKE B, COLTMAN DW and LEWIS MA. 2014. The genetic signature of rapid range expansions: How dispersal, growth and invasion speed impact heterozygosity and allele surfing. Theor Pop Biol 98: 1-10. et al. 2014, Hallatschek and Nelson 2008, KlopfsteinKLOPFSTEIN S, CURRAT M and EXCOFFIER L. 2006. The fate of mutations surfing on the wave of a range expansion. Mol Biol Evol 23: 482-490. et al. 2006, PeischlPEISCHL S and EXCOFFIER L. 2015. Expansion load: recessive mutations and the role of standing genetic variation. Mol Ecol 24(9): 2084-2094. et al. 2015, PiercePIERCE AA, ZALUCKI MP, BANGURA M, UDAWATTA M, KRONFORST MR, ALTIZER S, HAEGER JF and DE ROODE JC. 2014. Serial founder effects and genetic differentiation during worldwide range expansion of monarch butterflies. Proc R Soc B 281: 20142230. et al. 2014, Slatkin and Excoffier 2012). Thus, spatial models show that rapid population expansion may generate a pattern of decreasing genetic variability with the increase in geographic distance from the source population (Excoffier and RayEXCOFFIER L and RAY N. 2008. Surfing during population expansions promotes genetic revolutions and structuration. Trends Ecol Evol 23: 347-351. 2008, Hallatschek and Nelson 2009HALLATSCHEK O and NELSON DR. 2009. Life at the front of an expanding population. Evolution 64: 193-206.).
Allele surfing has been reported in different organisms, such as bacteria (HallatschekHALLATSCHEK O, HERSEN P, RAMANATHAN S and NELSON DR. 2007. Genetic drift at expanding frontiers promotes gene segregation. Proc Natl Acad Sci 104: 19926-19930. et al. 2007), tortoises (GraciáGRACIÁ E, BOTELLA F, ANADÓN JD, EDELAAR P, HARRIS DJ and GIMÉNEZ A. 2013. Surfing in tortoises? Empirical signs of genetic structuring owing to range expansion. Biol Let 9: 20121091. et al. 2013), onagers (GuetaGUETA T, TEMPLETON AR and BAR-DAVID S. 2014. Development of genetic structure in a heterogeneous landscape over a short time frame: the reintroduced Asiatic wild ass. Conserv Genet 15: 1231-1242. et al. 2014) and in humans (MoreauMOREAU C, BHÉRER C, VÉZINA H, JOMPHE M, LABUDA D and EXCOFFIER L. 2011. Deep Human Genealogies Reveal a Selective Advantage to Be on an Expanding Wave Front. Science 334: 1148. et al. 2011). Computational simulations have also provided new results about genetic patterns emerging from demographic expansions. These studies have evaluated the effects of population growth rate and size, carrying capacity and migration rates as drivers of allele surfing pattern, and under which conditions this generated pattern would affect species adaptation under a low genetic variability available scenario (Excoffier et al. 2009, Goodsman et al. 2014, GralkaGRALKA M, STIEWE F, FARRELL F, MÖBIUS W, WACLAW B and HALLATSCHEK O. 2016. Allele Surfing Promotes Microbial Adaptation from Standing Variation. Ecol Lett 19(8): 889-898. et al. 2016, Peischl et al. 2015PEISCHL S, KIRKPATRICK M and EXCOFFIER L. 2015. Expansion load and the evolutionary dynamics of a species range. Am Nat 185(4): E81-E93., Slatkin and Excoffier 2012). For example, the variation of dispersal capacity could affect the genetic pool during new demographic expansion processes (Slatkin and Excoffier 2012).
However, it is important to consider that demographic expansions usually do not occur in temporally homogeneous and static habitats. The variation of the environmental quality along space and time during habitat degradation and restoration process can control the dispersion and spatial distribution of individuals, and therefore should affect the population genetic structure (Frankham et al. 2002). There is no fixed pattern of habitat restoration and different types of recovery can be deeply related with the velocity of demographic expansion of previously isolated populations and consequently influence the allele surfing occurrence (Slatkin and Excoffier 2012). Nevertheless, studies exploring allele surfing have not explicitly considered the effect of landscape features and have been conducted empirically at controlled and stable environments (Hallatschek et al. 2007), or in computer simulations that are spatially implicit or spatially homogeneous (FayardFAYARD J, KLEIN EK and LEFEVRE F. 2009. Long distance dispersal and the fate of a gene from the colonization front. J Evol Biol 22: 2171-2182. et al. 2009, Goodsman et al. 2014, Klopfstein et al. 2006, Slatkin and Excoffier 2012). Thus, if spatial patterns of genetic diversity may be caused not only by evolutionary or demographic processes, but also by interaction with habitat features, further studies considering spatial and temporal dynamics of such features might provide valuable results (BenguiguiBENGUIGUI M and ARENAS M. 2014. Spatial and temporal simulation of human evolution. Methods, frameworks and applications. Current Genomics 15: 245-255. and Arenas 2014, CurratCURRAT M, GERBAULT P, DI D, NUNES JM and SANCHEZ-MAZAS A. 2016. Forward-in-Time, Spatially Explicit Modeling Software to Simulate Genetic Lineages Under Selection. Evol Bioinformatics, p. 27-39. et al. 2016, Mona et al. 2014, Ray and Excoffier 2009RAY N and EXCOFFIER L. 2009. Inferring past demography using spatially explicit population genetic models. Hum Biol 81: 141-157.).
Investigating the role of stochastic processes on spatial patterns of genetic diversity during demographic expansions offers important insights for species conservation (Gueta et al. 2014). Because natural restoration of habitats (without human intervention) may not be enough to preserve genetic diversity due to allele surfing, population expansions in naturally restored habitats can generate patches of low genetic diversity across space. Therefore, understanding how demographic expansions generate genetic patterns at dynamic habitats and how different restoration scenarios and dispersal capacities could influence these patterns could help conservationists to determine conditions to restore degraded habitats in order to reduce the spread of low genetic diversity (decreasing allele surfing).
Here we propose a theoretical exercise to examine how the interaction between environmental dynamics (hypothetical habitat restoration) and biological characteristics (dispersal capacity) affects the spatial patterns of the genetic structure of a hypothetical population during a demographic expansion process. Specifically, we tested the hypothesis that the genetic spatial pattern of the expanding populations would vary according to the combination of dispersion capacity and habitat restoration type, with a slow occupation process, further spreading low genetic variability throughout space as a result of the founding effect. We used an individual-based neutral model to study the ecological dynamics and spatial processes generating allele surfing over time and space. Our model does not encompass all the complexity of a real-world landscape, and the movement of individuals over the landscape is simplified. However, our proposal is model simplification, in order to provide a general answer to any landscape, given the limitations of interpretation and assumptions of our model. If we could incorporate all the complexity of a real landscape we would instead move on the direction of a “realistic model”, having limited conclusions to the features of the modeled system. Nevertheless, our theoretical results help to predict ecological features that drive population to be vulnerable due to low genetic variability during geographic expansions.
METHODOLOGY
GENERAL MODEL STRUCTURE
We used an individual-based neutral model covering 20,000 demes (i.e., hexagonal cells) distributed over a regular circular grid. The habitat suitability of each deme, at a specific moment, determines how many individuals can inhabit there. The carrying capacity of a cell at maximum suitability was 20 individuals. At each time step, the population of each deme is recalculated based on current habitat suitability, which may range from 0% (0 individuals) to 100% (20 individuals). Regardless of population size, 50% of the individuals die, in each deme, at each time step. Among the recolonizing (new) individuals, a constant proportion is offspring of surviving individuals occupying the deme (1 - M) and the other part is composed by individuals migrating from neighboring demes (M) within a specified distance radius (G = number of cells an individual can cross). Higher G-values represent larger distances that migrants could disperse to colonize a specific deme. We used G-values of 1, 5 and 10 to test the influence of dispersal capacity on allele surfing dynamics. Methodologically, we choose these G-values to explore different levels of dispersal distance at space domain, thus, we used migration distances (G) to represent small, medium and large groups of cells.
The simulated individuals are diploid and for each one, we simulated a locus with four alleles, creating thus 10 possible genotypes. The four alleles had equal allele frequencies in time zero and were initially distributed randomly among the individuals (thus creating stochastic variation in allele frequencies in space). Because of the equal initial frequencies, allele frequencies are not too low so that genetic drift quickly fix alleles and eliminate spatial variation. In the real world, each species would have its actual conditions of allelic frequency and this species-specific prediction could be considered more realistic (but at the same time the number of loci and alleles would be much higher). However, we are more interested in a general model to focus on the process as a whole rather than in a specific condition of initial allelic structure.
In our model we considered the MendelMENDEL G. 1866. Versuche über Plflanzenhybriden. Verhandlungen des naturforschenden Vereines in Brünn, Bd. IV für das Jahr 1865. Abhandlungen, p. 3-47.’s law of independent assortment (Mendel 1866) which assumes that during gamete formation the segregation of the alleles of one locus is independent of the segregation of the alleles of another locus, meaning that alleles for different traits are transmitted independently of one another from parents to offspring. Thus, if we used one, tens or hundreds of loci by simulation we would find same patterns of results for each locus, but involving an amount of data computationally infeasible, justifying our choice for using only one locus. New individuals are born from two parent individuals randomly chosen from the same deme. During the birth of an individual, each locus of the chromosomes is a copy of a randomly chosen locus from one of its respective parents. All individuals were ecologically equivalent (therefore a neutral simulation, as defined by HubbellHUBBELL SP. 2001. The Unified Neutral Theory of Biodiversity and Biogeography. Princeton University Press: Princeton. 2001). Thus, probability of migration, survival/death and reproduction did not change with genetic composition (homo/heterozygosis), and mutation was assumed to have negligible effects at the time scale simulated here.
Neutral models have a long history in ecology and genetics, although they have always been criticized for being over-simplified. In Ecology, the most famous are McArthur and Wilson’s 1967 model of Island Biogeography, and the model used by Hubbell 2001, on his Neutral Theory of Ecology. In genetics, Motoo KimuraKIMURA M. 1983. The neutral theory of molecular evolution. Cambridge University Press, Cambridge, England. 1983 triggered the neutralist vs selectionist debate over molecular evolution, which was also, to some extent, a debate on model generality vs realism. We are not suggesting that all individuals have the exact same ecological or genetic features, but assume neutrality (sensu Kimura) for modeling purposes. Even with such simplified models, the emerging genetic patterns could be far from trivial. Despite the simplicity and generality of the modeled mechanisms, the stochastic nature of several events (mortality, breeding, dispersal, genetic features), as well as the diversity of the model agents (individuals), creates a complex interactive system.
SIMULATED SCENARIOS OF DEMOGRAPHIC EXPANSION
We used five scenarios of demographic expansion to guide hypothetical conditions of restoration of habitats and explore dispersive processes: one without demographic expansion, as a control, and four expansions controlled by different types of habitat restoration (Fig. 1). In all expansion scenarios, the initial population was at the center of simulation grid limits. As neighborhood demes becomes suitable (based on the structure of each scenario), migrating individuals colonized empty cells, therefore promoting a demographic wave expansion. Scenario A – No environmental dynamics, and therefore no population expansion. The suitability of all cells was the highest since the simulation start; Scenario B - Initial central population with highest environmental suitability and the entire surrounding environment gradually improving. The transition of suitability takes the entire time series (1500 time steps) to complete the maximum suitability. This scenario represents a habitat that was degraded and went through natural restoration after being abandoned; Scenario C - Initial central population with highest environmental suitability and instantaneous environmental recover of the entire surrounding environment (i.e. at time step 1 the entire space is replaced by the maximum suitability). This scenario represents a degraded area that goes through intense restoration management (i.e. supplementation of fertilizer to the ground, reforestation with mature vegetation, etc.); Scenario D - Initial central population with highest environmental suitability, but with slow increase in environmental suitability around adjacent cells (different from scenario B in which the entire habitat is simultaneously restored). Each “restoring ring” is two distance units thick, and it takes 50 time steps for each ring to complete its environmental restoration (maximum suitability). This scenario represents a habitat restoration in parts with slow regeneration stages; Scenario E - Similar to the scenario D, but with each additional ring emerging instantaneously with maximum environmental suitability. Rings also emerge at 50 time steps apart. This scenario represents a habitat that is managed and restored in parts, but each part would become highly environmentally suitable immediately (i.e. planting mature vegetation or refuge areas supplementation). In all simulations, wave front was only at the extreme cells among all cells composed by populations, which allowed studying allele dynamics over the colonization process, according to models of serial founder effect (Slatkin and Excoffier 2012).

A scheme of the five simulation scenarios implemented in this study. Scenario A consists in a stable environment (no demographic expansion), whereas the four additional scenarios have different forms of demographic expansion. The total area under habitat restoration may be large (Scenarios B and C), or just a group of adjacent cells (Scenarios D and E). The rate of habitat restoration may be slow and gradual (Scenarios B and D), or instantaneous (Scenarios C and E).
SPATIAL AND STATISTICS ANALYSES
We ran 15 simulations, each one replicated 100 times, consisting of different expansion scenarios defined above and different dispersion abilities (five restoration scenarios versus three dispersal capacities). Each simulation encompassed 1500 time steps (i.e. generations). The genetic spatial pattern that characterizes allele surfing is the local fixation of a surfing allele (maximum frequency). Thus, we created the Z index to measure the occurrence of allele surfing by comparing the allele frequencies among nearby cells:
where f i and f j are values of allelic frequency on locations i and j, n is the total number of grid cells, l is each simulated allele, such that f i , l is the frequency of allele l on location I, p is the number of alleles. w ij indicates whether localities are geographically connected by dispersal (w ij = 1 indicates that locations i and j are connected by dispersal, whereas w ij = 0 indicates that these localities are not connected, or absence of autocorrelation of the cells). The Z index ranges between 1 (maximum), when all connected localities (i and j) are dominated by a single allele (a fixed allele) (positive autocorrelation), and 0 (minimum), when adjacent localities do not share common alleles (absence autocorrelation). Then, high Z values indicate occurrence of allele surfing. There are several commonly used spatial autocorrelation indexes (Moran’s I, Getis-Ord G) that bear some mathematical relationship with Z. However, while these indexes are used to measure similarity between pairs of spatially referenced observations, Z is designed to compare frequencies of multiple alleles.
Because allele surfing is characterized by strong directional patterns in allele frequency across space (Hallatschek et al. 2007), estimating the occurrence of allele surfing based on an index that assumes perfect isotropy could potentially misrepresent the spatial pattern in allele frequency. Thus, we partitioned the simulated grid into eight independent sectors of 45º, and calculated the Z index for each sector. Dividing the geographic space into directional sectors has been a common strategy to deal with anisotropic data (FortinFORTIN MJ and DALE MRT. 2005. Spatial Analysis – A Guide for Ecologists Cambridge University Press. and Dale 2005).
To describe the temporal dynamics of genetic patterns resulting from population expansion, we created a temporal angular graphic (for each simulated scenario), plotting the Z value of an angle (sector) at each time step. Since each replicate represents independent patterns of allele surfing which may occur in any sector, using many replicates is not an interesting approach for this graphic because summary statistics (means, medians, variance) for each sector will tend to be more similar as the number of replicates increase, preventing the visualization of the temporal pattern of spread of alleles (Figs. S1 and S2 – Supplementary Material SUPPLEMENTARY MATERIAL Fig. S1 - Spatial genetic sectors formed during demographic expansions through time to populations with individuals with different dispersal capacities (G = 1, G = 5, G = 10) and under different scenarios of habitat restoration. The center of each circle represents the time = 0, and the border, time = 1500. The average Z-value of 10 replicas (allelic fixation index) of each time interval (corresponding to 10 time steps) of each sector was plotted concentrically forming the pie charts with 150 time slices. The Scenario (A) had no expansion, (B) population disperses at habitat restored gradually in a homogeneous way, (C) population disperses at habitat restored immediately at maximum suitability in a homogeneous way, (D) population disperses at habitat restored at parts and with maximum suitability immediately and (E) population disperses at habitat restored at parts and with gradual increase of suitability. Fig. S2 - Completely homogeneous plots from average Z value of 100 replicas simulated to populations with individuals with different dispersal capacities (G = 1, G = 5, G = 10) and under different scenarios of habitat restoration. The center of each circle represents the time = 0, and the border, time = 1500. The average Z-value for 100 replicas (allelic fixation index) of each time interval (corresponding to 10 time steps) of each sector was plotted concentrically forming the pie charts with 150 time slices. The Scenario (A) had no expansion, (B) population disperses at habitat restored gradually in a homogeneous way, (C) population disperses at habitat restored immediately at maximum suitability in a homogeneous way, (D) population disperses at habitat restored at parts and with maximum suitability immediately and (E) population disperses at habitat restored at parts and with gradual increase of suitability. ). Then this figure was built using results from only one replicate. Additionally, we performed temporal angular graphics using 10 and 100 replicates, using averages of allele frequency of each cell between all replicates to calculate Z angular and illustrate this problem (Figs. S1 and S2).
Finally, we performed an Analysis of Variance (ANOVA) to investigate if different expansion scenarios and distinct dispersal capacities determine the occurrence of allele surfing. The dependent variable was the mean Z value among the eight sectors (for each replicate) at the final time step (t = 1500, when the expansion process was concluded), and the explanatory variables were the demographic expansions scenarios (five levels) and dispersal capacity (three levels). For this analysis we used the 100 replicates of each parameter combination.
RESULTS
In dynamic environments, habitat restoration and dispersal capacity, as well as their interaction, were important factors driving the occurrence and intensity of allele surfing (Habitat Restoration: F = 1499.6; df = 4, 1485; p < 0.001. Dispersal Capacity: F = 5902.4; df = 2, 1485; p < 0.001; Interaction: F = 201.2; df = 8, 1485; p < 0.001) (Figs. 2 and3). In general, the strongest signal of allele surfing occurred when species had low dispersal capacity (especially at scenario B; G=1). Therefore, alleles of short distance dispersers are more likely to surf the wave of demographic expansion than alleles of long distance dispersers. We observed the emergence of strong spatial signal in allele frequencies within grid sectors (genetically homogeneous regions), which indicates the fixation of alleles caused by demographic expansion towards a specific direction (Fig. 2).
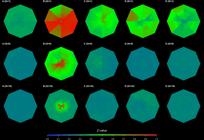
Octagons indicating spatial and temporal dynamics of genetic patterns under different simulation scenarios. Each 45º sector corresponds to an area of the grid that was analyzed independently. Within each sector of the octagon, a line drawn from the center to the edge will cross the entire time span of the simulation (center represents time = 0, whereas border represents time = 1500). The Z-value (allelic fixation index) of each time interval (corresponding to 10 simulation time steps), of each sector, was plotted concentrically, forming 150 concentric layers colored according to the Z-value of the sector. Warmer colors indicate higher Z-value, therefore higher frequency of an allele over the space. Each octagon depicts the emerging genetic pattern according to different dispersal capacities (G = 1, G = 5, G = 10) and different scenarios of habitat restoration (A – E). Scenario A consists in a stable environment (no demographic expansion). Scenarios B and C have the entire domain under habitat restoration, whereas Scenarios D and E have only partial restoration. Scenarios B and D have rapid habitat restoration, while C and E have gradual habitat restoration. The graph was made for only one replica, using many replicas is not an interesting approach for this figure because summary statistics (e.g. means, medians, variance) for each sector will tend to be more similar as the number of replicates increases, preventing visualize the space-temporal pattern of dispersion of alleles. Allele surfing may occur in different sectors along the different replicates, because it does not have to occur always in the same sector (there are no processes related to specific sectors).

Boxplots representing the distribution of Z-values (allelic fixation index) for each simulation scenario (different habitat restoration and dispersal capacities), at the final time step of simulation. Colors indicate species’ dispersal capacity (red: G = 1; green: G = 5; blue: G = 10). Scenario A consists in a stable environment (no demographic expansion). Scenarios B and C have the entire domain under habitat restoration, whereas Scenarios D and E have only partial restoration. Scenarios B and D have rapid habitat restoration, while C and E have gradual habitat restoration. Thick horizontal lines in the boxes are medians, and upper and lower boxes represent the upper and lower quartiles respectively. Vertical dashed lines outside boxes represent values up to 1.5 times the interquartile range. Atypical values or outliers (discrepant values) were plotted as individual points outside the boxes.
The combination between geographic space available and velocity of environmental restoration results on different genetic composition during demographic expansions. The scenario B (gradual restoration of the whole surrounding area) was where the allele surfing pattern most emerged. Although the highest Z-values were observed at low dispersal capacity, allele surfing occurred regardless of dispersal capacity in this scenario, indicating that when habitat restoration occurs slowly along the whole surrounding area, demographic expansion decreases genetic variability of populations with any dispersal capacity along the expansion. For species with high dispersal capacity, the spatial structure and rate of habitat restoration seem irrelevant to the occurrence of allele surfing. Conversely, species with low dispersal capacity show signal of allele surfing in any demographic expansion, although gradual restoration of habitats (scenarios B and D) seems to strengthen allele surfing (Fig. 3).
DISCUSSION
We used an individual-based simulation model to understand how environmental dynamics and dispersal capacity could affect the genetic diversity of recently colonized areas, as well as the geographic signal of allele surfing. Allele surfing was most frequent in species that have low dispersal capacity, in accordance with many other studies (Fayard et al. 2009, PhillipsPHILLIPS BL. 2015. Evolutionary processes make invasion speed difficult to predict. Biol Inv 17: 1949-1960. 2015, RayRAY N and EXCOFFIER L. 2010. A first step towards inferring levels of long-distance dispersal during past expansions. Mol Ecol Resour 10: 902-914. and Excoffier 2010). Species capable of long distance dispersal have peripheral populations less isolated from the core populations, therefore maintaining greater allelic variability during demographic expansions (Peischl et al. 2015). However, Pierce et al. 2014 suggested that even in highly mobile species allele surfing patterns may emerge during population expansions. Our scenario B supports Pierce’s et al. 2014 interpretation, as slow and gradual habitat restoration promotes substantial allele surfing for any dispersal capacity. Under this scenario, a vast empty area is available for colonization, but due to the slow habitat restoration, the population size at improving habitat starts very small. Thus, small population size at initial stages of habitat restoration reinforces the founder effect, promoting the allele surfing throughout space.
We found that the combination of low dispersal capacity and slow recovery of large areas had a strong positive effect on the occurrence of allele surfing (Fig. 2 and Fig. 3). Indeed, this result appears as the importance of the interaction term in the ANOVA. Natural populations under these conditions, which are probably common in degraded habitats left for natural recovery, should be carefully managed in conservation projects to avoid genetic losses due to allele surfing.
Allele surfing can be prevented by slowing demographic expansion and/or avoiding founder effect, by promoting habitat restoration in parts of the domain, instead of restoring the entire domain simultaneously (e.g., Scenarios D and E). In addition, founder effect can be avoided by promoting rapid improvement of the habitat, therefore preventing initial colonization of a small population (Scenarios C and E). The restoration scenarios were able to minimize allele surfing occurrence during demographic expansions, even for most vulnerable species (low dispersal capacity). In these scenarios each space portion received individuals quickly, controlling the founder effect and consequently the reduction of the genetic drift effect (Slatkin and Excoffier 2012). Thus, as the population progressed, the individuals of front (founders) were continually resampled and provided migrants to next habitat with genetic variability (Hallatschek and Nelson 2009).
Our simulation advances toward incorporation of environmental complexity of the landscape in genetic patterns predictions. However, our study is limited to neutral alleles, although disadvantageous alleles (recessives) also have been documented to surf during demographic expansions and reach high frequencies (Klopfstein et al. 2006, Peishl et al. 2015, Slatkin and Excoffier 2012). Recessive alleles may be carried by founder individuals during demographic expansions, and may become most frequently in the recently colonized area. Thus, natural selection may not be able to eliminate the recessive alleles from the population (Peischl and Excoffier 2015). This phenomenon may explain the large spread of some disadvantageous recessive alleles, for instance, in humans (Klopfstein et al. 2006, SouzaSOUZA V, PEISCHL S and EXCOFFIER L. 2014. Impact of range expansions on current human genomic diversity. Curr Opin Genet Dev 29: 22-30. et al. 2014). Thus, allele surfing pattern may have a negative genetic effect and its consequence is even more pronounced when it spreads and fixes disadvantageous alleles, forming an “expansion load” (Peischl et al. 2015). The deleterious load can decrease population fitness and limit the ability of species to colonize new habitats due to combination of effect of directional patterns in allele spread and selection at the edge of the geographical expansions (Peischl et al. 2015, Peischl and Excoffier 2015). Therefore, future studies within the context of dynamic environments (as this study) need to investigate how natural selection and directional allele spread interact to determine genetic diversity patterns (Hallatschek and Nelson 2009, Peischl et al. 2015).
Habitat fragmentation is a dynamic process over time and may have many effects on genetic diversity of populations during species range expansions (Mona et al. 2014). Degraded habitats are commonly abandoned and left to restore naturally (CéspedesCÉSPEDES M, GUTIERREZ MV, HOLBROOK NM and ROCHA JO. 2003. Restoration of genetic diversity in the dry forest tree Swietenia macrophylla (Meliaceae) after pasture abandonment in Costa Rica. Mol Ecol 12: 3201-3212. et al. 2003), which was represented by our Scenario B (slow restoration of a large area). This was the worst scenario identified in our study, considering the high and strong occurrence of allele surfing. It is very likely that habitats left to be restored naturally (as Scenario B) currently have populations with low genetic variability, especially if their populations have low dispersal capacity. Thus, populations of species with short dispersal capacity could require assisted dispersal and managed habitat restoration. Consequently, conservation programs must design adequate habitat restoration programs (e.g. restoring consecutive portions of habitat by creating adjacent areas of high habitat suitability), as well as facilitating the introduction or arrival of large populations.
Allele surfing patterns emerging from populations expansions have been documented in several population genetic studies (Excoffier et al. 2009, Goodsman et al. 2014, Peischl et al. 2015, Slatkin and Excoffier 2012). However, the processes and conditions responsible for the occurrence of such alleles fixation have not been properly explored in dynamical environments (as currently occurs under fragmentation and habitat restoration scenarios). We have shown here that species with low dispersal capacity may have populations with low genetic variability due to the occurrence of allele surfing along the geographical expansion process of these populations. However, allele surfing can be reduced or avoided by dispersal management through suitable habitat restoration. Therefore, conservation management programs that aim to restore degraded habitats and allow natural population expansions may not be efficient to ensure genetic diversity of species over time.
ACKNOWLEGMENTS
RTB and JFMR thank Coordenação de Aperfeiçoamento de Pessoal de Nível Superior (CAPES) by doctoral scholarship and Editor and anonymous reviewers for their constructive comments. This paper was part of the Conselho Nacional de Desenvolvimento Científico e Tecnológico (CNPq) in the GENPAC (Genética Geográfica e Planejamento Regional para Conservação do Cerrado - projects # 564717/2010-0 and #564718/2010-6). Work by TFR and JAFD-F is developed in the context of the INCT project in Ecology, Evolution and Biodiversity Conservation (EECBio) supported by CNPq and Fundação de Amparo à Pesquisa do Estado de Goiás (FAPEG).
REFERENCES
- ALVES I, ARENAS M, CURRAT M, HANULOVA AS, SOUSA VC, RAY N and EXCOFFIER L. 2016. Long-Distance Dispersal Shaped Patterns of Human Genetic Diversity in Eurasia. Mol Biol Evol 33: 946-958.
- AMOS JN, BENNETT AF, MAC NALLY R, NEWELL G, PAVLOVA A, RADFORD JQ, THOMSON JR, WHITE M and SUNNUCKS P. 2012. Predicting landscape-genetic consequences of habitat loss, fragmentation and mobility for multiple species of woodland birds. PLoS ONE 7: e30888.
- ANNAVI G, NEWMAN C, BUESCHING CD, MACDONALD DW, BURKE T and DUGDALE HL. 2014. Heterozygosity – fitness correlations in a wild mammal population: accounting for parental and environmental effects. Ecol and Evol 4(12): 2594-2609.
- ARENAS M et al. 2014. The scaling of genetic diversity in a changing and fragmented world. In: Henle K et al. (Eds), Scaling in Ecology and Biodiversity Conservation. Sofia: Pensoft Publishers, p. 55-60.
- ARENAS M, FRANÇOIS O, CURRAT M, RAY N and EXCOFFIER L. 2013. Influence of admixture and paleolithic range contractionns on current European diversity gradients. Mol Biol Evol 30: 57-61.
- ARENAS M, RAY N, CURRAT M and EXCOFFIER L. 2012. Consequences of Range Contractions and Range Shifts on Molecular Diversity. Mol Biol Evol 29: 207-218.
- BELL G. 2013. Evolutionary Rescue and the limits of adaptation. Phil Trans R Soc B 368: 20120080.
- BENGUIGUI M and ARENAS M. 2014. Spatial and temporal simulation of human evolution. Methods, frameworks and applications. Current Genomics 15: 245-255.
- CÉSPEDES M, GUTIERREZ MV, HOLBROOK NM and ROCHA JO. 2003. Restoration of genetic diversity in the dry forest tree Swietenia macrophylla (Meliaceae) after pasture abandonment in Costa Rica. Mol Ecol 12: 3201-3212.
- CURRAT M, GERBAULT P, DI D, NUNES JM and SANCHEZ-MAZAS A. 2016. Forward-in-Time, Spatially Explicit Modeling Software to Simulate Genetic Lineages Under Selection. Evol Bioinformatics, p. 27-39.
- EXCOFFIER L, FOLL M and PETIT RJ. 2009. Genetic consequences of range expansions. Annual Rev Ecol Evol Syst 40: 481-501.
- EXCOFFIER L and RAY N. 2008. Surfing during population expansions promotes genetic revolutions and structuration. Trends Ecol Evol 23: 347-351.
- FAYARD J, KLEIN EK and LEFEVRE F. 2009. Long distance dispersal and the fate of a gene from the colonization front. J Evol Biol 22: 2171-2182.
- FORTIN MJ and DALE MRT. 2005. Spatial Analysis – A Guide for Ecologists Cambridge University Press.
- FRANKHAM R, BALLOU JD and BRISCOE DA. 2002. Introduction to Conservation Genetics. Cambridge University Press, Cambridge.
- GOODSMAN DW, COOKE B, COLTMAN DW and LEWIS MA. 2014. The genetic signature of rapid range expansions: How dispersal, growth and invasion speed impact heterozygosity and allele surfing. Theor Pop Biol 98: 1-10.
- GRACIÁ E, BOTELLA F, ANADÓN JD, EDELAAR P, HARRIS DJ and GIMÉNEZ A. 2013. Surfing in tortoises? Empirical signs of genetic structuring owing to range expansion. Biol Let 9: 20121091.
- GRALKA M, STIEWE F, FARRELL F, MÖBIUS W, WACLAW B and HALLATSCHEK O. 2016. Allele Surfing Promotes Microbial Adaptation from Standing Variation. Ecol Lett 19(8): 889-898.
- GUETA T, TEMPLETON AR and BAR-DAVID S. 2014. Development of genetic structure in a heterogeneous landscape over a short time frame: the reintroduced Asiatic wild ass. Conserv Genet 15: 1231-1242.
- HALLATSCHEK O, HERSEN P, RAMANATHAN S and NELSON DR. 2007. Genetic drift at expanding frontiers promotes gene segregation. Proc Natl Acad Sci 104: 19926-19930.
- HALLATSCHEK O and NELSON DR. 2008. Gene surfing in expanding populations. Theor Pop Biol 73: 158-170.
- HALLATSCHEK O and NELSON DR. 2009. Life at the front of an expanding population. Evolution 64: 193-206.
- HARTL DL and CLARK AG. 2010. Princípios de Genética de Populações. Quarta Edição. Art Med Editora: Porto Alegre.
- HUBBELL SP. 2001. The Unified Neutral Theory of Biodiversity and Biogeography. Princeton University Press: Princeton.
- KIMURA M. 1983. The neutral theory of molecular evolution. Cambridge University Press, Cambridge, England.
- KLOPFSTEIN S, CURRAT M and EXCOFFIER L. 2006. The fate of mutations surfing on the wave of a range expansion. Mol Biol Evol 23: 482-490.
- LANDE R. 1988. Genetics and demography in biological conservation. Science 41(4872): 1455-1460.
- MENDEL G. 1866. Versuche über Plflanzenhybriden. Verhandlungen des naturforschenden Vereines in Brünn, Bd. IV für das Jahr 1865. Abhandlungen, p. 3-47.
- METZGER JP. 2001. O que é ecologia de paisagens? Biota Neotrop 1(1): 1-9.
- MONA S, RAY N, ARENAS M and EXCOFFIER L. 2014. Genetic consequences of habitat fragmentation during a range expansion. Heredity 112: 291-299.
- MOREAU C, BHÉRER C, VÉZINA H, JOMPHE M, LABUDA D and EXCOFFIER L. 2011. Deep Human Genealogies Reveal a Selective Advantage to Be on an Expanding Wave Front. Science 334: 1148.
- PEISCHL S and EXCOFFIER L. 2015. Expansion load: recessive mutations and the role of standing genetic variation. Mol Ecol 24(9): 2084-2094.
- PEISCHL S, KIRKPATRICK M and EXCOFFIER L. 2015. Expansion load and the evolutionary dynamics of a species range. Am Nat 185(4): E81-E93.
- PHILLIPS BL. 2015. Evolutionary processes make invasion speed difficult to predict. Biol Inv 17: 1949-1960.
- PIERCE AA, ZALUCKI MP, BANGURA M, UDAWATTA M, KRONFORST MR, ALTIZER S, HAEGER JF and DE ROODE JC. 2014. Serial founder effects and genetic differentiation during worldwide range expansion of monarch butterflies. Proc R Soc B 281: 20142230.
- RAY N and EXCOFFIER L. 2009. Inferring past demography using spatially explicit population genetic models. Hum Biol 81: 141-157.
- RAY N and EXCOFFIER L. 2010. A first step towards inferring levels of long-distance dispersal during past expansions. Mol Ecol Resour 10: 902-914.
- RICKLEFS RE and BERMINGHAM E. 2002. The concept of the taxon cycle in biogeography. Global Ecol Biogeogr 11(5): 353-361.
- SLATKIN M and EXCOFFIER L. 2012. Serial founder effects during range expansion: a spatial analog of genetic drift. Genetics 191: 171-181.
- SOUZA V, PEISCHL S and EXCOFFIER L. 2014. Impact of range expansions on current human genomic diversity. Curr Opin Genet Dev 29: 22-30.
Publication Dates
-
Publication in this collection
25 Apr 2019 -
Date of issue
2019
History
-
Received
21 Feb 2018 -
Accepted
10 Sept 2018


