Abstract
Abstract: This study aimed to know the patterns of spatial distribution of Anastrepha spp. and establish a criterion for determining the appropriate time for pest control. For this, 90 McPhail traps were used as Sampling Units (SU) divided into three commercial orchards of Novo Milênio guava with a total area of 14 ha. Traps were interspersed between the rows of plants, systematically in the orchards, hung and baited with 5% hydrolyzed corn protein with weekly collections. We caught 8,170 Anastrepha spp. in 840 SU. The mean infestation index was compared to the three types of distribution: random, uniform, aggregate, and fit by the theoretical frequency distributions of Poisson, negative binomial and positive binomial. The populations of Anastrepha presented aggregate distribution according to the mean variance method (I), tested by distance from randomness. The economic damage risk potential of Anastrepha spp. was associated with the aggregate distribution behavior. The most appropriate moment for the use of control techniques is when reaching 20 flies by the negative binomial. On the other hand, number of fruit fly adults per trap per day (FTD), underestimates population index, which will allow population growth, leading to risk of crop production loss.
Key words
index of aggregation; negative binomial; McPhail trap; fruit pests
INTRODUCTION
Approximately 70 species of fruit flies (Diptera: Tephritidae) are considered important agricultural pests, these tephritids are mainly found in fruit crops including oranges, mangoes, apples and peaches, and fall into four genera: Anastrepha Schiner, Bactrocera Macquart, Ceratitis MacLeay, and Dacus Fabricus (GarciaGARCIA FRM, BRIDA AL, MARTINS LN, ABEIJON LM and LUTINSKI CJ. 2017. Biological Control of Fruit Flies of the Genus Anastrepha (Diptera: Tephritidae): Current Status and Perspectives. In: Lewis Davenport (Ed), Biological Control: Methods, Applications and Challenges. 1st ed., Hauppauge. Nova Science Publishers 1: 29-71. et al. 2017). Fruit flies cause losses in world fruit production from US$ 120 million to US$ 200 million per year (FelixFelix CS, Uchoa MAF and Facenda O. 2009. Capture of Anastrepha sororcula (Diptera: Tephritidae) in McPhail and Jackson traps with food attractant and virgin adults. Braz Arch Biol Technol 52: 99-104. et al. 2009). In the Brazilian territory, these insects cause direct damages of approximately 10% of the production and more than US$ 30.8 million in the expenses with the eradication actions in the first year of control and of 92.4 million in three subsequent years (Silva et al. 2011Silva LN, Santos MS, Dutra VS, Araujo EL, Costa MA and SILVA JG. 2011. First survey of fruit fly (Diptera: Tephritidae) and parasitoid diversity among Myrtaceae fruit across the state of Bahia, Brazil. Rev Bras Frut 33: 757-764.).
The knowledge about the spatial distribution of insects provides a basis to define a strategy for the management of populations of these groups considered as pests (Giles et al. 2000Giles KL, Royer TA, Elliot NC and Kindler SD. 2000. Development and validation of a binomial sequential sampling plan for the greenbug (Homoptera: Aphididae) infesting winter wheat in the southern plains. J Econ Entomol 93: 1522-1530., Park and Tollefson 2006PARK YL and TOLLEFSON JJ. 2006. Spatial distributions of corn rootworm (Coleoptera: Chrysomelidae) eggs and larvae: implications for sampling. J Kansas Entomol Soc 79: 129-135.). Studies that evaluate the population distribution of fruit flies, based on the numerical frequency of trapped adults, may be useful to understand the real biotic potential of pest species. In addition, this information can help producers in decision making of population control on a more sustainable basis, minimizing the intentions of agrochemical applications in fruits. Thus, optimizing and efficient techniques for monitoring fruit flies are valuable and necessary tools in the context of Integrated Pest Management (IPM) in Brazilian fruit growing.
The theoretical frequency distribution method can be used for several groups of insects, mainly for phytophagous groups (BinnsBinns MR, Nyrop JP and Van Der Werf W. 2006. Sampling and Monitoring in Crop Protection: The Theoretical basis for developing practical decision guides. CABI Publishing, New York, 284 p. et al. 2006). When the information generated by the distribution methods is used in sampling design, they can better clarify to the producer the true population index of the species with the potential for damages, being considered pest or not. Combined with a sampling design, it improves the reliability level in monitoring and decision-making capacity for population control of the insect (Ruesink 1980Ruesink WG. 1980. Introduction to sampling theory. In: Kogan M and Herzog DG (Eds), Sampling Methods in Soybean Entomology. Springer, New York, p. 61-78., TaylorTaylor LR. 1984. Assessing and Interpreting the Spatial Distributions of Insect Populations. Ann Rev Entomol 29: 321–357. 1984). However, when monitoring is not defined by a well-established sampling plan, a sample size of more than 30 sampling units (SU) is required, which implies a higher execution cost. Currently, the number of fruit flies captured per traps/days (FTD), as proposed by Salas and Chavez (1981)Salas JAS and Chavez JEP. 1981. Fluctuacion poblacional de la mosca mexicana de la fruta Anastrepha ludens (Loew) en General Teran y Montemorelos, Nuevo Leon. Agricultura Técnica en México 7: 65-75., is the most used method for monitoring the population index of fruit flies in fruit orchards in Brazil, according to regulation (MAPA 2006MAPA - MINISTÉRIO DA AGRICULTURA, PECUÁRIA E ABASTECIMENTO. 2006. Instruções normativas nºs 16 e 13 de 5 e 31 de março. Secretaria de Defesa Agropecuária, do Ministério da Agricultura, Pecuária e Abastecimento.). The FTD index is also widely used as a level of action for the control of fruit fly populations in South America, although this method does not demonstrate the influence of the fly developmental stage at the time of capture. The FTD index below 0.5 does not include the types of theoretical frequency distribution, which express the damage potential of the fly.
One of the fruits most preferred by fruit flies is guava (Psidium guajava L.). It is probably one of the most common and economically important fruit trees in the tropical and subtropical regions of the world (Seth 2003SETH MK. 2003. Trees and their economic importance. Bot Rev 69: 321-376.). In Brazil, guava tree distribution and grown on a commercial scale in practically all regions and its production represents about 2% of the total of all species of fruit grown in Brazil (IBGE 2014IBGE - INSTITUTO BRASILEIRO DE GEOGRAFIA E ESTATÍSTICA. 2014. Produção Agrícola Municipal: Culturas temporárias e permanentes. Rio de Janeiro, p. 1-100.). As with other fruits, fruit flies have been one of the major limiting factors for guava production (Silva et al. 2011, TairaTaira TL, Abot AR, Nicácio J, UchOa MA, Rodrigues SR and GUIMARÃES JA. 2013. Fruit flies (Diptera: Tephritidae) and their parasitoids on cultivated and wild hosts in the Cerrado-Pantanal ecotone in Mato Grosso do Sul, Brazil. Rev Bras Entomol 57: 300–308. et al. 2013, Querino et al. 2014Querino RS, Maia JB, Lopes GN, Alvarenga CD and ZUCHI RA. 2014. Fruit fly (Diptera, Tephritidae) community in guava orchards and adjacent fragments of native vegetation in Brazil. Fla Entomol 97: 778-786.). However, in Brazil, studies on the methods of evaluation of the spatial distribution of fruit flies in guava orchards by the theoretical frequency distribution method have not been reported.
Thus, the goal of this research was to evaluate different methods of spatial distribution of fruit flies in orchards of Psidium guajava L., in order to define the best moment for the population control of these flies.
MATERIALS AND METHODS
STUDY SITES
The study was carried out with Anastrepha spp. flies in Ivinhema, State of Mato Grosso do Sul, Brazil (22º18’17” S, 53º48’55” W). The climate of the region, according to the Köppen classification, is humid temperate, with hot rainy summers and dry winters (AlvaresAlvares CA, Stape JL, Sentelhas PC, Goncalves JLM and GSparovek g. 2014. Köppen’s climate classification map for Brazil. Meteorol Z 22: 711-728. et al. 2014). The months of June and July have the lowest temperatures (<18°C) and January, the highest temperatures (> 22°C).
The distance between the orchards ranged from 1 to 5 km. In the orchard 1, at the Santa Luzia Farm (22°17’10’’S/ 53° 56’46’’W), the plants were 4 years old and cultivated in 1 ha at an altitude of 420 m, in the São José Farm (22°16’ 18’’ S / 53°54’ 58’’ W), 6-year-old guava trees were cultivated on three hectares at an altitude of 397 m, and in orchard 3, at the same São José Farm (22º 15’59’’S / 53º 54’01’’ W), three-year-old guava trees were grown on five hectares at an altitude of 409 m.
Throughout the study, conventional management techniques of guava production (i.e., application of pesticides, pruning, brushing, and organic and chemical fertilization) were employed in all orchards. In orchard 1, pesticides were applied after 10 weeks. In orchards 2 and 3, the beginning of the collections coincided with the application of insecticide until the 11st week and prunings were random.
SAMPLING
Data were collected according to the design in Figure 1. The traps were systematically distributed (as designed) and installed in the trees (Novo milênio), throughout the period of collection and exchange of baits. The total collection was 690 sampling units (SU) per orchard in 23 weeks, totaling 2070 SUs.

Commercial guava orchard at three sites, the numbers within of the frames correspond to the sample units (guavas feet) with McPhail traps in the municipality of Ivinhema, Mato Grosso do Sul, between August 2013 and January 2014.
Insects were sampled with McPhail traps with 250 mL of 5 % hydrolyzed corn protein, installed at about 1.50 m from the ground level in the plant branches. The bait was renewed weekly and the captured flies were collected in glass jars. Sampling occurred between August 2013 and January 2014, totaling 23 consecutive weeks per orchard. In each of the three orchards, were installed 30 McPhail traps. A trap is installed in each row, at random, in the orchards, corresponding to 30 points evaluated per orchard.
The separation of the traps installed was determined by the rows of guava trees, not being drawn. The spacing between trees was 7m and between rows and 5m between plants. Thus, each trap was considered as a sampling unit (n = 30). The total sampling time was 23 (weeks) totaling 69 weeks (samples). The captured fruit flies were kept in 92.8% alcohol, sorted and dried on absorbent paper for identification.
The fruit fly specimens of the genus Anastrepha Schiner were sexed and identified using the identification keys of Steyskal (1977)STEYSKAL GC. 1977. Pictorial key to species of the genus Anastrepha (Diptera: Tephritidae). Washington: The Entomological Society of Washington, 35 p. and Zucchi (2000)ZUCCHI RA. 2000. Taxonomia. In: Malavasi A and Zucchi RA (Eds), Moscas-das-frutas de importância econômica no Brasil: Conhecimento básico e aplicado. Ribeirão Preto: Holos Editora, p.13-24..
DATA ANALYSIS
Non-parametric Kruskal-Wallis and Dunn-Bonferroni bilateral tests were applied to evaluate differences in mean abundance and fluctuation of the cumulative number of individuals of Anastrepha species between the three sampling sites (orchards). The frequency of the number of flies caught in each week in the three orchards, during the 23 weeks of evaluation, totaled 69 samples, being n = 1440 (traps). The total of samples (69) was subjected to the models of spatial arrangement of the individuals of the fruit fly population, collected in the traps for the evaluation of aggregation distribution pattern. These types of arrangement models were determined by the dispersion indices (mean-variance ratio, Morisita index and K parameter of the negative binomial) with distance from randomness by the chi-square test (χ2) (AmaralAMARAL MK, PELLICO NETTO S, LIGNAU C and FIGUEIREDO FILHO AA. 2015. Evaluation of Morisita Index V for determination of the spatial distribution of species in a fragmente os Araucaria Forest. Appl Ecol Env Res 13(2): 361-372 et al. 2015).
The distribution of the flies was classified as random, negative binomial (NB) = “aggregate”, and positive binomial (PB) = “Uniform”, comparison with number of flies per number of traps x days by using the Poisson distribution models, compared to the FTD index. This was set at 0.5 in a total of 30 traps exposed in the orchard for seven days resulting in an FTD of 105 individuals , where: FTD = number of traps per day, NF = number of flies, NT = number of traps and ND = number of days in which the traps were exposed. It was also set a threshold > 20 individuals as hypothesis of acceptance of the aggregate distribution of fruit flies, obtained from the result of the negative binomial model.
It was also investigated the fit of the frequency data obtained in the field to the methods of theoretical frequency distributions (negative binomial, positive binomial and Poisson) using chi-square (χ2) adherence test (YoungYoung LJ and YOUNG JH. 1998.Statistical ecology: a population perspective. Kluwer Academic Publishers, Boston, USA. and Young 1998). Levels of safety (H0) (p <0.01) and level of action (H1) were defined with accuracy greater than (p> 0.2).
Taylor’s power law (Taylor 1961Taylor LR. 1961. Aggregation, variance to the mean. Nature 189: 732-735.) is another model employed, which describes the relationship between the variance (S2) and the mean () by means of an exponential function: , where: α and β are the parameters. This relationship can be described according to the linear equation: , where S2 is the population variance, is the population mean, a is the intersection of the variance, and b is the slope of the regression line. This slope is the index indicating the type of distribution of Anastrepha spp. in the orchards. If b = 1 indicates random dispersion model, b> 1 indicates aggregate dispersion model, and b <1 indicates uniform dispersion model. The population size of the fruit fly population is given by the intersection (a) with the axis of the variance. This parameter refers to the mean number of individuals captured in the same sampling unit (i.e., the same trap), which is called the basic contagion index of the individual. When α = 0, the basic component is the individual, α < 0 indicates indicates the movement of individuals separated from each other and α > 0 suggests that the basic element is the population of fruit flies. Student’s t-test (p <0.05) with N-2 degrees of freedom was used to verify if the β parameter was significantly different from 1 and a ≠ 0.
RESULTS
OCCURRENCE AND POPULATION FLUCTUATION OF FRUIT FLIES
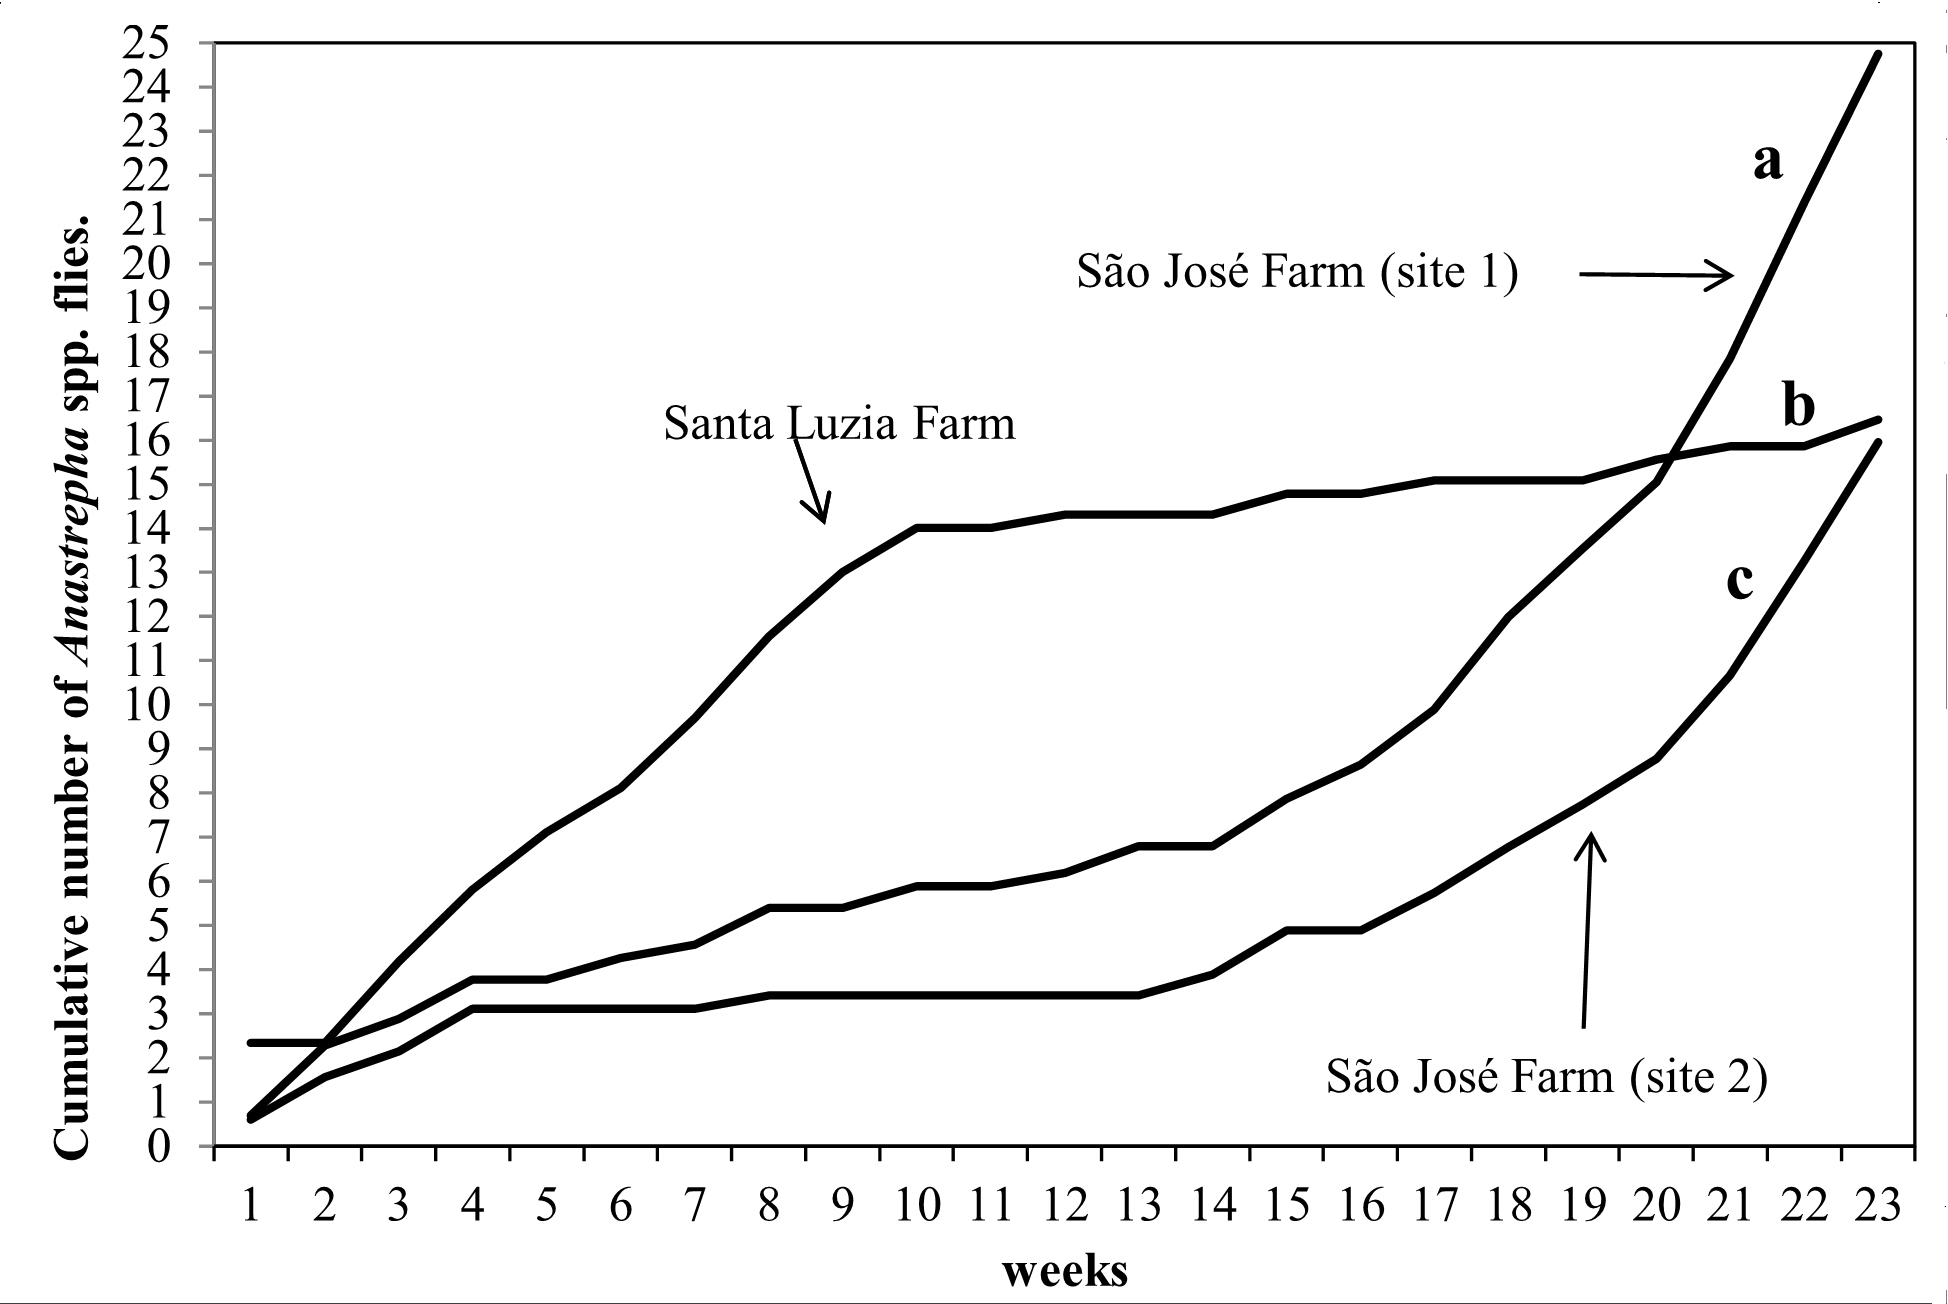
During the sampling, 8,170 individuals were caught (Tables I and II). The mean abundance was different between the species of fruit flies (χ² = 1,191.95, df = 10, p <0.05). Anastrepha sororcula Zucchi was the most abundant species (Table II). The cumulative number of fruit flies was significantly different between the three orchards (χ2 = 34.75, df = 2, p <0.001). Orchard 2 presented the highest cumulative number of individuals, followed by orchards 1 and 3 (Fig. 2).
Infestation by Anastrepha spp. caught in McPhail traps, aggregation indices, test of fit of the data to the distribution in the three orchards during 23 weeks in the region of Ivinhema, State of Mato Grosso do Sul, Brazil from August 2013 to January 2014.
Multiple comparison between adults of pest species of Anastrepha spp. (Diptera: Tephritidae) in guava orchards, Ivinhema, State of Mato Grosso do Sul (August 2013 to January 2014).

Population fluctuation of fruit flies in three guava orchards (cultivar Novo Milênio) between August 2013 and January 2014 (Ivinhema, State of Mato Grosso do Sul, Brazil). Multiple comparisons were made by Dunn-Bonferroni bilateral test (p <0.01), where the same letters indicate non-significant differences.
PATTERNS OF SPATIAL DISTRIBUTION OF FRUIT FLIES
Twenty adults of fruit flies composed the threshold for the aggregation behavior of Anastrepha. The mean variance dispersion index (I) and the negative binomial distribution adherence test (NB) presented concordant results in 82% of the cases (Table I). Only two samples were below the threshold of 20 adults of Anastrepha, indicating non-aggregate behavior. For samples above the threshold, the concordance was 100%. The K factor index of negative binomial was intermediate at 46% and Morisita did not represent a safe model to determine the potential of Anastrepha as a pest, being divided between random and aggregate with 6.5% for both spatial distribution patterns. The spraying produced a zero-captured individual effect, mainly in the first two weeks and from 1 to 3 flies in the following two weeks. The duration of this effect lasted 30 days following the management. Pruning also contributed to the reduction in the number of flies until the plants reached approximately half of biomass when they did not present fruits. The distribution behavior presented by the flies had low indices, adhering to the type of random distribution influenced by the type of spraying or pruning management, or together (Table I).
The aggregate distribution occurred significantly above the threshold of 20 adults (except for samples 15 and 18, which adhered to the uniform distribution (Fig. 3). Samples 12, 13, 17, 18, 19, 20 and 21 did not adhere to the FTD index, totaling 22 samples, within the threshold of 20 flies, established by the negative binomial. This represents more than 71% of the cases, in which FTD was below the level of action of NB that guides decision making to control fruit flies (Fig 2).

Range of the negative binomial (NB) thresholds and number of fruit flies per trap/day establishing the levels of population equilibrium and control in three guava orchards (Novo Milênio cultivar) between August 2013 and January 2014 (Ivinhema, State of Mato Grosso do Sul, Brazil).
Monitoring methods
Of the total samples, 22 were sufficient to determine the thresholds set by NB and the FTD index for the decision-making of the safety level and control action for the pest species. The first 11 samples were below 20 individuals, representing 92% adherence to the random distribution (Poisson) (Fig. 2).
The Anastrepha species adhered to the random distribution behavior (Poisson), when the FTD index corresponded to less than 0.01. However, with FTD above 0.01, the shape of the indices of the mean variance and the factor K were aggregated. However, with FTD above 0.01, the shape of the mean variance and factor K indices were aggregated. The mean index of variance was the most adequate to evaluate the spatial distribution pattern of Anastrepha species in guava orchards (Table III).
Aggregation index of adults of pest species of Anastrepha spp. (Diptera: Tephritidae) in guava orchards, Ivinhema, State of Mato Grosso do Sul (August 2013 to January 2014).
The parameter b of Taylor’s power law was significant, adhering to the aggregate distribution for the adult phase of almost all species of Anastrepha which has guava as the primary host (Table IV). Anastrepha species, considered as pests, only adhered to the aggregation index in a random way in a low number of individuals. However, when the number reached more than 20 specimens of flies obtained, they adhered to the aggregate distribution (Table III).
Taylor parameter estimates and regression analysis evaluating the distribution of adults of Anastrepha (Diptera: Tephritidae) species in Novo Millennium guava orchards for 23 weeks in the municipality of Ivinhema, State of Mato Grosso do Sul, Brazil (August 2013 to January 2014).
Taylor Power
The equation adjusted by the Taylor method for each of the species: A. fraterculus, A. sororcula, A. obliqua, A. striata and A. montei, was: y = a + bX. The Taylor power law regression model, of the log of variance by log of the mean for the species of Anastrepha cited, that is, b> 1, is significant by ANOVA (F-test, p <0.001, df = 26) and the adjusted coefficient of determination, R2 > 92. The aggregation index (b) was significantly higher than 1 by Student’s t-test (t, p <0.001), which means that for each unit increased in the log of the mean, we have an increase in the log of variance of b, confirming aggregate distribution for these species. The value of the intercept was -a, significantly lower than zero (t, p <0.001), indicating the separation among individuals of the Anastrepha population at the time of evaluation (Table IV).
DISCUSSION
In this study, it was demonstrated the importance of using the theoretical frequency distribution method for Anastrepha species aimed at their monitoring. This is important because proper monitoring can prevent this group of insects from reaching the level of economic damage. Where all the labor and material used in the crop and converted into currency value comprises, from the total cost, a return of approximately less than 15%. In other cultures, this level of loss is generally set at 10%. This technique can be equated to any evaluation test that needs to be met by the assumptions of normality, homogeneity and collinearity of the data (ValentinValentin JL. 2012. Ecologia numérica: Uma introdução à análise multivariada de dados ecológicos. Editora Interferência, Rio de Janeiro, Brazil, p. 1-154. 2012).
OCCURRENCE AND PATTERNS OF SPATIAL DISTRIBUTION.
A. sororcula was the most abundant species in this study. This species is frequently dominant in fruit fly surveys in Brazil, being considered the main pest species that attacks guava trees in Mato Grosso do Sul (UchoaUchOa MA and NICÁCIO J. 2010. New records of Neotropical fruit flies (Tephritidae), lance flies (Lonchaeidae) (Diptera: Tephritoidea), and their host lants in the South Pantanal and adjacent areas, Brazil. Ann Entomol Soc Am 103: 723-733. and Nicácio 2010).
Of the 11 species obtained in this research, four: A. alveatoides, A. leptozona, A. montei and A. daciformis, accounting for 36.4%, do not have P. guajava as host (ZucchiZUCCHI RA. 2008. Fruit flies in Brazil - Anastrepha species their host plants and parasitoids. Available at: www.lea.esalq.usp.br/anastrepha/. Accessed on July 25, 2017.
www.lea.esalq.usp.br/anastrepha/....
2008).
The condition of the infestation potential of these flies to the level of possible cause of economic damage in the guava orchard adhered to the type of aggregate distribution. During the collection period in which the orchard was used with the use of spray and / or pruning management, the shape of the distribution composition of the Anastrepha population occurred randomly. The condition of the infestation potential at the level of possible cause of economic loss in guava orchards considered in the type of aggregate distribution was not adhered with the use of these managements. Because all the period considered with these practices presented the composition of the population index of this group of flies adhered to the random distribution (Table I). It can be inferred that the reestablishment of the population index of these flies at the level of possible damages verified by the aggregate distribution. It may have occurred, in addition, by the presence of other host plants in the surrounding areas. This may also have influenced the population fluctuation of this group of flies, since the fruit flies colonize native plants as reservoirs host (Taira et al. 2013, Garcia and Norrbom 2011GARCIA FRM and NORRBOM AL. 2011. Tephritoid flies (Diptera, Tephritoidea) and their plant hosts from the state of Santa Catarina in southern Brazil. Fla Entomol 94: 151-157., DuarteDUARTE PAS, ANDALÓ V and GARCIA FRM. 2016. Faunal analysis and population density of fruit flies (Diptera: Tephritidae) in an orchard located in the central western region of Minas Gerais, Brazil. Bioscience Journal 32: 960-968. et al. 2016).
The low number of adults of Anastrepha spp. trapped in McPhail traps was not sufficient to validate the distance from the randomness of the mean variance index (I). However, this index (I) and the Negative Binomial distribution (NB) presented significantly aggregate results as the number of Anastrepha adults increased in the samplings. The mean variance (I) was the aggregation index that adhered significantly to the fit of the NB distribution data. This theoretical frequency distribution was the one that best validated the aggregate distribution for the species of Anastrepha in the orchards. The number of Anastrepha adults in the sample to adhere to this NB distribution pattern is from 20 individuals, with standardization of the number of traps since the onset of monitoring (Table I).
MONITORING METHODS
The homogeneity between the central and dispersion measures responded to the effect of the efficiency of the NB model. This indicates that the number of sampling units in the experiment was adequate for calculations of numerical frequency, accepting the aggregate distribution pattern for 95% of the populations of Anastrepha spp. (Table I).
In the comparison of the aggregate distribution with the FTD index, it was verified that this method had 456 flies beyond the equilibrium interval (safety level), 343% higher than NB. With this, it was observed that the FTD method underestimates the damage potential of this group of pests. When FTD reached the recommended index as action level (0.5 fly/trap/day), the population was already growing exponentially, meaning that it had already reached the level of economic loss (Fig. 3). Therefore, the FTD index used as reference at levels above 0.1 favors the increase of Anastrepha populations and, as a consequence, there is a greater possibility of these colonizing other hosts that could function as reservoirs of the polyphagous species. An inappropriate management that favors this situation can have as consequence the resurgence of the pest, its secondary explosion, besides provoking resistance and tolerance to the biocides in the next generations of pest species (GarciaGARCIA FRM. 2014. Zoologia Agrícola: manejo ecológico de pragas. 4ª ed., Porto Alegre: Editora Rígel, 256 p . 2014).
The use of the NB distribution would prevent approximately 6,200 adults of Anastrepha spp. continue in the orchards in the next generation. Considering the total number of flies caught in the traps (n = 8,170) and that the sex ratio of most Anastrepha species is 1: 1, which would result in 4,085 females. Each Anastrepha female lays an average of 300 eggs, with viability of 80%, 16% of larvae reach the pupal stage and about 4% become adults (Zart et al. 2010Zart M, Fernandes O and BOTTON M. 2010, Biology and fertility life table of the South American fruit fly Anastrepha fraterculus on grape. Bull Insectol 63: 237-242., BisogninBisognin M, Nava DE, Lisbôa H, Bisognin AZ, Garcia MS, Valgas RA, Diez Rodriguez GI, Botton M and Antunes LEC. 2013. Biologia da moscadasfrutas sulamericana em frutos de mirtilo, amoreirapreta, araçazeiro e pitangueira. Pesq Agrop Bras 48: 141-147. et al. 2013).
Efficiency in decision making using the NB model proposed here is associated with the fact that the samples reflect the increase of individuals indirectly representing the potential of the pest, even in the immature stages (Fig. 3). This demonstrates the ability of NB to indicate the potential damage of fruit flies, compared to the FTD index, avoiding production losses. While, by the NB model, the maximum number of flies from which it would be necessary to recommend control measures was 20 adults of Anastrepha spp. per sample. However, using the FTD index, decision-making for control would only be recommended after the capture of 105 adults of Anastrepha spp. per sample (Table II). Therefore, it will be a great loss for fruit growers who opt for monitoring fruit flies using the FTD index, instead of using the aggregation index by the NB model proposed here.
The Taylor power law regression can also be used to evaluate the spatial distribution of fruit flies. Nevertheess, its use has limitations, and is only recommended when opting for a general view, without interest in the effects of seasonality or temporality. The fact that the species have aggregate behavior in the adult phase is because the previous stages (egg, larva and pupa) were not susceptible to the conditions of control and to the biotic and abiotic conditions. This is justified by the fact that these phases are endophytic (Table III). This is because these stages are endophytics (Table III). This behavior of aggregation of Anastrepha species favors their life cycle and indicates the adequate biotic potential of these flies to reach pest status (Table III). Another fact observed using the Taylor power law regression model is that in the group of Anastrepha species some may be a pest for a particular species of fruit, and not considered a key pest for another fruit (Table III).
Estimates of Taylor power law parameters for counting the number of individuals of fruit fly species can also be employed, since the F-test was significant for the number of adults of the species important for guava orchards. And the parameter b of Taylor power law compared by the t-test, being significant for b> 1 by, adhering to the aggregate distribution at the adult stage for almost all species that has guava as the primary host. This is due to the fact that the adult stage tends to aggregate distribution, favoring their mating behavior, and possible dominance over the food resource, mainly in relation to other flies of the species of Neosilba (Lonchaeidae), both endophytics. On the other hand, the parameter a <0 reinforces the condition of separation between the individuals of the population of Anastrepha, possibly due to the behavior of oviposition marking and host diversity, besides abiotic factors (Araujo et al. 2013Araújo EL, Ribeiro JC, Chagas MCM, Dutra VS and Silva JG. 2013. Moscas das frutas (Diptera: Tephritidae) em um pomar de goiabeira, no semiárido brasileiro. Rev Bras Frut 35: 471-476.), leading to a decrease in intraspecific competition (Table IV).
CONCLUSIONS
The distribution of Anastrepha spp. populations was aggregate, adhering to the negative binomial model.
The NB model allowed to establish the moment of action of control with highly reliable probability that it has at least one species of Anastrepha presenting risk of damage to the guava orchard.
The FTD index at 0.1 is suggested as the standard for action levels in guava tree fruit fly control compared to the negative binomial, whose threshold for the control decision was set at 20.
ACKNOWLEGMENTS
We thank Universidade Federal da Grande Dourados (UFGD) for the resources made available for the support in the field work; Conselho Nacional de Desevolvimento Científico e Tecnológico (CNPq) by the grant (Process: 305112/2012-0) based on research productivity to M.A. Uchoa; Fundação de Apoio ao Desenvolvimento do Ensino, Ciência e Tecnologia do Estado de Mato Grosso do Sul (FUNDECT) and Coordenação de Aperfeiçoamento de Pessoal de Nível Superior (CAPES), Edital Chamada FUNDECT-CAPES No. 44/2014 PAPOS-MS, by the financial support and CNPq for Research Productivity Grant to FRMG.
REFERENCES
- Alvares CA, Stape JL, Sentelhas PC, Goncalves JLM and GSparovek g. 2014. Köppen’s climate classification map for Brazil. Meteorol Z 22: 711-728.
- AMARAL MK, PELLICO NETTO S, LIGNAU C and FIGUEIREDO FILHO AA. 2015. Evaluation of Morisita Index V for determination of the spatial distribution of species in a fragmente os Araucaria Forest. Appl Ecol Env Res 13(2): 361-372
- Araújo EL, Ribeiro JC, Chagas MCM, Dutra VS and Silva JG. 2013. Moscas das frutas (Diptera: Tephritidae) em um pomar de goiabeira, no semiárido brasileiro. Rev Bras Frut 35: 471-476.
- Binns MR, Nyrop JP and Van Der Werf W. 2006. Sampling and Monitoring in Crop Protection: The Theoretical basis for developing practical decision guides. CABI Publishing, New York, 284 p.
- Bisognin M, Nava DE, Lisbôa H, Bisognin AZ, Garcia MS, Valgas RA, Diez Rodriguez GI, Botton M and Antunes LEC. 2013. Biologia da moscadasfrutas sulamericana em frutos de mirtilo, amoreirapreta, araçazeiro e pitangueira. Pesq Agrop Bras 48: 141-147.
- DUARTE PAS, ANDALÓ V and GARCIA FRM. 2016. Faunal analysis and population density of fruit flies (Diptera: Tephritidae) in an orchard located in the central western region of Minas Gerais, Brazil. Bioscience Journal 32: 960-968.
- DUARTE PAS, GARCIA FRM and ANDALÓ V. 2015. Anastrepha aczeli Blanchard and Anastrepha similis Greene (Diptera: Tephritidae) in Minas Gerais, Brazil. Cienc Rural 45: 1727-1728.
- Felix CS, Uchoa MAF and Facenda O. 2009. Capture of Anastrepha sororcula (Diptera: Tephritidae) in McPhail and Jackson traps with food attractant and virgin adults. Braz Arch Biol Technol 52: 99-104.
- GARCIA FRM. 2014. Zoologia Agrícola: manejo ecológico de pragas. 4ª ed., Porto Alegre: Editora Rígel, 256 p .
- GARCIA FRM, BRIDA AL, MARTINS LN, ABEIJON LM and LUTINSKI CJ. 2017. Biological Control of Fruit Flies of the Genus Anastrepha (Diptera: Tephritidae): Current Status and Perspectives. In: Lewis Davenport (Ed), Biological Control: Methods, Applications and Challenges. 1st ed., Hauppauge. Nova Science Publishers 1: 29-71.
- GARCIA FRM and NORRBOM AL. 2011. Tephritoid flies (Diptera, Tephritoidea) and their plant hosts from the state of Santa Catarina in southern Brazil. Fla Entomol 94: 151-157.
- Giles KL, Royer TA, Elliot NC and Kindler SD. 2000. Development and validation of a binomial sequential sampling plan for the greenbug (Homoptera: Aphididae) infesting winter wheat in the southern plains. J Econ Entomol 93: 1522-1530.
- IBGE - INSTITUTO BRASILEIRO DE GEOGRAFIA E ESTATÍSTICA. 2014. Produção Agrícola Municipal: Culturas temporárias e permanentes. Rio de Janeiro, p. 1-100.
- MAPA - MINISTÉRIO DA AGRICULTURA, PECUÁRIA E ABASTECIMENTO. 2006. Instruções normativas nºs 16 e 13 de 5 e 31 de março. Secretaria de Defesa Agropecuária, do Ministério da Agricultura, Pecuária e Abastecimento.
- Marsaro Junior AL, Deus EG, Ronchi-Teles B, Adaime R and SILVA JUNIOR RJ. 2013. Species of Anastrepha (Diptera: Tephritidae) captured in a guava orchad (Psidium guajava L., Myrtaceae) in Boa Vista, Roraima, Brazil. Braz J Biol 73: 1-8.
- NORRBOM AL and UCHOA MA. 2011. New species and records of Anastrepha (Diptera: Tephritidae) from Brazil. Zootaxa 2835: 61-67.
- PARK YL and TOLLEFSON JJ. 2006. Spatial distributions of corn rootworm (Coleoptera: Chrysomelidae) eggs and larvae: implications for sampling. J Kansas Entomol Soc 79: 129-135.
- Querino RS, Maia JB, Lopes GN, Alvarenga CD and ZUCHI RA. 2014. Fruit fly (Diptera, Tephritidae) community in guava orchards and adjacent fragments of native vegetation in Brazil. Fla Entomol 97: 778-786.
- Ruesink WG. 1980. Introduction to sampling theory. In: Kogan M and Herzog DG (Eds), Sampling Methods in Soybean Entomology. Springer, New York, p. 61-78.
- Salas JAS and Chavez JEP. 1981. Fluctuacion poblacional de la mosca mexicana de la fruta Anastrepha ludens (Loew) en General Teran y Montemorelos, Nuevo Leon. Agricultura Técnica en México 7: 65-75.
- SETH MK. 2003. Trees and their economic importance. Bot Rev 69: 321-376.
- Silva LN, Santos MS, Dutra VS, Araujo EL, Costa MA and SILVA JG. 2011. First survey of fruit fly (Diptera: Tephritidae) and parasitoid diversity among Myrtaceae fruit across the state of Bahia, Brazil. Rev Bras Frut 33: 757-764.
- STEYSKAL GC. 1977. Pictorial key to species of the genus Anastrepha (Diptera: Tephritidae). Washington: The Entomological Society of Washington, 35 p.
- Taira TL, Abot AR, Nicácio J, UchOa MA, Rodrigues SR and GUIMARÃES JA. 2013. Fruit flies (Diptera: Tephritidae) and their parasitoids on cultivated and wild hosts in the Cerrado-Pantanal ecotone in Mato Grosso do Sul, Brazil. Rev Bras Entomol 57: 300–308.
- Taylor LR. 1961. Aggregation, variance to the mean. Nature 189: 732-735.
- Taylor LR. 1984. Assessing and Interpreting the Spatial Distributions of Insect Populations. Ann Rev Entomol 29: 321–357.
- UchOa MA and NICÁCIO J. 2010. New records of Neotropical fruit flies (Tephritidae), lance flies (Lonchaeidae) (Diptera: Tephritoidea), and their host lants in the South Pantanal and adjacent areas, Brazil. Ann Entomol Soc Am 103: 723-733.
- Valentin JL. 2012. Ecologia numérica: Uma introdução à análise multivariada de dados ecológicos. Editora Interferência, Rio de Janeiro, Brazil, p. 1-154.
- Young LJ and YOUNG JH. 1998.Statistical ecology: a population perspective. Kluwer Academic Publishers, Boston, USA.
- Zart M, Fernandes O and BOTTON M. 2010, Biology and fertility life table of the South American fruit fly Anastrepha fraterculus on grape. Bull Insectol 63: 237-242.
- ZUCCHI RA. 2000. Taxonomia. In: Malavasi A and Zucchi RA (Eds), Moscas-das-frutas de importância econômica no Brasil: Conhecimento básico e aplicado. Ribeirão Preto: Holos Editora, p.13-24.
- ZUCCHI RA. 2008. Fruit flies in Brazil - Anastrepha species their host plants and parasitoids. Available at: www.lea.esalq.usp.br/anastrepha/. Accessed on July 25, 2017.
» www.lea.esalq.usp.br/anastrepha/.
Publication Dates
-
Publication in this collection
12 Aug 2019 -
Date of issue
2019
History
-
Received
30 Apr 2018 -
Accepted
15 Oct 2018