Abstract
The lowlands of mid-latitude South America comprise complex temperate ecoregions characterized by a unique biodiversity. However, the processes responsible for shaping its species diversity are still largely unknown. Turnera sidoides subsp. carnea is a variable subspecies occurring in the lowlands of northeastern Argentina and Uruguay, extending to southern Paraguay and Brazil. It constitutes a good model to perform evolutionary studies. Here we used an integrative approach to understand the process of diversification within this subspecies and to increase the knowledge concerning patterns and processes responsible for shaping the species diversity in the temperate lowlands of South America. The results provided strong evidences that this subspecies is an autopolyploid complex per se, being in an active process of intrasubspecific diversification. Morphological and genetic data show that the diversity of T. sidoides subsp. carnea is in congruence with the great past and present abiotic and biotic variability of the mid-latitude South American lowlands. The evolutionary history of this subspecies is consistent with past fragmentation and allopatric differentiation at diploid level. Geographic isolation and local adaptation would have promoted strong morphological, ecological, and genetic differentiation, resulting in two morphotypes and different genetic groups indicative of incipient speciation.
Key words
biodiversity; ecological niche modeling; genetic diversity; morphotypes; South American lowlands; Turnera sidoides subsp
INTRODUCTION
South America is composed of different biogeographical regions (Morrone 2000MORRONE JJ. 2000. What is the Chacoan Region? Neotropica 46: 51-68., 2006) and harbors the highest biodiversity in the world (Myers et al. 2000Myers N, Mittermeier RA, Mittermeier CG, da Fonseca GAB & Kent J. 2000. Biodiversity Hotspots for Conservation Priorities. Nature 403: 853-858.). Its evolutionary history was linked to a succession of climate changes and major geological events from Miocene onwards that have modified both the continent and oceans (Clapperton 1993Clapperton CM. 1993. Nature of environmental changes in South America at the Last Glacial Maximum. Palaeogeogr, Palaeoclimatol, Palaeoecol 101: 189-208., Iriondo 1993Iriondo M. 1993. Geomorphology and late Quaternary of the Chaco (South America). Geomorphology 7: 289-303., 1999Iriondo M. 1999. Climatic changes in the South American plains: records of a continent-scale oscillation. Quatern Int 57-58: 93-112., Graham 2009Graham A. 2009. The Andes: a geological overview from a biological perspective. Ann Missouri Bot Gard 96: 371-385., Aragon et al. 2011Aragon E, Goin FJ, Aguilera YE, Woodburne MO, Carlini AA & ROGGIERO MF. 2011. Palaeogeography and palaeoenvironments of northern Patagonia from the Late Cretaceous to the Miocene: the Palaeogene Andean gap and the rise of the NorthPatagonian High Plateau. Biol J Linn Soc 103: 305–315., Lavina & Fauth 2011Lavina EL & Fauth G. 2011. Evolução Geológica da América do Sul nos Últimos 250 Milhões de Anos. In: Biogeografia América do Sul Padrões e Processos (eds de Carvalho CJB, Almeida EAB), p. 3-13. Roca Ltda, Sao Paulo.). Such climatic and geological events were critical in determining current patterns of species distribution (Ab’Sáber 1977, Burnham & Graham 1999Burnham RJ & Graham A. 1999. The history of Neotropical vegetation: new developments and status. Ann Missouri Bot Gard 86: 546-589.) and creating complex scenarios for species diversification (Colinvaux et al. 1996aColinvaux PA, De Oliveira PE, Moreno JE, Miller MC & Bush MB. 1996a. A long pollen record from lowland Amazonia: forest and cooling in glacial times. Science 274: 85-88., bColinvaux PA, Liu KB, de Oliveira PE, Bush MB, Miller MC & KANNAN MS. 1996b. Temperature depression in the lowland tropics in glacial times. Climatic Change 32: 19-33., Behling 2002Behling H. 2002. Carbon storage increases by major forest ecosystems in tropical South America since the Last Glacial Maximum and the early Holocene. Global Planet Change 33: 107-116., Antonelli & Sanmartin 2011Antonelli A & Sanmartin I. 2011. Why are there so many plant species in the Neotropics? Taxon 60: 403-414., Aragon et al. 2011Aragon E, Goin FJ, Aguilera YE, Woodburne MO, Carlini AA & ROGGIERO MF. 2011. Palaeogeography and palaeoenvironments of northern Patagonia from the Late Cretaceous to the Miocene: the Palaeogene Andean gap and the rise of the NorthPatagonian High Plateau. Biol J Linn Soc 103: 305–315.). The lowlands of mid-latitude South America comprise complex temperate ecoregions, including the Pampa and the Campos of Uruguay, northeastern Argentina and southern Brazil, characterized by a unique biodiversity (Miñarro & Bilenca 2008Miñarro F & Bilenca D. 2008. The Conservation Status of Temperate Grasslands in Central Argentina. Fundación Vida Silvestre Argentina, Special Report, Buenos Aires.). However, these ecoregions have been overlooked in evolutionary studies, being the patterns and the processes responsible for shaping its species diversity still largely unknown (Speranza et al. 2007Speranza PR, Seijo JG, Grela IA & Solís Neffa VG. 2007. cpDNA variation in the Turnera sidoides L. complex (Turneraceae): biogeographical implications. J Biogeogr 34: 427-436., Antonelli & Sanmartın 2011Antonelli A & Sanmartin I. 2011. Why are there so many plant species in the Neotropics? Taxon 60: 403-414., Turchetto-Zolet et al. 2013TURCHETTO-ZOLET AC, PINHEIRO F, SALGUEIRO F, PALMA-SILVA C. 2013. Phylogeographical patterns shed light on evolutionary process in South America. Mol Ecol 22: 1193-1213.).
Integrative approaches combining morphological, biogeographic, environmental together with genetic data in species complexes provide information about the first steps in species radiation, the colonization of new habitats and, the selective pressures in different environments (Mäder et al. 2013, Turchetto et al. 2014TURCHETTO C, FAGUNDES NJR, SEGATTO AL, KUHLEMEIER C, SOLÍS NEFFA VG, SPERANZA PR, BONATTO SL & FREITAS LB. 2014. Diversification in the South American Pampas: the genetic and morphological variation of the widespread Petunia axillaris complex (Solanaceae). Mol Ecol 23: 374-389., Andre et al. 2015ANDRE TJC, SPECHT C, SALZMAN S, PALMA-SILVA C & WENDT T. 2015. Evolution of species diversity in the genus Chamaecostus (Costaceae): molecular phylogenetics and morphometric approaches. Phytotaxa 204: 265-276., Lagomarsino et al. 2016Lagomarsino LP, Condamine FL, Antonelli A, Mulch A & Davis CC. 2016. The abiotic and biotic drivers of rapid diversification in Andean bellflowers (Campanulaceae). New Phytol 210: 1430-1442., Xu et al. 2017Xu B, Sun G, Wang X, Lu J, Wang IJ & Wang Z. 2017. Population genetic structure is shaped by historical, geographic, and environmental factors in the leguminous shrub Caragana microphylla on the Inner Mongolia Plateau of China. BMC Plant Biol 17:200.). Such analyses improved the knowledge about the evolutionary history of species as well as the potential processes underlying the diversification and speciation events. Thus, in the last decade many studies adopted species complexes to test different evolutionary hypotheses (He et al. 2013He Q, Edwards DL, Knowles LL. 2013. Integrative testing of how environments from the past to the present shape genetic structure across landscapes. Evolution 67: 3386-3402., Longo et al. 2014LONGO D, LORENZ-LEMKE AP, MÄDER G, BONATTO SL & FREITAS LB. 2014. Phylogeography of the Petunia integrifolia complex in southern Brazil. Bot J Linn Soc 174: 199-213., Zamudio et al. 2016Zamudio KR, Bellb RC & Masona NA. 2016. Phenotypes in phylogeography: Species’ traits, environmental variation, and vertebrate diversification. PNAS 113: 8041-8048., Pinheiro et al. 2018Pinheiro F, Dantas-Queiroz MV & Palma-Silva C. 2018. Plant Species Complexes as Models to Understand Speciation and Evolution: A Review of South American Studies. Crit Rev Plant Sci 37: 54-80.).
The South American flora is rich in species complexes composed of recently diverged lineages like Calceolaria spp., Eugenia spp., Petunia spp. and Solanum spp. (Alvarez et al. 2008ALVAREZ NMB, PERALTA IE, SALAS A & SPOONER D M. 2008. A morphological study of species boundaries of the wild potato Solanum brevicaule complex: replicated field trials in Peru. Plant Syst Evol 274: 37-45., Mäder et al. 2013, Longo et al. 2014LONGO D, LORENZ-LEMKE AP, MÄDER G, BONATTO SL & FREITAS LB. 2014. Phylogeography of the Petunia integrifolia complex in southern Brazil. Bot J Linn Soc 174: 199-213., Turchetto et al. 2014TURCHETTO C, FAGUNDES NJR, SEGATTO AL, KUHLEMEIER C, SOLÍS NEFFA VG, SPERANZA PR, BONATTO SL & FREITAS LB. 2014. Diversification in the South American Pampas: the genetic and morphological variation of the widespread Petunia axillaris complex (Solanaceae). Mol Ecol 23: 374-389., Brünger et al. 2015BRÜNGER MO, EINSEHLOR P, FIGUEIREDO MLN & STEHMANN JR. 2015. Resolving species delimitations in the Eugenia involucrata group (Eugenia sect. Phyllocalyx, Myrtaceae) with morphometric analysis. Syst Bot 40: 995-1002., Maubecin et al. 2016MAUBECIN C, COSACOV A, SÉRSIC AN, FORNONI J & BENÍTEZ-VIEYRA S. 2016. Drift effects on the multivariate floral phenotype of Calceolaria polyrhiza during a postglacial expansion in Patagonia. J Evol Biol 29: 1523-1534., Pinheiro et al. 2018Pinheiro F, Dantas-Queiroz MV & Palma-Silva C. 2018. Plant Species Complexes as Models to Understand Speciation and Evolution: A Review of South American Studies. Crit Rev Plant Sci 37: 54-80.). Turnera sidoides L. (Passifloraceae, Turneroideae) is among these species complexes and, constitutes an informative biogeographic and evolutionary model system (Speranza et al. 2007Speranza PR, Seijo JG, Grela IA & Solís Neffa VG. 2007. cpDNA variation in the Turnera sidoides L. complex (Turneraceae): biogeographical implications. J Biogeogr 34: 427-436., Solís Neffa 2010Solís Neffa VG. 2010. Geographic patterns of morphological variation in Turnera sidoides L. subsp. pinnatifida (Juss. Ex Poir.) Arbo (Turneraceae). Plant Syst Evol 284: 231-253., Moreno et al. 2018Moreno EMS, Freitas LB, Speranza PR, Solís Neffa VG. 2018. Impact of Neogene geoclimatic events on the genetic structure in mid-latitude South American plants: insights from the phylogeography of Turnera sidoides complex. Bot J Linn Soc 188: 377-390.). This autopolyploid complex of outcrossing, perennial, rhizomatous herbs, covers a large extension of the South America lowlands and, ranges naturally from the southern regions of Bolivia and Brazil, through Paraguay to Uruguay and Argentina, reaching 39º S. Biogeographically, the area of T. sidoides is included in the Chacoan subregion proposed by Morrone (2000MORRONE JJ. 2000. What is the Chacoan Region? Neotropica 46: 51-68., 2006MORRONE JJ. 2006. Biogeographic areas and transition zones of Latin American and the Caribbean islands based on panbiogeographic and cladistic analyses of the entomofauna. Ann Rev Entomol 51: 467-494., 2014Morrone JJ. 2014. Biogeographical regionalisation of the Neotropical region. Zootaxa 3782: 1-110.), while, from the phytogeographical point of view, most of this area is included in the Pampeana, Espinal, Chaqueña and Pre-Puneña provinces (Chaqueño Domain), extending into the Paranaense province (Amazónico Domain) proposed by Cabrera (1971)Cabrera AL. 1971. Fitogeografía de la República Argentina. Bol Soc Argent Bot 14: 1-55. and Cabrera & Willink (1973Cabrera AL & Willink A. 1973. Biogeografía de América Latina. Washington: Secretaría General OEA., 1980Cabrera AL & Willink A. 1980. Biogeografía de América Latina. 2a edición corregida. Monografía 13. Serie de Biología. Secretaría General de la Organización de los Estados Americanos. Washington DC, EEUU, 120 p.).
Turnera sidoides presents a huge morphological and geographically structured variability, suggesting that an active process of diversification is happening in the complex (Solís Neffa 2010Solís Neffa VG. 2010. Geographic patterns of morphological variation in Turnera sidoides L. subsp. pinnatifida (Juss. Ex Poir.) Arbo (Turneraceae). Plant Syst Evol 284: 231-253.). Based on the leaf shape and indumentum variability as well as on their geographical distribution, five subspecies were recognized in T. sidoides: T. sidoides subsp. carnea (Cambess.) Arbo, T. sidoides subsp. holosericea (Urb.) Arbo, T. sidoides subsp. integrifolia (Griseb.) Arbo, T. sidoides subsp. pinnatifida (Juss. ex Poir.) Arbo, and T. sidoides subsp. sidoides (Arbo 1985Arbo MM. 1985. Notas taxonómicas sobre Turneráceas sudamericanas. Candollea 40: 175-191., 2008Arbo MM. 2008. Systematic studies in Turnera (Turneraceae). IV. Series Leiocarpae. Sessilifoliae y Conciliatae. Bonplandia 17: 107-334.). Different ploidy levels based on x= 7, from 2n= 2x= 14 to 2n= 8x= 56, have been reported within the subspecies (Fernández 1987Fernández A. 1987. Estudios cromosómicos en Turnera y Piriqueta (Turneraceae). Bonplandia 6: 1-21., Solís Neffa & Fernández 2001Solís Neffa VG & Fernández A. 2001. Cytogeography of the Turnera sidoides L. complex (Turneraceae, Leiocarpae). Bot J Lin Soc 137: 189-196., Solís Neffa et al. 2004SOLÍS NEFFA VG, PANSERI AF, REYNOSO W & SEIJO JG. 2004. Variación del color de flores y números cromosómicos en el noroeste del área de distribución de Turnera sidoides (Turneraceae). Bonplandia 13: 117-128., Speranza et al. 2007Speranza PR, Seijo JG, Grela IA & Solís Neffa VG. 2007. cpDNA variation in the Turnera sidoides L. complex (Turneraceae): biogeographical implications. J Biogeogr 34: 427-436., Elías et al. 2011ELÍAS G, SARTOR ME & SOLÍS NEFFA VG. 2011. Patterns of cytotype variation of Turnera sidoides subsp. pinnatifida (Turneraceae) in mountain ranges of central Argentina. J Pl Res 124: 25-34., Kovalsky & Solís Neffa 2012Kovalsky IE & Solís Neffa VG. 2012. Evidence of 2n microspore production in a natural diploid population of Turnera sidoides subsp. carnea and its relevance in the evolution of the T. sidoides (Turneraceae) autopolyploid complex. J Plant Res 125: 725-734.). Based on the geographic distribution of the morphological and genetic variation, two main centres of the species diversification were identified, one in the west (northwestern Argentina and Bolivia) and, the other in the east (northeastern Argentina, Uruguay and Southern Brazil) of the T. sidoides geographical range (Solís Neffa et al. 2004SOLÍS NEFFA VG, PANSERI AF, REYNOSO W & SEIJO JG. 2004. Variación del color de flores y números cromosómicos en el noroeste del área de distribución de Turnera sidoides (Turneraceae). Bonplandia 13: 117-128., Speranza et al. 2007Speranza PR, Seijo JG, Grela IA & Solís Neffa VG. 2007. cpDNA variation in the Turnera sidoides L. complex (Turneraceae): biogeographical implications. J Biogeogr 34: 427-436., Moreno et al. 2018Moreno EMS, Freitas LB, Speranza PR, Solís Neffa VG. 2018. Impact of Neogene geoclimatic events on the genetic structure in mid-latitude South American plants: insights from the phylogeography of Turnera sidoides complex. Bot J Linn Soc 188: 377-390.). The later centre is of interest in this report.
Turnera sidoides subsp. carnea is a variable subspecies occurring in the east of the T. sidoides area. It mainly grows in the lowlands of northeastern Argentina and Uruguay, extending to southern Paraguay and Brazil (Fig. 1). This widespread range is geomorphologically diverse, comprises a great diversity of climates and different phytogeographical provinces. Moreover, the area is divided in a NE-SW direction by the large Uruguay river. As expected from its distribution, populations of T. sidoides subsp. carnea present a striking variation in different traits along its area of occurrence, among them, the flower color (light or dark pink) and the leaf consistency (membranous or coriaceous). Therefore, T. sidoides subsp. carnea, constitutes a good model to detect early stages of divergence, and to identify the potential mechanisms underlying the diversification and speciation processes within the eastern centre of variation of T. sidoides complex.

Geographic distribution of Turnera sidoides subsp. carnea morphotypes and major geographical features of the distribution area. CH= Cuchilla de Haedo; CG= Cuchilla Grande; CGI= Cuchilla Grande Inferior; SS= Serra do Sudeste.
Thus, in this study an integrative approach combining morphological data, ecological niche modeling and population genetic analysis was done to understand the process of diversification within T. sidoides subsp. carnea and to increase the knowledge concerning the patterns and the processes responsible for shaping the species diversity in the temperate lowlands of South America.
MATERIALS AND METHODS
Study area
It is a large extension of lowlands that comprises the northeastern Argentina, Uruguay and, southern Paraguay and Brazil, divided in a north–south direction by the Uruguay River. Due to its geographic position at the limit for tropical vegetation types (Cabrera & Willink 1980Cabrera AL & Willink A. 1980. Biogeografía de América Latina. 2a edición corregida. Monografía 13. Serie de Biología. Secretaría General de la Organización de los Estados Americanos. Washington DC, EEUU, 120 p.), the study area occupies a transitional zone between subtropical and temperate climates. Annual rainfall northwards increases from 600 mm to 1,800 mm, while mean temperature increases in the same direction from 13 °C to 22 °C (Van Der Sluijs 1971Van Der SluiJs S. 1971. The native grasslands of the mesopotamian region of Argentina notherlands. J Agric Sci 19: 3-22., Carnevalli 1994Carnevalli R. 1994. Fitogeografía de la Provincia de Corrientes. Corrientes: Gobierno de la Provincia de Corrientes-INTA.). Phytogeographically, the study area is in the Neotropical Region and are part of two biogeographical domains, Amazonian and Chacoan, represented by the Paranaense province as well as the Pampean and Espinal provinces (Cabrera 1971Cabrera AL. 1971. Fitogeografía de la República Argentina. Bol Soc Argent Bot 14: 1-55., Cabrera & Willink 1980Cabrera AL & Willink A. 1980. Biogeografía de América Latina. 2a edición corregida. Monografía 13. Serie de Biología. Secretaría General de la Organización de los Estados Americanos. Washington DC, EEUU, 120 p.), respectively, with large ecotones in their contact areas, resulting in very different floristic patterns (Carnevalli 1994Carnevalli R. 1994. Fitogeografía de la Provincia de Corrientes. Corrientes: Gobierno de la Provincia de Corrientes-INTA.).
Northwest of the Uruguay River, in the northeastern Argentina and southern Paraguay, is the oldest geological formation which consists of basic volcanic rock of Triassic age and hard, layered, often silicified red sandstone of aeolian origin. The sandstone forms the parent material from which red lateritic clays, common to the northeast of this area, have developed. Outcrops of the same sandstone and of basalt are found in the Mercedes plateau (Popolizio 1999POPOLIZIO E. 1999. Geomorfología. In: Herbst R & Santa Cruz J (Eds), Mapa litoestratigráfico de la Provincia de Corrientes. Capítulo 4. D´Orbignyana, 2ª ed., 17 p., Iriondo & Paira 2007Iriondo M & Paira A. 2007. Physical geography of the Basin. In: The Middle Paraná River: Limnology of a Subtropical Wetland. Iriondo M & Paira A (Eds), Springer, 7-858, 31 p.). The major vegetation types are medium-tall grass savannas with remnants of depauperated subtropical forest on the better-drained lateritic soils, humid and wet tussock grasslands found on poorly drained soils or permanently covered by a high water table, forests along the main river banks, and a mosaic of sclerophyll woodlands, palm savannas and flood lowlands towards the south of the Mercedes plateau (Van Der Sluijs 1971Van Der SluiJs S. 1971. The native grasslands of the mesopotamian region of Argentina notherlands. J Agric Sci 19: 3-22., Carnevalli 1994Carnevalli R. 1994. Fitogeografía de la Provincia de Corrientes. Corrientes: Gobierno de la Provincia de Corrientes-INTA., Oyarzabal et al. 2018OYARZABAL M ET AL. 2018. Unidades de vegetación de la Argentina. Ecol Austral 28: 40-63.).
Southeast to the Uruguay River, in the Uruguayan and Brazilian portions of the study area, a diverse array of rocks, such as Precambrian granite, Carboniferous sandstone, and Jurassic basalt, is exposed to surface and soil-forming processes (Paruelo et al. 2007Paruelo JM, Jobbágy EG, Oesterheld M, Golluscio RA & Aguiar MR. 2007. The grasslands and steppes of Patagonia and the Rio de la Plata plains. In: Veblen T, Young K & Orme A (Eds), The physical geography of South America. The Oxford Regional Environments Series. Oxford University Press, p. 232-248 (Chapter 14)., Bizzi et al. 2001BIZZI LA, SCHOBBENHAUS C, GONÇALVES JH, BAARS FJ, DELGADO IM, ABRAM MB, NETO RL, MATOS GMM & SANTOS JOS. 2001. Geology, tectonics and mineral resources of Brazil: Geographic information system (GIS) and maps at the 1:2500000 scale. CPRM, Brasília, 4 CD-Rom.). The landscape is an undulated peneplain in which the most important orographic systems are the Cuchillas de Haedo and Grande (in Uruguay) and the Serra do Sudeste (in Brazil), the principal dividers of the hydrographic basins (Fig. 1). Lower forms of relief are located on the periphery of the peneplain, formed from sedimentary rocks, arranged horizontally with gentle slopes and poor drainage, where marshlands are frequently found. Variation in geological substrate and altitude further contribute to the diversity of vegetation types (Waechter 2002Waechter JL. 2002. Padroẽs geográficos na flora atual do Rio Grande do Sul. Ciência Ambiente 24: 93-108.). Although the grasslands are the main vegetation in the entire region, two subregions are clearly differentiated, the Campos in the north and the Pampas in the south. The northern area not only differs in temperature and humidity with respect to the southern one, but also in the flora, which has subtropical elements intermingled with temperate flora. The hilly areas are covered by woody vegetation that was considered as southward extensions of the Paranense forest formations (Grela 2004Grela IA. 2004. Geografía florística de las especies arbóreas de Uruguay: propuesta para la delimitación de dendrofloras. Master´s Thesis. Programa de Desarrollo de las Ciencias Básicas, Ministerio de Educación y Cultura, Universidad de la República, Montevideo, Uruguay., Paruelo et al. 2007Paruelo JM, Jobbágy EG, Oesterheld M, Golluscio RA & Aguiar MR. 2007. The grasslands and steppes of Patagonia and the Rio de la Plata plains. In: Veblen T, Young K & Orme A (Eds), The physical geography of South America. The Oxford Regional Environments Series. Oxford University Press, p. 232-248 (Chapter 14).). In the westernmost limit, an Acacia–Prosopis parkland vegetation provides a transition to the Chaco and Espinal formations further to the west (Waechter 2002Waechter JL. 2002. Padroẽs geográficos na flora atual do Rio Grande do Sul. Ciência Ambiente 24: 93-108.).
Sampling
The material analyzed was obtained from field collections during the years 1995-2009 (Apendix SI). Overall, 42 populations were sampled along the geographical distribution of T. sidoides subsp. carnea. Whenever possible, the plants were randomly sampled in each locality and some of them were transferred and cultivated in a greenhouse in similar soil and culture conditions at the Instituto de Botánica del Nordeste (IBONE) in Corrientes, Argentina. Representative vouchers for each population analyzed are deposited at the herbarium of IBONE (CTES) and at the herbarium from Instituto de Biociências, Universidade Federal do Rio Grande do Sul (ICN). A second set of material was composed of 30 herbarium specimens from the herbaria CTES, G, LIL, and MVFA (citation follows Holmgren et al. 1990HOLMGREN PK, HOLMGREN NH & BARNETT LC. 1990. Index herbariorum, Part I: The herbaria of the world, 8th ed., New York Botanical Garden, New York.). Details of the material studied are given in the Supplementary Material - Appendix S1.
Morphological analyses
Aiming to explore the morphological variation among populations of T. sidoides subsp. carnea a two steps analysis was conducted. The first step comprised the morphological inspection of living material from 42 populations in the field and cultivated in greenhouse for several generations. Several reproductive traits (pollen size and number, number of ovules, pollen / ovule ratio, pollen viability, diameter of the corolla, petals length and width, style length, ovary length, anthers length, number of stigma branches, anther length / style and, length ratio) as well as fruit set varied among and within populations in relation to ploidy level or distily, respectively (Solís Neffa 2000Solís Neffa VG. 2000. Estudios biosistemáticos en el complejo Turnera sidoides L. (Turneraceae, Leiocarpae). Universidad Nacional de Córdoba. Doctoral Thesis., Panseri 2011Panseri AF. 2011. Estructura genética y variación de los caracteres reproductivos en Turnera sidoides subsp. pinnatifida (Turneaceae). Universidad Nacional del Nordeste, FCA. Doctoral Thesis.). However, only flower color (dark or light pink) and leaf consistency (membranous or coriaceous leaves) varied consistently. Plants with dark pink flowers always have coriaceous leaves while plants with light pink flowers have membranous leaves. Since the variation in these traits was associated to each other, they were used to define two morphotypes (see morphological analysis in results) and to identify 30 historical herbarium materials in the second step of the morphological analysis. The consistency of the leaves was visually surveyed in the herbarium vouchers while the color of the flowers was obtained from the data recorded in the labels.
Ploidy level estimations
Ploidy level of some populations was estimated by meiotic chromosome counting and flow cytometry according to the methods described in Kovalsky & Solís Neffa (2012)Kovalsky IE & Solís Neffa VG. 2012. Evidence of 2n microspore production in a natural diploid population of Turnera sidoides subsp. carnea and its relevance in the evolution of the T. sidoides (Turneraceae) autopolyploid complex. J Plant Res 125: 725-734., while ploidy level data of other populations were recorded from previous contributions of our research team (Fernández 1987Fernández A. 1987. Estudios cromosómicos en Turnera y Piriqueta (Turneraceae). Bonplandia 6: 1-21., Solís Neffa & Fernández 2001Solís Neffa VG & Fernández A. 2001. Cytogeography of the Turnera sidoides L. complex (Turneraceae, Leiocarpae). Bot J Lin Soc 137: 189-196., Speranza et al. 2007Speranza PR, Seijo JG, Grela IA & Solís Neffa VG. 2007. cpDNA variation in the Turnera sidoides L. complex (Turneraceae): biogeographical implications. J Biogeogr 34: 427-436., Kovalsky & Solís Neffa 2012Kovalsky IE & Solís Neffa VG. 2012. Evidence of 2n microspore production in a natural diploid population of Turnera sidoides subsp. carnea and its relevance in the evolution of the T. sidoides (Turneraceae) autopolyploid complex. J Plant Res 125: 725-734., Kovalsky et al. 2017Kovalsky IE, Roggero Luque JM, Elias G, Fernández SA & Solis Neffa VG. 2017. The role of triploids in the origin and evolution of polyploids of Turnera sidoides complex (Passifloraceae, Turneroideae). J Plant Res 131: 77-89.).
Geographic distribution and ecological preferences
The geographic distribution of 72 populations was analyzed based on geo-referenced points obtained in the field trips and from herbarium specimens. The distribution map was made using the software QGis 3.4.2-Madeira (QGIS Development Team 2018QGIS Development Team. 2018. QGIS Geographic Information System. Open Source Geospatial Foundation Project. http://qgis.osgeo.org.
http://qgis.osgeo.org...
). The ecological preferences of each population were determined from observations in the field during collection trips and by analyzing the information provided in the labels of herbarium specimens.
Ecological niche modeling (ENM)
The current potential distribution of T. sidoides subsp. carnea was modeled using point locality information and environmental data in QGis 3.4.2-Madeira (QGIS Development Team 2018QGIS Development Team. 2018. QGIS Geographic Information System. Open Source Geospatial Foundation Project. http://qgis.osgeo.org.
http://qgis.osgeo.org...
) and MaxEnt 3.4.1 (Phillips et al. 2017Phillips SJ, Anderson RP, Dudík M, Schapire RE & Blair M. 2017. Opening the black box: an open-source release of MaxEnt. Ecography 40: 887-893.). To detect spatial autocorrelation and prevent the spatial dependence, the response and the predictor variables, as well as the residuals of each model were tested by building Moran’s correlograms. As a result, 20 geo-referenced points corresponding to the morphotype with dark pink flowers, and membranous leaves and, 35 geo-referenced points corresponding to the morphotype with light pink flowers and coriaceous leaves were used for the analysis (Appendix S1).
For the modeling, 19 bioclimatic variables were extracted from the WorldClim database (<http://www.worldclim.org/>) (Hijmans et al. 2005Hijmans RJ, Cameron SE, Parra JL, Jones PG & Jarvis A. 2005. Very high resolution interpolated climate surfaces for global land areas. Int J Climatol 25: 1965-1978.) and were used at a resolution of 2.5 min. The mean average, standard deviation, and range of variation of the bioclimatic variables were calculated for each morphotypes. To evaluate the existence of significant differences for each variable between morphotypes, one-way ANOVA at a significance level of 5 % (α= 0.05) after Bartlett’s test of homogeneity was made. Moreover, a Principal Component Analysis (PCA) based on a correlation matrix was performed to minimize multicollinearity and to reduce the number of predictors’ variables to four axes explaining most of the climatic variance (76.35 %). After this analysis, we select the following four uncorrelated variables (r ≥ 0.80) to perform ENM: BIO 4 (Temperature Seasonality [standard deviation × 100]), BIO 6 (Minimum Temperature of Coldest Month), BIO 14 (Precipitation of Driest Month) and BIO 18 (Precipitation of Warmest Quarter).
An ENM analysis was made for each morphotype of T. sidoides subsp. carnea to evaluate their climatic identity and to determine how current climatic conditions affected their distributions. For the morphotype with dark pink flowers and membranous leaves, MaxEnt was run using the following settings: feature classes: LQH, Cloglog output format, replicate run type= crossvalidate, regularization multiplier= 2, maximum iterations= 500, ten replicates; while for the morphotype with light pink flowers and coriaceous leaves the settings used were: feature clases: LQ, Cloglog output format, replicate run type= crossvalidate, regularization multiplier= 1, maximum iterations= 500, ten replicates. Binary maps of all models were obtained using the smallest suitability value from the species presence points as the threshold value. The importance of each variable was determined comparing percent contribution values and Jackknife plots.
To evaluate statistically the model performance, the area under the curve (AUC) of the receiver operating characteristic (ROC) plot (Phillips et al. 2006Phillips SJ, Anderson RP & Schapire RE. 2006. Maximum entropy modeling of species geographic distributions. Ecol Model 190: 231-259.) was used, and True Skill Statistic (TSS) (Allouche et al. 2006Allouche O, Tsoar A & Kadmon R. 2006. Assessing the accuracy of species distribution models: prevalence, Kappa and the True Skill Statistic (TSS). J Appl Ecol 43: 1223-1232.) was estimated. The AUC is a threshold-independent measure of model performance and varies from 0 to 1; 0.5 means no predictive ability or randomness and 1.0 shows perfect predictive ability (Fielding & Bell 1997Fielding AH & Bell JF. 1997. A review of methods for the assessment of prediction errors in conservation presence/absence models. Environ Conserv 24: 38-49.). TSS is defined as sensitivity (correctly classified presences) + specificity (correctly classified absences) –1. TSS values range from -1 to 1; when the values are negative or close to zero, the models are not different of a randomly generated model; models with values close to 1 are considered excellent. Acceptable models present TSS values over 0.5 (Allouche et al. 2006Allouche O, Tsoar A & Kadmon R. 2006. Assessing the accuracy of species distribution models: prevalence, Kappa and the True Skill Statistic (TSS). J Appl Ecol 43: 1223-1232.). Also, the Akaike Information Criterion corrected for small sample sizes (AICc; Johnson & Omland 2004Johnson JB & Omland KS. 2004. Model selection in ecology and evolution. Trends Ecol Evol 19: 101-108.) was calculated. The AICc is a balanced statistic between the goodness of fit and the number of parameters of the model (Johnson & Omland 2004Johnson JB & Omland KS. 2004. Model selection in ecology and evolution. Trends Ecol Evol 19: 101-108.), which allows selecting models with optimal complexity (Warren & Seifert 2011Warren DL & Seifert SN. 2011. Ecological niche modeling in MaxEnt: the importance of model complexity and the performance of model selection criteria. Ecol App 212: 335-342.). All statistical analyzes were conducted with the RStudio (ver. 3.3.1; R Core Team 2014R Core Team. 2014. R: A language and environment for statistical computing. R Foundation for Statistical Computing, Vienna, Austria. URL http://www.R-project.org/.
http://www.R-project.org/...
) except for Moran’s I correlation which was performed with the software PAST (Hammer et al. 2001HAMMER Ø, HARPER DAT & RYAN PD. 2001. PAST: Paleontological Statistics Software Package for Education and Data Analysis. Palaeontologia Electronica 4: 9p. 178kb. http://palaeo-electronica.org/2001_1/past/issue1_01.htm.), and the AICc analysis, which was run with the modular R-based platform Wallace (Kass et al. 2018Kass JM, Vilela B, Aiello-Lammens ME, Muscarella R, Merow C & Anderson RP. 2018. Wallace: A flexible platform for reproducible modeling of species niches and distributions built for community expansion. Methods Ecol Evol 9: 1151-1156.).
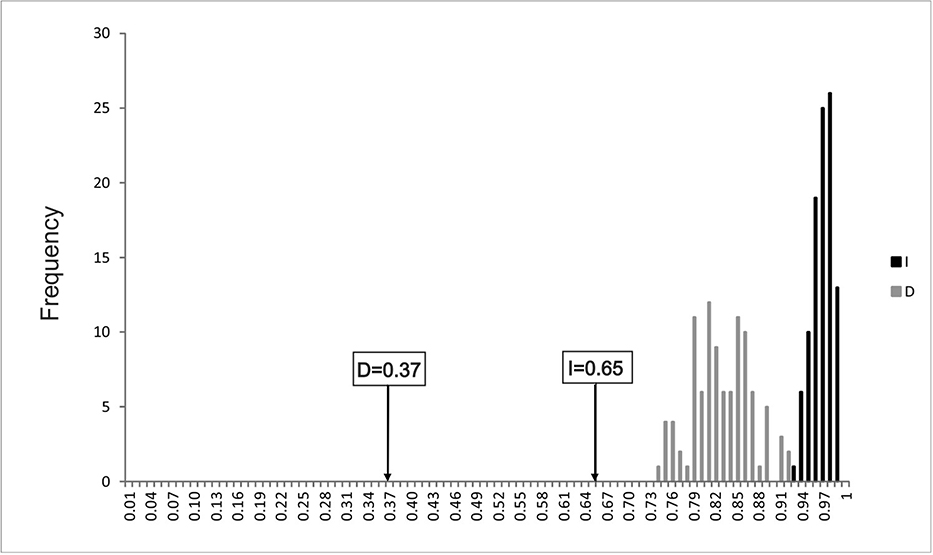
The niche overlap was tested with ENMTools v 1.4.4 (Warren et al. 2010Warren DL, Glor RE & Turelli M. 2010. ENMTools: A toolbox for comparative studies of environmental niche models. Ecography 33: 607-611.) to examine niche divergence between morphotypes. Schoener’s D (Warren et al. 2008Warren DL, Glor RE & Turelli M. 2008. Environmental niche equivalency versus conservatism: quantitative approaches to niche evolution. Evolution 62: 2868-2883.) and Hellinger’s-based I (Schoener 1968Schoener TW. 1968. The Anolis lizards of Bimini: Resource partitioning in a complex fauna. Ecology 49: 704-726.) indexes were calculated based on the habitat suitability comparison from ENM. Both indexes range from 0 (complete divergence/no overlap) to 1 (high similarity/complete overlap, niche being equally suitable for both species) (Warren et al. 2008Warren DL, Glor RE & Turelli M. 2008. Environmental niche equivalency versus conservatism: quantitative approaches to niche evolution. Evolution 62: 2868-2883., Broennimann et al. 2012Broennimann O ET AL. 2012. Measuring ecological niche overlap from occurrence and spatial environmental data. Global Ecol Biogeogr 21: 481-497.). Then, the identity test was executed to validate whether the obtained niche-overlap scores exhibited statistically significant values (Warren et al., 2008). A pseudoreplicated null distribution was generated with this test with 100 replicates. Finally, Schoener’s D and Hellinger’s I were compared with the generated null distribution. The null hypothesis of this test (the observed values of niche overlap do not differ from random values) is rejected when the estimated value for D and/or I is significantly different from the null distribution.
Genetic analyses
To evaluate the existence of genetic divergence between populations and morphotypes, a subset of individuals was analyzed genetically with nuclear markers and non-coding chloroplast region sequences (Table I).
Populations of Turnera sidoides subsp. carnea analyzed with molecular markers. ID= population identity, g= grandense; m= mercedeño. 1EMBL GenBank accession numbers for cpDNA intergenic spacer sequences. 2New ploidy level estimations. 3 Speranza et al. (2007)Speranza PR, Seijo JG, Grela IA & Solís Neffa VG. 2007. cpDNA variation in the Turnera sidoides L. complex (Turneraceae): biogeographical implications. J Biogeogr 34: 427-436.. 4 Kovalsky et al. (2017)Kovalsky IE, Roggero Luque JM, Elias G, Fernández SA & Solis Neffa VG. 2017. The role of triploids in the origin and evolution of polyploids of Turnera sidoides complex (Passifloraceae, Turneroideae). J Plant Res 131: 77-89.. 5 Solís Neffa & Fernández (2001)Solís Neffa VG & Fernández A. 2001. Cytogeography of the Turnera sidoides L. complex (Turneraceae, Leiocarpae). Bot J Lin Soc 137: 189-196..
Nuclear genotyping
Total DNA was extracted from dry leaves using the protocol of Speranza et al. (2007)Speranza PR, Seijo JG, Grela IA & Solís Neffa VG. 2007. cpDNA variation in the Turnera sidoides L. complex (Turneraceae): biogeographical implications. J Biogeogr 34: 427-436.. The genetic variability at nuclear level of thirteen populations (62 individuals) was analyzed using RAPD (Random Amplified Polymorphism DNA) markers. Four arbitrary RAPD primers of Operon Technologies (OPO2-OPO4-OPO10-OPO20) that produce polymorphic amplicons in T. sidoides (Panseri 2011Panseri AF. 2011. Estructura genética y variación de los caracteres reproductivos en Turnera sidoides subsp. pinnatifida (Turneaceae). Universidad Nacional del Nordeste, FCA. Doctoral Thesis.) were chosen. The PCR mix contained 37.5 ng DNA approximately, 0.75 mM MgCl2, 0.1 mM dNTP, 0.31 U Taq polymerase in 1× reaction buffer and, 0.2 μM primer in total volume of 8 μL. PCR amplification consisted of one cycle of 94 °C for 2 min, 35 cycles of 94 °C for 30 sec, 37 °C for 1 min, 72 °C for 2 min and, a final extension step at 72 °C for 5 min. PCR products were separated by electrophoresis on 2 % agarose gel at 2.3 V/cm for 160 min, which then were stained with ethidium bromide (10mg/ ml) and photographed under UV light. Bands of identical size were considered homologous across the individuals, while those having different sizes were assumed to belong to different loci. Bands resulting from the PCR amplifications were scored for each locus based on their presence (1) or absence (0), and a binary data matrix was constructed.
From the presence/absence matrix, the total number of bands, the number of exclusive bands, the percentage of polymorphic loci, and the unbiased expected heterozygosity with the correction factor for little samples according to Lynch & Milligan (1994)Lynch M & Milligan BG. 1994. Analysis of population structure with RAPD markers. Mol Ecol 3: 91-99. for dominant markers were calculated. Shannon’s diversity index (Shannon & Weaver 1949SHANNON C & WEAVER W. 1949. The mathematical theory of communication. University of Illinois Press, Urbana.) was calculated to provide a relative estimate of the degree of variation within each population.
The degree of genetic structuring in T. sidoides subsp. carnea was evaluated by an analysis of molecular variance (AMOVA, Weir & Cockerham 1984Weir BS & Cockerham CC. 1984. Estimating F-statistics for the analysis of population structure. Evolution 38: 1358-1370., Excoffier et al. 1992Excoffier L, Smouse PE & Quattro JM. 1992. Analysis of molecular variance inferred from metric distances among DNA haplotypes: application to human mitochondrial DNA restriction data. Genetics 131: 479-494.). Also, the genetic divergence among populations and morphotypes was estimated using the ΦST index (Excoffier et al. 1992Excoffier L, Smouse PE & Quattro JM. 1992. Analysis of molecular variance inferred from metric distances among DNA haplotypes: application to human mitochondrial DNA restriction data. Genetics 131: 479-494.). A Bayesian clustering method implemented in the software STRUCTURE 2.3.3 (Pritchard et al. 2000PRITCHARD JK, STEPHENS M & DONNELLY P. 2000. Inference of population structure using multilocus genotype data. Genetics 155: 45-959.) was used to assess population structure of T. sidoides subsp. carnea without any a priori information about morphotypes. Two to fourteen possible groups (k) were analyzed, with three independent repetitions for each k. The admixture model and the option of correlated allele frequencies between populations were chosen, and the degree of admixture alpha was inferred from the data. A burn-in of 50,000 steps followed by 100,000 iterations was used to assign individual multilocus genotypes to one of the predefined K populations. The best Δk value was estimated by means of Evanno et al. (2005)Evanno G, Regnaut S & Goudet J. 2005. Detecting the number of clusters of individuals using the software structure: a simulation study. Mol Ecol 14: 2611-2620. method with STRUCTURE HARVESTER 6.94 software (Dent & Von Holdt 2012Dent AE & von Holdt BM. 2012 Structure Harvester: a website and program for visualizing STRUCTURE output and implementing the Evanno method. Conserv Genet Resour 4: 359-361.). Finally, a Principal Coordinate Analysis (PCoA) based on Nei´s genetic distances (Nei 1972Nei M. 1972. Genetic distance between populations. Amer Naturalist 106: 283-392.) between each pair of individuals was performed using the software GenAlEx 6.5 (Peakall & Smouse 2012Peakall R & Smouse PE. 2012. GenAlEx 6.5: genetic analysis in Excel. Population genetic software for teaching and research—an update. Bioinformatics 28: 2537-2539.).
The correlation of genetic (ΦST) and geographic distances was performed by a Mantel test (Mantel 1967MANTEL N. 1967. The detection of disease clustering and a generalized regression approach. Cancer Res 27: 209-220.), as implemented in Alleles in Space 1.0 (AIS, Miller 2005Miller MP. 2005. Alleles In Space (AIS): Computer Software for the Joint Analysis of Interindividual Spatial and Genetic Information. J Heredity 96(6): 722-724.). The significance of this correlation was assessed by a probability distribution with 10,000 random permutations.
Additionally, a Neighbour-joining tree (NJ) (Saitou & Nei 1987Saitou N & Nei M. 1987. The neighbor-joining method: a new method for reconstructing phylogenetic trees. Mol Biol Evol 4: 406-425.) based on Nei and Dice´s genetic distances between individuals was constructed with FreeTree (Pavlicek et al. 1999Pavlicek A, Hrda S & Flegr J. 1999. Free Tree: Freeware Program for Construction of Phylogenetic Trees on the Basis of Distance Data and Bootstrap/ Jackknife Analysis of the Tree Robustness. Application in the RAPD Analysis of Genus Frenkelia. Folia Biol (Praha) 45: 97-9.) and edited with FigTree 1.4 (Rambaut 2009Rambaut A. 2009. FigTree v1.3.1. Available at: http://tree.bio. ed.ac.uk/software/figtree.
http://tree.bio...
).
Chloroplast genotyping
Sequences of the intergenic cpDNA spacers trnL-trnF and matk5`R-matk6 obtained previously (Moreno et al. 2018Moreno EMS, Freitas LB, Speranza PR, Solís Neffa VG. 2018. Impact of Neogene geoclimatic events on the genetic structure in mid-latitude South American plants: insights from the phylogeography of Turnera sidoides complex. Bot J Linn Soc 188: 377-390.) and deposited in the GenBank (accession numbers detailed in Table I) were concatenated for all analyses. Sequences were read and manually edited with Chromas 2.33 (http://www.technelysium.com.au), and aligned with the Clustal W method implemented in MEGA 5 (Tamura et al. 2011Tamura K, Peterson D, Peterson N, Stecher G, Nei M & Kumar S. 2011. MEGA5: Molecular evolutionary genetics analysis using Maximum Likelihood, Evolutionary Distance, and Maximum Parsimony methods. Mol Biol 28: 2731-2739.). All of the polymorphic positions detected in the alignment were corroborated in the original chromatograms. All poly-T/A stretches were eliminated from the analyses since the mutational dynamics that rules the insertion/deletion events (indels) involved in poly-T/A stretches cannot be assessed (Aldrich et al. 1988Aldrich J, Cherney BW, Merlin E & Christopherson L. 1988. The role of insertion/ deletions in the evolution of the intergenic region between psbA and trnH in the chloroplast genome. Curr Genet 14: 137-146., Kelchner 2000Kelchner SA. 2000. The evolution of non-coding chloroplast DNA and its application in plant systematics. Ann Missouri Bot Gard 87: 482-298.). In addition, all the contiguous indels were treated as one mutational event (Simmons & Ochoterena 2000Simmons MP & Ochoterena H. 2000. Gaps as characters in sequence-based phylogenetic analyses. Syst Biol 49: 369-381.).
Haplotypes were inferred with DnaSP 5.0 (Librado & Rozas 2009Librado P & Rozas J. 2009. DnaSP v5: A software for comprehensive analysis of DNA polymorphism data. Bioinformatics 25: 1451-1452.). The standard diversity indices, including the number of segregating sites (S), nucleotide diversity (π) and haplotype diversity (h) were calculated. The genetic structure among and within morphotypes was inferred with AMOVA (Excoffier et al. 1992Excoffier L, Smouse PE & Quattro JM. 1992. Analysis of molecular variance inferred from metric distances among DNA haplotypes: application to human mitochondrial DNA restriction data. Genetics 131: 479-494.). All calculations were accomplished with Arlequin 3.5.1.2 (Excoffier & Lischer 2010Excoffier L & Lischer HEL. 2010. Arlequin suite ver 3.5: a new series of programs to perform population genetics analyses under Linux and Windows. Mol Ecol Res 10: 564-567.).
Signatures of demographic expansion were inferred computing Tajima´s D and Fu´s F statistics (Tajima 1989TAJIMA F. 1989. Statistical method for testing the neutral mutation hypotesis by DNA polymorphism. Genetics 123: 585-595., Fu 1997Fu YX. 1997. New statistical tests of neutrality for DNA samples from a population. Genetics 147: 915-925.) and conducting a mismatch distribution analysis for exponential/decline population size change models (Rogers & Harpending 1992Rogers AR & Harpending HC. 1992. Population growth makes waves in the distribution of pairwise genetic differences. Mol Biol Evol 9: 552-569., Schneider & Excoffier 1999Schneider S & Excoffier L. 1999. Estimation of past demographic parameters from the distribution of pairwise differences when the mutation rates vary among sites: Application to human mitochondrial DNA. Genetics 152: 1079-1089.), with DnaSP v.5 (Librado & Rozas 2009Librado P & Rozas J. 2009. DnaSP v5: A software for comprehensive analysis of DNA polymorphism data. Bioinformatics 25: 1451-1452.). The goodness of fit between the observed mismatch distributions to that expected under a sudden expansion model was tested with the sum of squared deviations (SSD) using parametric bootstrapping (1000 replicates) and the raggedness index (HRag) (Harpending 1994HARPENDING HC. 1994. Signature of ancient population growth in a low-resolution mitochondrial DNA mismatch distribution. Hum Biol 66: 591-600.).
Phylogenetic relationships between haplotypes were estimated using the Bayesian inference method implemented in BEAST 1.8.0 (Drummond et al. 2012Drummond AJ, Suchard MA, Xie D & Rambaut A. 2012. Bayesian phylogenetics with BEAUti and the BEAST 1.7. Mol Biol Evol 29: 1969-1973.). Two independent runs of 1 × 10⁸ Markov chain Monte Carlo (MCMC) iterations were performed, sampling every 1000 generations. The initial 10 % of the iterations were removed as burn-in. The HKY substitution model was selected using the Corrected Akaike information criterion (AICc, Burnham & Anderson 2004) with jModeltest 2.1.4 (Guindon & Gascuel 2003Guindon S & Gascuel O. 2003. A simple, fast, and accurate algorithm to estimate large phylogenies by maximum likelihood. Syst Biol 52: 696-704., Darriba et al. 2012Darriba D, Taboada GL, Doallo R & Posada D. 2012. jModel- Test 2: more models, new heuristics and parallel computing. Nat Methods 9: 772.), using the Yule tree prior and a lognormal molecular clock. Tracer 1.5 (Rambaut & Drummond 2009Rambaut A & Drummond AJ. 2009. Tracer version 1.5. Available at: http://beast.bio.ed.ac.uk.
http://beast.bio.ed.ac.uk...
) was used to check for convergence of the Markov chains and adequate effective sample sizes (ESS > 200). All trees generated were summarized in a maximum clade credibility tree using TreeAnnotator 1.7.1 (Drummond et al. 2012Drummond AJ, Suchard MA, Xie D & Rambaut A. 2012. Bayesian phylogenetics with BEAUti and the BEAST 1.7. Mol Biol Evol 29: 1969-1973.), which was edited in FigTree 1.3.1 (Rambaut 2009Rambaut A. 2009. FigTree v1.3.1. Available at: http://tree.bio. ed.ac.uk/software/figtree.
http://tree.bio...
). Statistical support was determined by assessing the Bayesian posterior probabilities (Rannala & Yang 1996Rannala B & Yang Z. 1996. Probability distribution of molecular evolutionary trees: a new method of phylogenetic inference. J Mol Evol 43: 304-311.). In the absence of a fossil record for the estimation of divergence times in T. sidoides, we used the data obtained by Ramos-Fregonezi et al. (2015)Ramos-Fregonezi AM, Fregonezi JN, Cybis GB, Fagundes NJ, Bonatto SL & Freitas LB. 2015. Were sea level changes during the Pleistocene in the South Atlantic Coastal Plain a driver of speciation in Petunia (Solanaceae)? BMC Evol Biol 15: 92., which compiles rates calculated for plastid markers for herbs with similar life traits to the T. sidoides complex. We used a gamma distribution prior, with a shape parameter 1.0, a scale parameter 1.6 × 10⁻⁹ as prior and we assumed an offset value of 1 × 10⁻⁹ s/s/y.
RESULTS
Morphological analyses
An initial morphological survey of the 42 field collected populations, evidenced that those that presented dark pink flowers consistently had coriaceous leaves; while populations with light pink flowers consistently had membranous leaves. These traits persisted in cultivated plants after several years of growing in similar soil composition, under the same greenhouse conditions. More relevant is that the traits remained constant in the offspring of plants collected in the field and cultivated in the greenhouse. Thus, based on flower color and leave traits two different morphological groups of populations (morphotypes) were established. Moreover, the morphotypes were named as grandense (plants with coriaceous leaves and dark pink flowers), and mercedeño (plants with membranaceous leaves and light pink flowers) in allusion to the different regions where they tend to occur (see below). As a result, from the 72 populations of T. sidoides subsp. carnea analysed, 30 were assigned to the grandense morphotype and, 48 to the mercedeño one (Fig. 2, Supplementary Material - Appendix S1).

Blooming individuals of Turnera sidoides subsp. carnea showing the most remarkable morphological traits of the mercedeño (a) and grandense (b) morphotypes. Note the light pink petal and membranaceous leaves in (a) and the dark pink petal and coriaceous leaves in (b).
Ploidy level estimations
New ploidy levels determinations were done from meiotic chromosome counts and flow cytometry estimations of five populations (Table I, Appendix SI). Two populations were diploids (2n= 2x= 14) and three were tetraploids (2n= 4x= 28). Additionally, the ploidy level for other eight populations were recovered from previous works and compiled in Table I. From the 13 populations with information of ploidy levels, five were diploid, seven tetraploid and one hexaploid. One of the population (ID 10) registered diploid and triploid individuals. The diploid and tetraploid ploidy levels were detected in both morphotypes, while the hexaploid was only found in the mercedeño morphotype.
Geographic distribution and ecological preferences
The analysis of the geographic distribution of populations showed that those belonging to different morphotypes tend to live in disjunct areas (Fig. 1). Populations of the grandense morphotype occurred in the southeastern portion of the subspecies range in Uruguay and south Brazil. They grow in stony soils with grasslands composed of many herb, shrub and treelet species co-occurring within the grass matrix (Pampa province). By contrast, populations of the mercedeño morphotype occurred mainly in the northwest portion of the species range in the undulating landscape of northeastern Argentina and southern Paraguay. This area is covered by subtropical grasslands in the north (Paranaense province) and outcrops of Triassic sandstones with low xerophitic woodlands characterized by species of Prosopis and Acacia towards the south (Espinal province). Some few populations extend eastwards the Uruguay River.
Ecological niche modeling
Most of the bioclimatic variables differed significantly between morphotypes (Supplementary Material - Table SI). The climatic niches inferred using the 4 non-correlated bioclimatic variables and the 55 filtered occurrence dataset are shown in Figure 3. Niche models generated by MaxEnt analysis had AUC 0.95 and 0.98 for grandense and mercedeño morphotypes, respectively, and together with the AICc, indicates that the models performed well at predicting current species distribution.

Potential geographic distributions of the Turnera sidoides subsp. carnea morphotypes based upon maximum entropy niche models using current environmental data and point occurrences. Dots represent the occurrence of mercedeño (a) and grandense (b) morphotypes.
ENMs under current climatic conditions predicted different suitable areas for each of the two morphotypes, with an overlapping zone in northern Uruguay and southwestern Brazil. The predicted areas were consistent with the respective points of occurrence of the two morphotypes and extend somewhat the potential ranges (Fig. 3). The bioclimatic variable that mostly contributed to the models of both morphotypes was the Precipitation of Driest Month (BIO14) (Table II).
Contribution and permutation values for the four variables used in current ENMs for the morphotypes of Turnera sidoides subsp. carnea. Bio 4= Temperature Seasonality (standard deviation × 100), Bio 6= Minimum Temperature of Coldest Month, Bio 14= Precipitation of Driest Month, Bio 18= Precipitation of Warmest Quarter.
The niche overlap of the grandense and mercedeño morphotypes within environmental space (Schoener’s D= 0.37, Hellinger’s-based I= 0.65) was significantly lower than the null hypothesis of niche equivalency (Fig. 4; p < 0.05), indicating that the bioclimatic niches differ more between each morphotype than expected by chance.

Niche overlap evaluated by the identity test. Arrows refer to the actual niche overlap (D and I) as calculated by ENMTools. The dark and light gray columns are calculated by replicates with identity test models.
Nuclear genotyping
The statistics calculated to estimate the genetic diversity for 13 populations of T. sidoides subsp. carnea, eight of the mercedeño and five of the grandense mophotypes, are summarized in Table III. Fifteen (23 %) out of the sixty-six loci detected were polymorphic. The total expected heterozygosity was 0.09 and the total Shannon´s index was 0.21. Populations presented one to eight exclusive bands, except populations ID 8 and ID 12 in which no exclusive bands were recorded. Concerning morphotypes, the mercedeño showed higher values for all the diversity statistics than the grandense morphotype. Also, the exclusive bands were more frequent in the mercedeño (33) than in the grandense (8) morphotype. Despite the greatest genetic variation was observed within morphotypes (Table IV); the structure index was significant and evidenced a moderate genetic differentiation between them (ΦST = 0.17).
Summary statistics of genetic diversity base on 66 RAPD loci for the 13 populations of Turnera sidoides subsp. carnea analyzed. N = simple size; TNB= total number of bands; NEB= number of exclusive bands; PPL= percentage of polymorphic loci; IHe= impartial expected heterozygocity with Lynch & Milligan correction factor; Sh= Shannon´s index; SD= standard deviation.
Hierarchical distribution analysis of genetic variation estimated by AMOVA between and within morphotypes of Turnera sidoides subsp. carnea with RAPD markers and cpDNA sequences. df= Degrees of freedom, SS= sum of squares, VC= variation coefficient, %= percentage of the total variance.
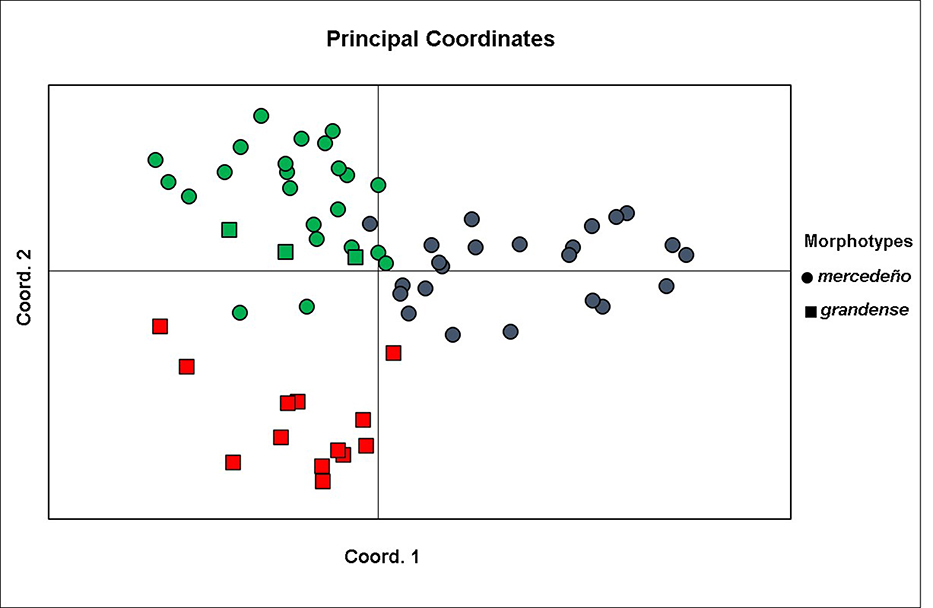
The existence of genetic divergence between morphotypes was supported by the results of STRUCTURE analysis (Fig. 5). The optimal partitioning of the nuclear genetic diversity inferred by the Bayesian clustering was obtained with K= 3. Thus, three well-defined genetic clusters were recognized. Cluster I included almost all individuals belonging to the grandense morphotype (except population ID 20), and it was genetically homogeneous. The other two clusters (II and III) included all individuals of the mercedeño morphotype (plus population ID 20 of the grandense one) and showed more mixture. Cluster II included only populations of the mercedeño morphotype which mostly occur in the Paranaense province, while cluster III include populations that grow in the Espinal province. The PCoA analysis of the genetic data (Fig. 6) showed that the first two coordinates accounted for 51.81 % of variation and clearly separated populations of both morphotypes as different groups. Moreover, within the mercedeño morphotype, populations were arranged in two different genetic groups in consistence with the results of the Bayesian analysis. No significant association between genetic and geographical distances for the subspecies as a whole was shown by the Mantel test (r= -0.03; p= 0.48).

Population structure of Turnera sidoides subsp. carnea inferred by the STRUCTURE software on the basis RAPD markers. a. Each individual is represented by a single vertical bar, which is partitioned into K= 3 colored components that represent each individual’s proportional assignment to one of the genetic clusters. The population ID and the number of each individual analyzed are indicated above its corresponding bar. Arrows mark those individuals of the grandense morphotype which were grouped with mercedeño morphotype. b. Geographic distribution of each genetic cluster inferred in populations analyzed.

Principal coordinates analysis ordination plot of the sample points in the plane of the first two principal axes based on RAPD data of plants of Turnera sidoides subsp. carnea. Colors indicate Bayesian groups resulted from STRUCTURE analysis. Red symbols: Bayesian group I; green symbols: Bayesian group II, and blue symbols: Bayesian group III.
Neighbor-Joining tree (Fig. 7) grouped individuals in two big clusters, Cluster A was formed by almost all individuals belonging to the mercedeño morphotype, plus population ID 20 from the grandense one; while Cluster B was constituted by individuals of the grandense morphotype plus one individual (ID 9.14) of the mercedeño one.

Neighbor-Joining tree constructed with RAPD markers based on Nei and Dice´s genetic distances between individuals from Turnera sidoides subsp. carnea. Dark and grey circles represent individuals assigned to the grandense and the mercedeño morphotypes, respectively. Numbers refer to population and individual`s ID.
Chloroplast genotyping
The concatenated alignment of chloroplast intergenic spacers for the 24 samples (17 populations) resulted in a sequence of 1006 bp in size. From the twenty polymorphic sites retrieved, sixteen corresponded to substitutions and four were indels. Six different haplotypes were recovered, two of them (H5 - H6) were exclusive of the grandense morphotype, and three (H1 - H2- H4) were of the mercedeño morphotype, while the H3 was the only one shared by both morphotypes (Fig. 8, Table V). Nucleotide and haplotype diversity indexes were high for the subspecies and the morphotypes (Table V). AMOVA revealed that 80.32 % of the variation was explained by differences within morphotypes (Table IV); notwithstanding, the fixation index evidenced a great and significant genetic differentiation between morphotypes (Φst= 0.20).

Geographic distribution of cpDNA haplotypes (a) and evolutionary relationships among cpDNA haplotypes using a median-joining network approach (b) of the 17 populations studied of Turnera sidoides subsp. carnea. Circle sizes in the network are proportional to the haplotype frequency, crossed lines are substitutions inferred in the branches and diamonds are median vectors placed by the software.
Summary statistics and haplotypes obtained from intergenic cpDNA sequences analyzed in morphotypes of Turnera sidoides subsp. carnea. S= polymorphic< sites, π= nucleotide diversity, h= haplotype diversity, SD= standard deviation.
Pairwise mismatch distribution was multimodal, with significant SSD and Raggedness index in both morphotypes. In addition, the results of both neutrality tests were not significantly different from zero, neither in the subspecies as a whole, nor within each morphotype (Table VI).
Results of the mismatch distribution analysis and neutrality tests of T. sidoides subsp. carnea and their morphotypes, obtained from intergenic cpDNA sequences.
Genealogical relationships and the geographical distribution of cpDNA haplotypes are shown in Figure 8. The resolution of the network was not sufficient to indicate ancestor-descendant relationships, since five median vectors were required to join the haplotypes. Haplotypes were differentiated each other by several mutational steps, except for H1 which derived from H3 by only one mutation. Despite of the low ancestry-descent information provided by the network, the haplotypes were differentially distributed between morphotypes and, thus, in the geographic range of the subspecies (Fig. 8
The Bayesian tree constructed from the cpDNA clearly reflected two different clusters (Fig. 9). In the first one (cluster I), two subclusters were identified. A larger one (cluster I.a) that included the populations with H1 of the mercedeño morphotype living in the Paranaense province (largely coincident with cluster II of nuclear markers from structure analysis) together with those populations of the grandense morphotype with H3 distributed in southern Brazil and northern Uruguay. A smaller subcluster (cluster I.b) grouped the individuals of northern Uruguay with H5 with the only one of the mercedeño morphotype with H4. The second cluster (cluster II) grouped all the individuals of the mercedeño morphotype with H2 that live in the Espinal province and, it was coincident with cluster III from structure analysis based on nuclear markers. This cluster was distantly associated as a brother group with the southernmost population of the grandense morphotype with H6 haplotype. Thus, the cpDNA reveals three different groups geographically arranged in a north-south direction (Fig. 9).

Bayesian inference tree of Turnera sidoides subsp. carnea based on two plastid DNA intergenic sequences. Posterior probabilities > 50 % are indicated at the beginning of each node. Numbers forward each node show estimates for the ages. Dark and grey circles represent individuals assigned to the grandense and mercedeño morphotypes, respectively. The haplotype found in each individual is pointed to the left.
DISCUSSION
The evolutionary patterns that shaped the unique biodiversity of the complex temperate eco-regions of the Pampa and Campos in the mid-latitude lowlands of South America (Miñarro & Bilenca 2008Miñarro F & Bilenca D. 2008. The Conservation Status of Temperate Grasslands in Central Argentina. Fundación Vida Silvestre Argentina, Special Report, Buenos Aires.) are still largely unknown (Speranza et al. 2007Speranza PR, Seijo JG, Grela IA & Solís Neffa VG. 2007. cpDNA variation in the Turnera sidoides L. complex (Turneraceae): biogeographical implications. J Biogeogr 34: 427-436., Antonelli & Sanmartin 2011Antonelli A & Sanmartin I. 2011. Why are there so many plant species in the Neotropics? Taxon 60: 403-414., Turchetto-Zolet 2013). In the present study we analyzed the diverse T. sidoides subsp. carnea to investigate to what extent the morphological variation is accompanied by genetic differentiation and to make inferences on the processes that may have determined such diversification. The results provided strong evidences that this subspecies is an autopolyploid complex per se, being in an active process of intrasubspecific diversification. The patterns of morphological and genetic differentiation in this subspecies may be partially explained by current climatic and environmental differences, but also by past fragmentation and allopatric differentiation.
The morphological analysis done in T. sidoides subsp. carnea evidenced two discrete morphotypes, named grandense and mercedeño, that could be recognized based on the flower color and the consistency of leaves. The identification of diploid and polyploid populations within each morphotype suggests that the phenotypic diversification was independent of the ploidy level, as was observed at the subspecies level in T. sidoides (Solís Neffa 2000Solís Neffa VG. 2000. Estudios biosistemáticos en el complejo Turnera sidoides L. (Turneraceae, Leiocarpae). Universidad Nacional de Córdoba. Doctoral Thesis.). However, the fact that these traits persisted in plants cultivated under similar greenhouse conditions for several generations evidenced that morphological differences between both morphotypes of T. sidoides subsp. carnea have a high genetic component, as it was previously demonstrated for the morphotypes of other subspecies of the T. sidoides complex (Solís Neffa 2010Solís Neffa VG. 2010. Geographic patterns of morphological variation in Turnera sidoides L. subsp. pinnatifida (Juss. Ex Poir.) Arbo (Turneraceae). Plant Syst Evol 284: 231-253.).
The geographic segregation along the subspecies range observed for individuals of the grandense and mercedeño morphotypes, were concordant with the different habitat preferences resulted from the niche modeling analysis, with a small potential overlapped area (with significant values) in an ecological transition identified between the Paranaense forest and the Campos biome in southern Brazil (Pasos Cordeiro & Hasenack 2009PASOS CORDEIRO JL & HASENACK H. 2009. Cobertura vegetal atual do Rio Grande do Sul. In: Campos Sulinos. Conservaçao e uso sustentável da biodiversidade. Pillar V, Müller SC, Castilhos ZMS & Jacques AVA (Eds), Ministerio do Meio Ambiente, Brasilia.). Field observations confirmed the results of modeling since the grandense morphotype was found in an area with diverse array of Precambrian, Carboniferous and Jurassic rocky soils in the Pampa province, where the main vegetation type is a treeless grasslands dominated by tussock grasses. By contrast, the mercedeño morphotype grows in the interfluvial region between the Paraná and Uruguay Rivers and adjacent regions, on Mesozoic basalt elements and red lateritic clays characterized by medium-tall grass savannas with remnants of subtropical forest of the Paranaense province. Some populations of this morphotype were also found in the southwest of the subspecies range, into the Espinal province in parklands dominated by mimosoid species. The ENM based on bioclimatic variables effectively showed that the grandense and mercedeño morphotypes inhabit regions with significant different climatic regimes. However, other variables (such as soil conditions and species community interactions) may be also contributing to the niche delimitation of both morphotypes that deserves further studies.
Ecological divergence due to habitat differences plays an important role in population differentiation (Foster et al. 2007FOSTER SA, MCKINNON GE, STEANE DA, POTTS BM, VAILLANCOURT RE. 2007. Parallel evolution of dwarf ecotypes in the forest tree Eucalyptus globulus. New Phytol 175: 370-380., Lowry et al. 2008LOWRY DB, ROCKWOOD RC, WILLIS JH. 2008. Ecological reproductive isolation of coast and inland races of Mimulus guttatus. Evolution 62: 2196-2214., Zheng & Ge 2010ZHENG XM & GE S. 2010. Ecological divergence in the presence of gene flow in two closely related Oryza species (Oryza rufipogon and O. nivara). Mol Ecol 19: 2439-2454.). The environmental differences between the areas of T. sidoides subsp. carnea morphotypes would be critical factors in determining their current spatial distribution at regional scale. Moreover, these factors may probably have determined the differentiation of many other components of the biota. Few species that covered the area of T. sidoides subsp. carnea were deeply studied so far to test this hypothesis. Petunia axillaris (Lam.) Britton, Sterns & Poggenb (Solanaceae) is one of them, and the geographic boundary between the areas of two of their subspecies, P. axillaris subsp. axillaris and P. axillaris subsp. parodii (Turchetto et al. 2014TURCHETTO C, FAGUNDES NJR, SEGATTO AL, KUHLEMEIER C, SOLÍS NEFFA VG, SPERANZA PR, BONATTO SL & FREITAS LB. 2014. Diversification in the South American Pampas: the genetic and morphological variation of the widespread Petunia axillaris complex (Solanaceae). Mol Ecol 23: 374-389.) is consistent with the boundary here detected for the morphotypes of T. sidoides subsp carnea. The coincidence of morphological discontinuities supports that past and present environmental factors may have been involved in the divergence of many species of the biota at both sides of a NE – SW axis that coincides with the transition of Paranaense forest and the Campos to the north and, the transition between the savanna and the grasslands toward the south along the eastern shore of the Uruguay River.
The correspondence of phenotypic differentiation with genetic differentiation in T. sidoides subsp. carnea was evaluated both with nuclear and chloroplast markers. The results showed that the highest genetic diversity was within populations and morphotypes in the AMOVA results, as expected for obligate outbreeders (Loveless & Hamrick 1984LOVELESS MD & HAMRICK JL. 1984. Ecological determinants of genetic structure in plant populations. Annu Rev Ecol Syst 15: 65-95., Tsukamoto et al. 2002TSUKAMOTO T, ANDO T, WATANABE H, KOKUBUN H, HASHIMOTO G, SAKAZAKI U, SUÁREZ E, MARCHESI E, OYAMA K & KAO T. 2002. Differentiation in the status of self-incompatibility among Calibrachoa species (Solanaceae). J Plant Res 115:185-193.). Nevertheless, the significant ΦST values evidenced that the 17 % and 20 % of the total nuclear and cpDNA genetic variation, respectively, attributed to differences between morphotypes may be interpreted as the existence of a moderate to high genetic differentiation among the grandense and mercedeño morphotypes. The almost lack of admixture and population clustering in the Bayesian analysis based on nuclear genetic data supports the genetic differentiation between morphotypes. In agreement with the morphotypes geographic range and the major groups delimited by nuclear markers, the cpDNA haplotypes were differentially distributed, that is, H3, H5, and H6 in the grandense morphotype and, H1, H2, H3 and H4 in the mercedeño one. The presence of H3 mostly in the grandense, but also in one population of the mercedeño morphotype, can be more parsimoniously attributed to a common ancestral polymorphism than to a recent hybridization of the morphotypes, considering the current vicariant distribution of the morphotypes and the restrictions for dispersion exhibited by T. sidoides (Solís Neffa 2000Solís Neffa VG. 2000. Estudios biosistemáticos en el complejo Turnera sidoides L. (Turneraceae, Leiocarpae). Universidad Nacional de Córdoba. Doctoral Thesis.). Thus, the results revealed that the phenotypic variation in T. sidoides subsp. carnea is consistent with the genetic differentiation of the morphotypes from a common ancestor.
Interestingly, the molecular data showed further differentiation within the morphotypes. The Bayesian and the PCoA analysis using nuclear markers showed a clear genetic differentiation among populations of the mercedeño morphotype that grow in the Paranaense subtropical grassland from those that live in the Espinal Province. The chloroplast supports the differentiation of populations of the mercedeño morphotype occurring in the Paranaese (with H1, H3 and H4) from those of the Espinal (with H2) provinces, but also clearly segregates populations of the grandense morphotype of southern Brazil (H3) from those of northern (H5) and southern (H6) Uruguay. The genetic basis of the morphological traits distinguishing the grandense and mercedeño morphotypes and their habitat preferences, in combination with their genetic distinction, suggest that the divergent phenotypes in T. sidoides subsp. carnea may be the result of the adaptive response of populations to succeed under different climatic and edaphic regimes.
Moreover, the two clusters and three subclusters revealed by the Bayesian analysis based on chloroplast DNA sequences suggest a latitudinal pattern of population differentiation aside of the main longitudinal pattern observed for nuclear markers and phenotypic traits. This pattern of chloroplast relationship is telling another story in the evolution of T. sidoides subsp. carnea, probably related to the climatic and landscape changes that took place during the Pleistocene (ca. 2.6 – 0.0085 Ma.), as was proposed for T. sidoides complex (Moreno et al. 2018Moreno EMS, Freitas LB, Speranza PR, Solís Neffa VG. 2018. Impact of Neogene geoclimatic events on the genetic structure in mid-latitude South American plants: insights from the phylogeography of Turnera sidoides complex. Bot J Linn Soc 188: 377-390.) and other South American plant species (Mäder et al. 2013Mäder G, Fregonezi JN, Lorenz-Lemke AP, Bonatto SL & Freitas LB. 2013. Geological and climatic changes in Quaternary shaped the evolutionary history of Calibrachoa heterophylla, an endemic South-Atlantic species of Petunia. BMC Evol Biol 13: 178., Longo et al. 2014LONGO D, LORENZ-LEMKE AP, MÄDER G, BONATTO SL & FREITAS LB. 2014. Phylogeography of the Petunia integrifolia complex in southern Brazil. Bot J Linn Soc 174: 199-213., Turchetto et al. 2014TURCHETTO C, FAGUNDES NJR, SEGATTO AL, KUHLEMEIER C, SOLÍS NEFFA VG, SPERANZA PR, BONATTO SL & FREITAS LB. 2014. Diversification in the South American Pampas: the genetic and morphological variation of the widespread Petunia axillaris complex (Solanaceae). Mol Ecol 23: 374-389.).
Evolutionary model
The morphological and genetic data clearly show a structured pattern of variation in T. sidoides subsp. carnea. Although still insufficient to arrive to a conclusive model of diversification of T. sidoides complex and the factors that may have been associated to that process, the data here provided allowed the proposal of hypothetical model to be tested in future studies including additional phenotypic and molecular data.
The results here obtained suggest that present-day patterns of morphological and genetic distribution and diversity in T. sidoides subps. carnea can be the result of ancient vicariant events. Previous studies in T. sidoides proposed the refuge model to explain this mechanism. Consistently with earlier interpretations that the hilly areas of Argentina and Uruguay, as well as some lowland areas may have served as refuges for the flora during the Quaternary cold-dry phases (Ab’Sáber 1977Ab’Sáber AN. 1977. Espaços ocupados pela expansão dos climas secos na America do Sul, por ocasião dos períodos glaciais quaternários. Paleoclimas 3: 1-19., Haffer 1982HAFFER J. 1982. General aspects of the refuge theory. In: Prance GT (Ed), Biological Diversification in the Tropics. New York: Columbia University Press, 6-24.), refugial centres for T. sidoides were hypothesized in the Cuchilla de Haedo, the Cuchilla Grande, Eastern Serranías systems, and in northeastern Argentina (Speranza et al. 2007Speranza PR, Seijo JG, Grela IA & Solís Neffa VG. 2007. cpDNA variation in the Turnera sidoides L. complex (Turneraceae): biogeographical implications. J Biogeogr 34: 427-436., Moreno et al. 2018Moreno EMS, Freitas LB, Speranza PR, Solís Neffa VG. 2018. Impact of Neogene geoclimatic events on the genetic structure in mid-latitude South American plants: insights from the phylogeography of Turnera sidoides complex. Bot J Linn Soc 188: 377-390.), where T. sidoides subsp. carnea occurs.
During the Pleistocene, in the east of the T. sidoides subsp. carnea area, intervals of drier climates caused a retraction and fragmentation of the Atlantic Forest (Rambo 1954RAMBO B. 1954. Análise histórica da flora de Pôrto Alegre. Sellowia 6: 9-112.) as well as the expansion of tropical and subtropical grasslands and savannas (Behling & Lichte 1997BEHLING H & LICHTE M. 1997. Evidence of dry and cold climatic conditions at glacial times in tropical Southeastern Brazil. Quaternary Research 48: 348-358.). These events could promote the isolation of populations of T. sidoides subsp. carnea and the allopatric differentiation of the grandense morphotype. In northeastern Argentina, where the mercedeño morphotype occurs, owing to the rise of the Andes, tectonic movements and active faulting processes, which continued into the Quaternary, have played an important role in the shaping of the present landscape. Just after the tectonic uplift of the Mercedes plateau (140 m. a. s. l.), the Uruguay and Paraná Rivers took their present courses (Popolizio 1999POPOLIZIO E. 1999. Geomorfología. In: Herbst R & Santa Cruz J (Eds), Mapa litoestratigráfico de la Provincia de Corrientes. Capítulo 4. D´Orbignyana, 2ª ed., 17 p.). Also, the Quaternary climate oscillations favored changes in the relief and vegetation of the region (Carnevalli 1994Carnevalli R. 1994. Fitogeografía de la Provincia de Corrientes. Corrientes: Gobierno de la Provincia de Corrientes-INTA.). The climate and vegetation of this area varied from dry conditions with xeric vegetation and mega / mesothermic grasses to more humid conditions with the presence of wetlands, forests, and palm groves. During the Quaternary, the xerophytic and the tropical and subtropical vegetation types would have suffered, alternatively, displacements following a NE-SW direction. During the last interglacial, more humid warm-temperate palm and mimosoid forests would have developed in the area (Barreda et al. 2007BARREDA V ET AL. 2007. Diversificación y cambios de las Angiospermas durante el Neógeno en Argentina. Ameghiniana 715: 173-191., Contreras et al. 2019Contreras SA, Zucol A, Méndez C & Zurita A. 2019. Phytolith analysis in the Pliocene-Pleistocene fluvial sediments from northeastern Argentina. J South Amer Earth Sci 90: 296-313.). Such geomorphological and environmental events could have significant impacts on the distribution and abundance of populations of T. sidoides subsp. carnea, disrupting the subspecies range and confining some populations to a number of isolated regions with particular selective pressures, leading to the differentiation of the mercedeño morphotype and both genetic groups by divergent evolution from an ancestral form. The presence of diploids, both in the morphotypes and the genetic groups of T. sidoides subsp. carnea, supports the hypothesis that the initial morphological and genetic differentiation of the complex occurred at diploid level (Solís Neffa 2000Solís Neffa VG. 2000. Estudios biosistemáticos en el complejo Turnera sidoides L. (Turneraceae, Leiocarpae). Universidad Nacional de Córdoba. Doctoral Thesis., Roggero Luque et al. 2015ROGGERO LUQUE JM, EMS MORENO, IE KOVALSKY, JG SEIJO & VG SOLÍS NEFFA. 2015. Evidence of the occurrence of structural chromosome changes at the initial diploid diversification of the autopolyploid Turnera sidoides L. (Passifloraceae) complex. Genome 10.1139/gen-2015-0096.).
CONCLUSIONS
The present study provides strong evidence on the autopolyploid nature of T. sidoides subsp. carnea, which is in an active process of intrasubspecific diversification. Morphological and genetic data showed that the diversity of T. sidoides subsp. carnea is in congruence with the great past and present abiotic and biotic variability of the mid-latitude South American lowlands. The evolutionary history of this subspecies is consistent with past fragmentation and allopatric differentiation. Geographic isolation and local adaptation would have promoted strong morphological, ecological, and genetic differentiation, resulting in two morphotypes and different genetic groups indicative of incipient speciation
ACKNOWLEDGMENTS
The authors thank the financial support of Argentine National Scientific and Technical Research Council (CONICET; PIP 11220120100192CO), the Argentine National Agency for the Promotion of Science and Technology (ANPCyT; PICT 2012– 1812) and General Secretary of Science and Technology of the National University of Northeast (SGCyT-UNNE; PI-A004/14 and P001/18). G. Via do Pico, J.G. Seijo and V.G. Solís Neffa are members of the Scientific Researcher Career of CONICET.
REFERENCES
- Ab’Sáber AN. 1977. Espaços ocupados pela expansão dos climas secos na America do Sul, por ocasião dos períodos glaciais quaternários. Paleoclimas 3: 1-19.
- Aldrich J, Cherney BW, Merlin E & Christopherson L. 1988. The role of insertion/ deletions in the evolution of the intergenic region between psbA and trnH in the chloroplast genome. Curr Genet 14: 137-146.
- Allouche O, Tsoar A & Kadmon R. 2006. Assessing the accuracy of species distribution models: prevalence, Kappa and the True Skill Statistic (TSS). J Appl Ecol 43: 1223-1232.
- ALVAREZ NMB, PERALTA IE, SALAS A & SPOONER D M. 2008. A morphological study of species boundaries of the wild potato Solanum brevicaule complex: replicated field trials in Peru. Plant Syst Evol 274: 37-45.
- ANDRE TJC, SPECHT C, SALZMAN S, PALMA-SILVA C & WENDT T. 2015. Evolution of species diversity in the genus Chamaecostus (Costaceae): molecular phylogenetics and morphometric approaches. Phytotaxa 204: 265-276.
- Antonelli A & Sanmartin I. 2011. Why are there so many plant species in the Neotropics? Taxon 60: 403-414.
- Aragon E, Goin FJ, Aguilera YE, Woodburne MO, Carlini AA & ROGGIERO MF. 2011. Palaeogeography and palaeoenvironments of northern Patagonia from the Late Cretaceous to the Miocene: the Palaeogene Andean gap and the rise of the NorthPatagonian High Plateau. Biol J Linn Soc 103: 305–315.
- Arbo MM. 1985. Notas taxonómicas sobre Turneráceas sudamericanas. Candollea 40: 175-191.
- Arbo MM. 2008. Systematic studies in Turnera (Turneraceae). IV. Series Leiocarpae. Sessilifoliae y Conciliatae. Bonplandia 17: 107-334.
- BARREDA V ET AL. 2007. Diversificación y cambios de las Angiospermas durante el Neógeno en Argentina. Ameghiniana 715: 173-191.
- Behling H. 2002. Carbon storage increases by major forest ecosystems in tropical South America since the Last Glacial Maximum and the early Holocene. Global Planet Change 33: 107-116.
- BEHLING H & LICHTE M. 1997. Evidence of dry and cold climatic conditions at glacial times in tropical Southeastern Brazil. Quaternary Research 48: 348-358.
- BIZZI LA, SCHOBBENHAUS C, GONÇALVES JH, BAARS FJ, DELGADO IM, ABRAM MB, NETO RL, MATOS GMM & SANTOS JOS. 2001. Geology, tectonics and mineral resources of Brazil: Geographic information system (GIS) and maps at the 1:2500000 scale. CPRM, Brasília, 4 CD-Rom.
- Broennimann O ET AL. 2012. Measuring ecological niche overlap from occurrence and spatial environmental data. Global Ecol Biogeogr 21: 481-497.
- BRÜNGER MO, EINSEHLOR P, FIGUEIREDO MLN & STEHMANN JR. 2015. Resolving species delimitations in the Eugenia involucrata group (Eugenia sect. Phyllocalyx, Myrtaceae) with morphometric analysis. Syst Bot 40: 995-1002.
- Burnham KP & Anderson dr. 2014. P-values are only an index to evidence: 20th- vs. 21st-century statistical science. Ecology 95:627-630.
- Burnham RJ & Graham A. 1999. The history of Neotropical vegetation: new developments and status. Ann Missouri Bot Gard 86: 546-589.
- Cabrera AL. 1971. Fitogeografía de la República Argentina. Bol Soc Argent Bot 14: 1-55.
- Cabrera AL & Willink A. 1973. Biogeografía de América Latina. Washington: Secretaría General OEA.
- Cabrera AL & Willink A. 1980. Biogeografía de América Latina. 2a edición corregida. Monografía 13. Serie de Biología. Secretaría General de la Organización de los Estados Americanos. Washington DC, EEUU, 120 p.
- Carnevalli R. 1994. Fitogeografía de la Provincia de Corrientes. Corrientes: Gobierno de la Provincia de Corrientes-INTA.
- Clapperton CM. 1993. Nature of environmental changes in South America at the Last Glacial Maximum. Palaeogeogr, Palaeoclimatol, Palaeoecol 101: 189-208.
- Colinvaux PA, De Oliveira PE, Moreno JE, Miller MC & Bush MB. 1996a. A long pollen record from lowland Amazonia: forest and cooling in glacial times. Science 274: 85-88.
- Colinvaux PA, Liu KB, de Oliveira PE, Bush MB, Miller MC & KANNAN MS. 1996b. Temperature depression in the lowland tropics in glacial times. Climatic Change 32: 19-33.
- Contreras SA, Zucol A, Méndez C & Zurita A. 2019. Phytolith analysis in the Pliocene-Pleistocene fluvial sediments from northeastern Argentina. J South Amer Earth Sci 90: 296-313.
- Darriba D, Taboada GL, Doallo R & Posada D. 2012. jModel- Test 2: more models, new heuristics and parallel computing. Nat Methods 9: 772.
- Dent AE & von Holdt BM. 2012 Structure Harvester: a website and program for visualizing STRUCTURE output and implementing the Evanno method. Conserv Genet Resour 4: 359-361.
- Drummond AJ, Suchard MA, Xie D & Rambaut A. 2012. Bayesian phylogenetics with BEAUti and the BEAST 1.7. Mol Biol Evol 29: 1969-1973.
- ELÍAS G, SARTOR ME & SOLÍS NEFFA VG. 2011. Patterns of cytotype variation of Turnera sidoides subsp. pinnatifida (Turneraceae) in mountain ranges of central Argentina. J Pl Res 124: 25-34.
- Evanno G, Regnaut S & Goudet J. 2005. Detecting the number of clusters of individuals using the software structure: a simulation study. Mol Ecol 14: 2611-2620.
- Excoffier L, Smouse PE & Quattro JM. 1992. Analysis of molecular variance inferred from metric distances among DNA haplotypes: application to human mitochondrial DNA restriction data. Genetics 131: 479-494.
- Excoffier L & Lischer HEL. 2010. Arlequin suite ver 3.5: a new series of programs to perform population genetics analyses under Linux and Windows. Mol Ecol Res 10: 564-567.
- Fernández A. 1987. Estudios cromosómicos en Turnera y Piriqueta (Turneraceae). Bonplandia 6: 1-21.
- Fielding AH & Bell JF. 1997. A review of methods for the assessment of prediction errors in conservation presence/absence models. Environ Conserv 24: 38-49.
- FOSTER SA, MCKINNON GE, STEANE DA, POTTS BM, VAILLANCOURT RE. 2007. Parallel evolution of dwarf ecotypes in the forest tree Eucalyptus globulus. New Phytol 175: 370-380.
- Fu YX. 1997. New statistical tests of neutrality for DNA samples from a population. Genetics 147: 915-925.
- Guindon S & Gascuel O. 2003. A simple, fast, and accurate algorithm to estimate large phylogenies by maximum likelihood. Syst Biol 52: 696-704.
- Graham A. 2009. The Andes: a geological overview from a biological perspective. Ann Missouri Bot Gard 96: 371-385.
- Grela IA. 2004. Geografía florística de las especies arbóreas de Uruguay: propuesta para la delimitación de dendrofloras. Master´s Thesis. Programa de Desarrollo de las Ciencias Básicas, Ministerio de Educación y Cultura, Universidad de la República, Montevideo, Uruguay.
- HAFFER J. 1982. General aspects of the refuge theory. In: Prance GT (Ed), Biological Diversification in the Tropics. New York: Columbia University Press, 6-24.
- HAMMER Ø, HARPER DAT & RYAN PD. 2001. PAST: Paleontological Statistics Software Package for Education and Data Analysis. Palaeontologia Electronica 4: 9p. 178kb. http://palaeo-electronica.org/2001_1/past/issue1_01.htm.
- HARPENDING HC. 1994. Signature of ancient population growth in a low-resolution mitochondrial DNA mismatch distribution. Hum Biol 66: 591-600.
- He Q, Edwards DL, Knowles LL. 2013. Integrative testing of how environments from the past to the present shape genetic structure across landscapes. Evolution 67: 3386-3402.
- Hijmans RJ, Cameron SE, Parra JL, Jones PG & Jarvis A. 2005. Very high resolution interpolated climate surfaces for global land areas. Int J Climatol 25: 1965-1978.
- HOLMGREN PK, HOLMGREN NH & BARNETT LC. 1990. Index herbariorum, Part I: The herbaria of the world, 8th ed., New York Botanical Garden, New York.
- Iriondo M. 1993. Geomorphology and late Quaternary of the Chaco (South America). Geomorphology 7: 289-303.
- Iriondo M. 1999. Climatic changes in the South American plains: records of a continent-scale oscillation. Quatern Int 57-58: 93-112.
- Iriondo M & Paira A. 2007. Physical geography of the Basin. In: The Middle Paraná River: Limnology of a Subtropical Wetland. Iriondo M & Paira A (Eds), Springer, 7-858, 31 p.
- Johnson JB & Omland KS. 2004. Model selection in ecology and evolution. Trends Ecol Evol 19: 101-108.
- Kass JM, Vilela B, Aiello-Lammens ME, Muscarella R, Merow C & Anderson RP. 2018. Wallace: A flexible platform for reproducible modeling of species niches and distributions built for community expansion. Methods Ecol Evol 9: 1151-1156.
- Kelchner SA. 2000. The evolution of non-coding chloroplast DNA and its application in plant systematics. Ann Missouri Bot Gard 87: 482-298.
- Kovalsky IE & Solís Neffa VG. 2012. Evidence of 2n microspore production in a natural diploid population of Turnera sidoides subsp. carnea and its relevance in the evolution of the T. sidoides (Turneraceae) autopolyploid complex. J Plant Res 125: 725-734.
- Kovalsky IE, Roggero Luque JM, Elias G, Fernández SA & Solis Neffa VG. 2017. The role of triploids in the origin and evolution of polyploids of Turnera sidoides complex (Passifloraceae, Turneroideae). J Plant Res 131: 77-89.
- Lagomarsino LP, Condamine FL, Antonelli A, Mulch A & Davis CC. 2016. The abiotic and biotic drivers of rapid diversification in Andean bellflowers (Campanulaceae). New Phytol 210: 1430-1442.
- Lavina EL & Fauth G. 2011. Evolução Geológica da América do Sul nos Últimos 250 Milhões de Anos. In: Biogeografia América do Sul Padrões e Processos (eds de Carvalho CJB, Almeida EAB), p. 3-13. Roca Ltda, Sao Paulo.
- Librado P & Rozas J. 2009. DnaSP v5: A software for comprehensive analysis of DNA polymorphism data. Bioinformatics 25: 1451-1452.
- LONGO D, LORENZ-LEMKE AP, MÄDER G, BONATTO SL & FREITAS LB. 2014. Phylogeography of the Petunia integrifolia complex in southern Brazil. Bot J Linn Soc 174: 199-213.
- LOVELESS MD & HAMRICK JL. 1984. Ecological determinants of genetic structure in plant populations. Annu Rev Ecol Syst 15: 65-95.
- LOWRY DB, ROCKWOOD RC, WILLIS JH. 2008. Ecological reproductive isolation of coast and inland races of Mimulus guttatus. Evolution 62: 2196-2214.
- Lynch M & Milligan BG. 1994. Analysis of population structure with RAPD markers. Mol Ecol 3: 91-99.
- Mäder G, Fregonezi JN, Lorenz-Lemke AP, Bonatto SL & Freitas LB. 2013. Geological and climatic changes in Quaternary shaped the evolutionary history of Calibrachoa heterophylla, an endemic South-Atlantic species of Petunia. BMC Evol Biol 13: 178.
- MANTEL N. 1967. The detection of disease clustering and a generalized regression approach. Cancer Res 27: 209-220.
- MAUBECIN C, COSACOV A, SÉRSIC AN, FORNONI J & BENÍTEZ-VIEYRA S. 2016. Drift effects on the multivariate floral phenotype of Calceolaria polyrhiza during a postglacial expansion in Patagonia. J Evol Biol 29: 1523-1534.
- Miller MP. 2005. Alleles In Space (AIS): Computer Software for the Joint Analysis of Interindividual Spatial and Genetic Information. J Heredity 96(6): 722-724.
- Miñarro F & Bilenca D. 2008. The Conservation Status of Temperate Grasslands in Central Argentina. Fundación Vida Silvestre Argentina, Special Report, Buenos Aires.
- Moreno EMS, Freitas LB, Speranza PR, Solís Neffa VG. 2018. Impact of Neogene geoclimatic events on the genetic structure in mid-latitude South American plants: insights from the phylogeography of Turnera sidoides complex. Bot J Linn Soc 188: 377-390.
- MORRONE JJ. 2000. What is the Chacoan Region? Neotropica 46: 51-68.
- MORRONE JJ. 2006. Biogeographic areas and transition zones of Latin American and the Caribbean islands based on panbiogeographic and cladistic analyses of the entomofauna. Ann Rev Entomol 51: 467-494.
- Morrone JJ. 2014. Biogeographical regionalisation of the Neotropical region. Zootaxa 3782: 1-110.
- Myers N, Mittermeier RA, Mittermeier CG, da Fonseca GAB & Kent J. 2000. Biodiversity Hotspots for Conservation Priorities. Nature 403: 853-858.
- Nei M. 1972. Genetic distance between populations. Amer Naturalist 106: 283-392.
- OYARZABAL M ET AL. 2018. Unidades de vegetación de la Argentina. Ecol Austral 28: 40-63.
- Panseri AF. 2011. Estructura genética y variación de los caracteres reproductivos en Turnera sidoides subsp. pinnatifida (Turneaceae). Universidad Nacional del Nordeste, FCA. Doctoral Thesis.
- Paruelo JM, Jobbágy EG, Oesterheld M, Golluscio RA & Aguiar MR. 2007. The grasslands and steppes of Patagonia and the Rio de la Plata plains. In: Veblen T, Young K & Orme A (Eds), The physical geography of South America. The Oxford Regional Environments Series. Oxford University Press, p. 232-248 (Chapter 14).
- PASOS CORDEIRO JL & HASENACK H. 2009. Cobertura vegetal atual do Rio Grande do Sul. In: Campos Sulinos. Conservaçao e uso sustentável da biodiversidade. Pillar V, Müller SC, Castilhos ZMS & Jacques AVA (Eds), Ministerio do Meio Ambiente, Brasilia.
- Pavlicek A, Hrda S & Flegr J. 1999. Free Tree: Freeware Program for Construction of Phylogenetic Trees on the Basis of Distance Data and Bootstrap/ Jackknife Analysis of the Tree Robustness. Application in the RAPD Analysis of Genus Frenkelia. Folia Biol (Praha) 45: 97-9.
- Peakall R & Smouse PE. 2012. GenAlEx 6.5: genetic analysis in Excel. Population genetic software for teaching and research—an update. Bioinformatics 28: 2537-2539.
- Phillips SJ, Anderson RP & Schapire RE. 2006. Maximum entropy modeling of species geographic distributions. Ecol Model 190: 231-259.
- Phillips SJ, Anderson RP, Dudík M, Schapire RE & Blair M. 2017. Opening the black box: an open-source release of MaxEnt. Ecography 40: 887-893.
- Pinheiro F, Dantas-Queiroz MV & Palma-Silva C. 2018. Plant Species Complexes as Models to Understand Speciation and Evolution: A Review of South American Studies. Crit Rev Plant Sci 37: 54-80.
- POPOLIZIO E. 1999. Geomorfología. In: Herbst R & Santa Cruz J (Eds), Mapa litoestratigráfico de la Provincia de Corrientes. Capítulo 4. D´Orbignyana, 2ª ed., 17 p.
- PRITCHARD JK, STEPHENS M & DONNELLY P. 2000. Inference of population structure using multilocus genotype data. Genetics 155: 45-959.
- QGIS Development Team. 2018. QGIS Geographic Information System. Open Source Geospatial Foundation Project. http://qgis.osgeo.org
» http://qgis.osgeo.org - R Core Team. 2014. R: A language and environment for statistical computing. R Foundation for Statistical Computing, Vienna, Austria. URL http://www.R-project.org/
» http://www.R-project.org/ - Rambaut A. 2009. FigTree v1.3.1. Available at: http://tree.bio ed.ac.uk/software/figtree.
» http://tree.bio - Rambaut A & Drummond AJ. 2009. Tracer version 1.5. Available at: http://beast.bio.ed.ac.uk
» http://beast.bio.ed.ac.uk - RAMBO B. 1954. Análise histórica da flora de Pôrto Alegre. Sellowia 6: 9-112.
- Ramos-Fregonezi AM, Fregonezi JN, Cybis GB, Fagundes NJ, Bonatto SL & Freitas LB. 2015. Were sea level changes during the Pleistocene in the South Atlantic Coastal Plain a driver of speciation in Petunia (Solanaceae)? BMC Evol Biol 15: 92.
- Rannala B & Yang Z. 1996. Probability distribution of molecular evolutionary trees: a new method of phylogenetic inference. J Mol Evol 43: 304-311.
- Rogers AR & Harpending HC. 1992. Population growth makes waves in the distribution of pairwise genetic differences. Mol Biol Evol 9: 552-569.
- ROGGERO LUQUE JM, EMS MORENO, IE KOVALSKY, JG SEIJO & VG SOLÍS NEFFA. 2015. Evidence of the occurrence of structural chromosome changes at the initial diploid diversification of the autopolyploid Turnera sidoides L. (Passifloraceae) complex. Genome 10.1139/gen-2015-0096.
- Saitou N & Nei M. 1987. The neighbor-joining method: a new method for reconstructing phylogenetic trees. Mol Biol Evol 4: 406-425.
- Schneider S & Excoffier L. 1999. Estimation of past demographic parameters from the distribution of pairwise differences when the mutation rates vary among sites: Application to human mitochondrial DNA. Genetics 152: 1079-1089.
- Schoener TW. 1968. The Anolis lizards of Bimini: Resource partitioning in a complex fauna. Ecology 49: 704-726.
- SHANNON C & WEAVER W. 1949. The mathematical theory of communication. University of Illinois Press, Urbana.
- Simmons MP & Ochoterena H. 2000. Gaps as characters in sequence-based phylogenetic analyses. Syst Biol 49: 369-381.
- Solís Neffa VG. 2000. Estudios biosistemáticos en el complejo Turnera sidoides L. (Turneraceae, Leiocarpae). Universidad Nacional de Córdoba. Doctoral Thesis.
- Solís Neffa VG. 2010. Geographic patterns of morphological variation in Turnera sidoides L. subsp. pinnatifida (Juss. Ex Poir.) Arbo (Turneraceae). Plant Syst Evol 284: 231-253.
- Solís Neffa VG & Fernández A. 2001. Cytogeography of the Turnera sidoides L. complex (Turneraceae, Leiocarpae). Bot J Lin Soc 137: 189-196.
- SOLÍS NEFFA VG, PANSERI AF, REYNOSO W & SEIJO JG. 2004. Variación del color de flores y números cromosómicos en el noroeste del área de distribución de Turnera sidoides (Turneraceae). Bonplandia 13: 117-128.
- Speranza PR, Seijo JG, Grela IA & Solís Neffa VG. 2007. cpDNA variation in the Turnera sidoides L. complex (Turneraceae): biogeographical implications. J Biogeogr 34: 427-436.
- TAJIMA F. 1989. Statistical method for testing the neutral mutation hypotesis by DNA polymorphism. Genetics 123: 585-595.
- Tamura K, Peterson D, Peterson N, Stecher G, Nei M & Kumar S. 2011. MEGA5: Molecular evolutionary genetics analysis using Maximum Likelihood, Evolutionary Distance, and Maximum Parsimony methods. Mol Biol 28: 2731-2739.
- TSUKAMOTO T, ANDO T, WATANABE H, KOKUBUN H, HASHIMOTO G, SAKAZAKI U, SUÁREZ E, MARCHESI E, OYAMA K & KAO T. 2002. Differentiation in the status of self-incompatibility among Calibrachoa species (Solanaceae). J Plant Res 115:185-193.
- TURCHETTO C, FAGUNDES NJR, SEGATTO AL, KUHLEMEIER C, SOLÍS NEFFA VG, SPERANZA PR, BONATTO SL & FREITAS LB. 2014. Diversification in the South American Pampas: the genetic and morphological variation of the widespread Petunia axillaris complex (Solanaceae). Mol Ecol 23: 374-389.
- TURCHETTO-ZOLET AC, PINHEIRO F, SALGUEIRO F, PALMA-SILVA C. 2013. Phylogeographical patterns shed light on evolutionary process in South America. Mol Ecol 22: 1193-1213.
- Van Der SluiJs S. 1971. The native grasslands of the mesopotamian region of Argentina notherlands. J Agric Sci 19: 3-22.
- Waechter JL. 2002. Padroẽs geográficos na flora atual do Rio Grande do Sul. Ciência Ambiente 24: 93-108.
- Warren DL, Glor RE & Turelli M. 2008. Environmental niche equivalency versus conservatism: quantitative approaches to niche evolution. Evolution 62: 2868-2883.
- Warren DL, Glor RE & Turelli M. 2010. ENMTools: A toolbox for comparative studies of environmental niche models. Ecography 33: 607-611.
- Warren DL & Seifert SN. 2011. Ecological niche modeling in MaxEnt: the importance of model complexity and the performance of model selection criteria. Ecol App 212: 335-342.
- Weir BS & Cockerham CC. 1984. Estimating F-statistics for the analysis of population structure. Evolution 38: 1358-1370.
- Xu B, Sun G, Wang X, Lu J, Wang IJ & Wang Z. 2017. Population genetic structure is shaped by historical, geographic, and environmental factors in the leguminous shrub Caragana microphylla on the Inner Mongolia Plateau of China. BMC Plant Biol 17:200.
- Zamudio KR, Bellb RC & Masona NA. 2016. Phenotypes in phylogeography: Species’ traits, environmental variation, and vertebrate diversification. PNAS 113: 8041-8048.
- ZHENG XM & GE S. 2010. Ecological divergence in the presence of gene flow in two closely related Oryza species (Oryza rufipogon and O. nivara). Mol Ecol 19: 2439-2454.
Publication Dates
-
Publication in this collection
30 Aug 2021 -
Date of issue
2021
History
-
Received
6 July 2020 -
Accepted
27 Dec 2020