Abstracts
OBJECTIVE: To examine the effect of different doses of triiodothyronine (T3) on mRNA levels of thyroid hormone receptors, TRα and TRβ, at different times. MATERIALS AND METHODS: 3T3-L1 adipocytes were incubated with T3 (physiological dose: F; supraphysiological doses: SI or SII), or without T3 (control, C) for 0.5, 1, 6, or 24h. TRα and TRβ mRNA was detected using real-time polymerase chain reaction. RESULTS: F increased TRβ mRNA levels at 0.5h. After 1h, TRα levels increased with F and SI and TRβ levels decreased with SII compared with C, F, and SI. After 6h, both genes were suppressed at all concentrations. In 24h, TRα and TRβ levels were similar to those of C group. CONCLUSIONS: T3 action with F began at 1h for TRα and at 0.5h for TRβ. These results suggest the importance of knowing the times and doses that activate T3 receptors in adipocytes.
TRα; TRβ; triiodothyronine; adipocytes
OBJETIVO: Examinar o efeito de diferentes doses de triiodotironina (T3) sobre a expressão gênica dos receptores TRα e TRβ em diferentes tempos. MATERIAIS E MÉTODOS: Adipócitos, 3T3-L1, foram incubados com T3 nas doses fisiológica (F, 10nM) e suprafisiológicas (SI, 100nM ou SII, 1000nM) ou veículo (controle, C) durante 0,5, 1, 6 ou 24h. mRNA dos TRs foram detectados utilizando PCR em tempo real. RESULTADOS: Níveis de TRβ aumentaram em F em 0,5h. Após 1h, níveis de TRα aumentaram em F e SI comparado ao C, enquanto TRβ diminuiu no SII comparado com C, F, e SI. Após 6h, ambos os genes foram suprimidos em todas concentrações. Em 24h, níveis de TRα e TRβ retornaram aos do C. CONCLUSÕES: Ação do T3 em F iniciou-se em 1h para TRα e 0,5h para TRβ. Esses resultados são importantes para determinar tempo inicial e dose de T3 em que os receptores de HT são ativados em adipócitos.
TRα; TRβ; triiodotironina; adipócitos
ORIGINAL ARTICLE
Modulation of thyroid hormone receptors, TRα and TRβ, by using different doses of triiodothyronine (T3) at different times
Modulação dos receptores de hormônio tireoidiano, TRα e TRβ, utilizando diferentes doses de triiodotironina (T3) em diferentes tempos
Miriane de OliveiraI; Renata de Azevedo Melo LuvizottoI; Regiane Marques Castro OlimpioI; Maria Teresa de SibioI; Carolina Biz Rodrigues SilvaII; Sandro José CondeI; Carlos Roberto PadovaniIII; Célia Regina NogueiraI
IDepartment of Internal Clinic, Botucatu Medicine School, São Paulo State University (Unesp), Botucatu, SP, Brazil
IIDepartment of Physiology, São Paulo Federal University (Unifesp), São Paulo, SP, Brazil
IIIDepartment of Biostatistics, Biosciences Institute, Unesp, Botucatu, SP, Brazil
Correspondence to Correspondence to: Miriane de Oliveira Universidade Estadual Paulista, Faculdade de Medicina Distrito de Rubião Jr s/n 18618-000 Botucatu, SP, Brazil miriane.deoliveira@yahoo.com.br
ABSTRACT
OBJECTIVE: To examine the effect of different doses of triiodothyronine (T3) on mRNA levels of thyroid hormone receptors, TRα and TRβ, at different times.
MATERIALS AND METHODS: 3T3-L1 adipocytes were incubated with T3 (physiological dose: F; supraphysiological doses: SI or SII), or without T3 (control, C) for 0.5, 1, 6, or 24h. TRα and TRβ mRNA was detected using real-time polymerase chain reaction.
RESULTS: F increased TRβ mRNA levels at 0.5h. After 1h, TRα levels increased with F and SI and TRβ levels decreased with SII compared with C, F, and SI. After 6h, both genes were suppressed at all concentrations. In 24h, TRα and TRβ levels were similar to those of C group.
CONCLUSIONS: T3 action with F began at 1h for TRα and at 0.5h for TRβ. These results suggest the importance of knowing the times and doses that activate T3 receptors in adipocytes.
Keywords: TRα; TRβ; triiodothyronine; adipocytes
RESUMO
OBJETIVO: Examinar o efeito de diferentes doses de triiodotironina (T3) sobre a expressão gênica dos receptores TRα e TRβ em diferentes tempos.
MATERIAIS E MÉTODOS: Adipócitos, 3T3-L1, foram incubados com T3 nas doses fisiológica (F, 10nM) e suprafisiológicas (SI, 100nM ou SII, 1000nM) ou veículo (controle, C) durante 0,5, 1, 6 ou 24h. mRNA dos TRs foram detectados utilizando PCR em tempo real.
RESULTADOS: Níveis de TRβ aumentaram em F em 0,5h. Após 1h, níveis de TRα aumentaram em F e SI comparado ao C, enquanto TRβ diminuiu no SII comparado com C, F, e SI. Após 6h, ambos os genes foram suprimidos em todas concentrações. Em 24h, níveis de TRα e TRβ retornaram aos do C.
CONCLUSÕES: Ação do T3 em F iniciou-se em 1h para TRα e 0,5h para TRβ. Esses resultados são importantes para determinar tempo inicial e dose de T3 em que os receptores de HT são ativados em adipócitos.
Descritores: TRα; TRβ; triiodotironina; adipócitos
INTRODUCTION
Thyroid hormones (TH) influence the metabolism and development of adipose tissue by modulating the proliferation and differentiation of adipocytes (1). TH action is mediated mainly by the modification of gene expression by nuclear receptors, which are transcriptional factors regulated by ligands that adhere to the chromatin (2). TH receptors (TR) are proteins that belong to the nuclear hormone receptor superfamily. These receptors originate from the genes for TR alpha (TRα) and TR beta (TRβ) (3,4) that, in humans, are located on chromosomes 17 and 3, respectively.
According to Yen (5) and Obregon (6), adipose tissue represents an important target for TH because it expresses TRα and TRβ. THs are regarded as important factors in the regulation of the development and function of adipose tissue (5,7,8). It has been shown that TRs are expressed in both white and brown adipose tissue. However, there have been no studies on the modulation of TRs by different doses of triiodothyronine (T3) at different times.
In this study, we evaluated the effects of different doses and times of T3 on the expression levels of TRs. We observed that TRβ was modulated by T3 starting at 0.5h, and TRα was modulated later, starting at 1h.
MATERIALS AND METHODS
Cell culture and differentiation
The experimental protocol was approved by the Ethics Committee on Animal Experiments of the Botucatu School of Medicine-UNESP (protocol nº 752).
For the in vitro study, the 3T3-L1 cell line was used. These cells were acquired from the Cell Bank of the Rio de Janeiro Federal University (UFRJ) and were cultured in Dulbecco's Modified Eagle's Medium (DMEM) (Gibco®, Life Technologies Corporation, Grand Island, NY, USA) was supplemented with 10% fetal bovine serum (FBS) (Gibco®, Life Technologies Corporation), 1% antibiotic/antimycotic (Sigma-Aldrich Co. LLC, St. Louis, MO, USA) agent, under an atmosphere of 5% CO2 at 37°C. Cells were maintained in these culture conditions until they reached approximately 100% confluency, and were subsequently transferred to 6-well plates. After reaching 100% confluency in the wells, cells were submitted to the differentiation process, during which they remained for 3 days in DMEM containing 10% FBS, 100 mM 1-methyl-3-isobutilxanthine (IBMX) (Sigma-Aldrich Co. LLC), 1 mM dexamethasone (Sigma-Aldrich Co. LLC), and 5 mg/L insulin (Sigma-Aldrich Co. LLC). After this period, cells were maintained for 7 days in DMEM containing 10% FBS and 5 mg/mL insulin. Following the period of cell differentiation, adipocytes were subjected to TH depletion for 36 h in DMEM supplemented with charcoal-stripped fetal serum (Sigma-Aldrich Co. LLC). Subsequently, cells were treated with a physiological dose of T3 (10 nM, which is hereafter referred to as F) or supraphysiological doses of T3 (100 nM and 1000 nM, which are hereafter called SI and SII, respectively) for 0.5, 1, 6, or 24h. A non-treated group, only 0.1% NaOH (diluent T3), was used as control (C).
Oil red O staining
After 10 days of differentiation, the culture medium was removed, and the cells were washed twice with phosphate-buffered saline. Subsequently, 1 mL of formaldehyde was added, and the cells were incubated for 30 min at room temperature, and then washed 3 times with phosphate-buffered saline. Thereafter, 300 µL of Oil Red O dye (Sigma-Aldrich Co. LLC) was added, and the cells were incubated for 2h at 37°C. After that period, cells were washed 3 times with distilled water and placed in an incubator to dry. Cells were observed under a microscope in order to verify differentiation by red coloring of the adipose cells.
Gene expression
Total RNA was extracted from the 3T3-L1 cells with the TRIzol reagent (Life Technologies Corporation) according to the manufacturer's instructions. The High Capacity cDNA Reverse Transcription Kit for RT-PCR® (Life Technologies Corporation) was used to synthesize 20 µL of cDNA from 1000 ng of total RNA.
TRα and TRβ mRNA levels (Table 1) were determined by real-time polymerase chain reactions (RT-qPCR). Quantitative measurements were performed with Applied Biosystems StepOne Plus detection system with the TaqMan qPCR commercial kit (Life Technologies Corporation) according to the manufacturer's instructions. The amplification conditions were as follows: enzyme activation at 50°C for 2 min, denaturation at 95°C for 10 min. The cDNA products were amplified by 40 cycles of denaturation at 95°C for 15 s, and annealing/extension at 60°C for 1 min. All assays were performed in triplicate. Levels of gene expression were quantified relative to group C value, after normalization with the internal control (cyclophilin) by the 2-ΔΔCt method, as described elsewhere (9).
Statistical analysis
The differences between TRα and TRβ mRNA levels for all experiments were assessed by Student's t-test. Differences of TRα and TRβ gene expression for different T3 doses at each moment were assessed by one-way analyses of variance (ANOVA) followed by Tukey's test. Data are expressed as mean ± standard deviation. Significance level was set at 5%.
RESULTS
Figure 1A shows 3T3-L1 cells prior to differentiation. In the presence of the differentiation cocktail (insulin, dexamethasone, and IBMX), cells differentiated from preadipocytes into adipocytes that had the morphology of mature adipocytes, characterized by a large quantity of lipid droplets in the cytoplasm (Figures 1B and C). These droplets become more evident with the oil red staining (Figure 1C), as the lipids get stained in red.
Differential expression of TRα and TRβ in adipocytes
Data obtained in the current study show differential expression of TRα and TRβ levels in adipocytes. TRα expression levels were higher in comparison with TRβ for all groups (Table 2).
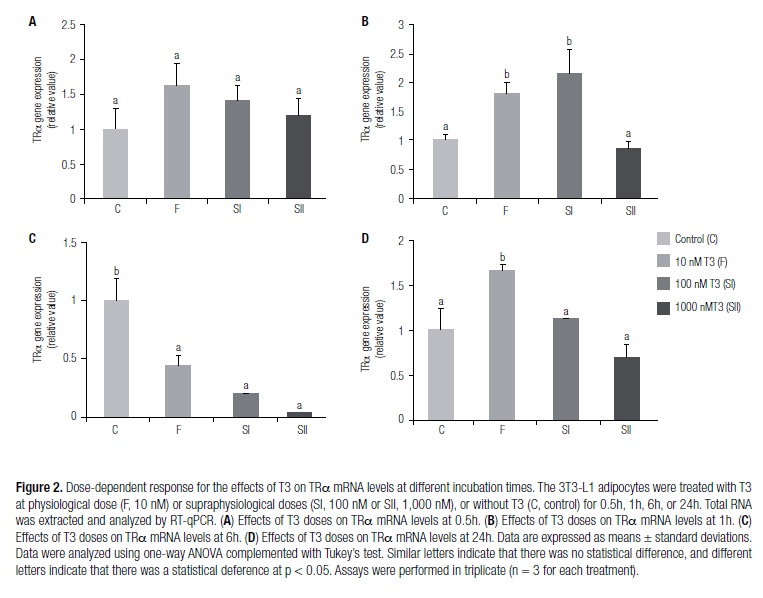
Different concentrations of T3 modulated TRα mRNA levels at different time periods
Figure 2 shows the modulation of TRα mRNA levels in the 3T3-L1 adipocytes in the absence (C group) or presence of T3 (F, SI, and SII groups) at different moments (0.5, 1, 6, or 24h), as measured by RT-qPCR. The different concentrations of T3 did not affect the levels of mRNA expression of the TRα gene in the 0.5-h treatment period (Figure 2A). TRα expression levels were higher at 1h of treatment in the SI and F groups in comparison with the C and SII groups (Figure 2B). At the 6-h time point, TRα gene expression levels decreased in groups F, SI, and SII in comparison with group C (Figure 2C). TRα levels were increased in treatment group F at 24h compared with C. However, there was a decrease in the SI and SII groups in comparison with the increase that was observed in F (Figure 2D).
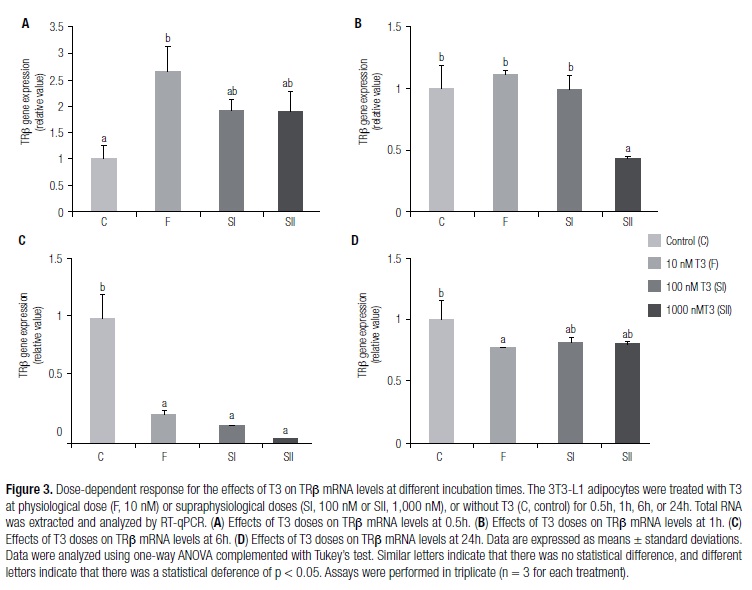
Different concentrations of T3 modulated TRβ mRNA levels at different time periods
Figure 3 shows the modulation of TRβ mRNA levels in the 3T3-L1 adipocytes in the absence (C group) or presence of T3 (F, SI, and SII groups) at different periods (0.5, 1, 6, or 24h), as measured by RT-qPCR. There was an increase in TRβ mRNA levels in F group when compared with those of C, at 0.5h (Figure 3A). At 1h, suppression in the levels of TRβ gene expression was evident in SII compared with those of groups C, F, and SI (Figure 3B). At 6h, decrease in TRβ mRNA levels was observed in groups F, SI, and SII compared with those of group C (Figure 3C). At 24h, TRβ levels decreased in F group when compared with C (Figure 3D).
DISCUSSION
Lipid metabolism is closely associated with a number of health problems; the regulation of adipocytes represents an emerging area of interest. The adipose tissue, which is a target of TH, shows the expression of thyroid receptors that are considered important factors in the regulation of the development and function of this tissue (5,7,8).
The present study was designed to elucidate the effects of T3 on TRα and TRβ mRNA expression levels in adipose tissue, without the interference of systemic factors. As experimental models, we used the 3T3-L1 cell line, embryonic cells from Mus musculus (Figure 1A), and differentiated in vitro adipocytes (Figures 1B and C) because they represent well-established models for adipogenesis (10). Furthermore, we quantified TRα and TRβ mRNA levels by RT-qPCR.
The TRα gene is widely expressed in the early stages of development, while the TRβ gene is restricted to the late stages of embryogenesis when it is induced in the brain, pituitary gland, and other tissues (11). We observed that TRα mRNA levels were much higher than TRβ mRNA levels in 3T3-L1 adipocytes (Table 2), in agreement with other authors (12). The differential expression of TR genes suggests that they may mediate distinct functions (13). It has been shown that TRα1 is critical in thermoregulation via regulation at the level of local, via central regulation, or both, whereas TRβ seems to be more involved in the regulation of lipid metabolic pathways (14). Moreover, although TRα and TRβ are similar in the DNA and ligand domains (15), there are fundamental differences in the ligand-binding domain that, nowadays, have enabled the design of ligands that specifically interact with TRα or TRβ, and these have been important tools of isoform-specific actions (16).
We observed that the modulation of the levels of TRα by different doses of T3 was initiated after 1h of treatment when the physiological dose of 10 nM (17) that was given to group F increased the levels of TRα compared with those of groups C and SI. The TRα expression levels in the SII group remained unchanged compared with group C (Figure 2A). We can speculate that this consistency in the TRα expression levels in the SII group was due to a downregulation of this receptor because this group showed a decrease in TRα levels compared with groups F and SI. The downregulation process occurred due to the exposure of the cells to high doses of TH (18).
Monden and cols. (19) observed a decrease in TRα mRNA levels in human medulloblastoma cells (HTB-185) at a dose of 100 nM, which was the same dose used in the SI group for 24h. In the present study, we also observed a reduction in TRα in this group compared with the T3 physiological levels that were administrated to group F. However, group F had increased TRα levels compared with group C, and group SII was decreased relative to F (Figure 2D).
Kanamori e Brown (20) showed that T3 modulated the TRα mRNA expression levels in tadpoles, but it had no effect on the epithelial cell culture of embryonic Xenopus laevis (XL-177) incubated with T3 for 24h at a concentration of 5 nM. These findings do not corroborate our results, which may be due to the use of a different experimental model and of a T3 dose that was lower than that used in our experiments.
Jiang and cols. (12) analyzed the TRα expression levels during the differentiation period of 3T3-L1 cells in the absence or presence of T3 at a concentration of 100 nM. Although the treated group had a higher accumulation of triglycerides, the TRα expression levels were similar for both treated and untreated cells, different from our results, and probably because mRNA quantification by semi-quantitative PCR is less sensitive than that done with RT-qPCR.
We observed an increase in TRβ mRNA levels in group F after 0.5-h incubation, but not for TRα (Figure 3A). This led us to speculate that at 0.5h, T3 bound to its receptor α, which is more abundant in adipocytes, resulting in an increased transcription of TRβ. After the 1-h incubation, we observed a decrease in TRβ levels in group SII relative to the other groups (Figure 3B), which indicated a decrease of thyroid receptors in the presence of high doses of T3.
Increasing the incubation period to 6h, we observed a suppression of TRβ in the F, SI, and SII groups compared with those in the C group, which was the same observed for TRα (Figures 3C and 2C). If the transcription of TRβ depends on the binding of T3 to TRα, that would explain the decreased levels of TRβ at this incubation time.
At 24h, only the F group maintained TRβ levels below group C (Figure 3D). There was an increase in the expression of TRβ at 0.5h, which was followed by a progressive reduction until 6h; TRβ levels tended to return to normality in 24h. This suggested that a defense or adaptation mechanism occurred in the cells in response to treatment with TH.
Previous studies from our group have shown that physiological doses of T3 decreased TRβ gene expression levels in the adipose tissue of obese animals that were subjected to food restriction (21), corroborating the results obtained in the present study at 6 and 24h. Moreover, Liu and cols. (22) found that TRβ gene expression levels remain unchanged in the myocardium of hyperthyroid rats compared with the myocardium of euthyroid rats, suggesting that the actions of T3 in its receptors are different for different tissues and experimental models.
In summary, the physiological and supraphysiological doses of T3 modulated TR mRNA expression levels by showing that, at 6h, a suppression of both genes occurred in the presence of different doses of T3, and that, after 24h, the expression levels tended to return to normality. Since the interaction with the T3 nuclear receptors leads to the activation or inhibition of target expression of genes, implying the stimulation or blocking of the synthesis of specific proteins, mechanism by which TH exerts its biological effects on cells, the results presented are important for an understanding in which T3 dose (physiological or supraphysiological), at different incubation times, T3 activates thyroid hormone receptors in adipocytes.
Acknowledgements: we are grateful to Sueli A. Clara, José C. Georgete, Mário B. Bruno, and Keize Nagamati Junior for their technical support. We also would like to thank Editage for the translation of the manuscript into English. Capes and Fapesp (# 2010/16911-4) provided us with financial support.
Received on Dec/7/2012
Accepted on Jan/21/2013
Disclosure: no potential conflict of interest relevant to this article was reported.
- 1. Darimont C, Gaillard D, Ailhaud G, Negrel R. Terminal differentiation of mouse preadipocyte cells: adipogenic and antimitogenic role of triiodothyronine. Mol Cell Endocrinol. 1993;98(1):67-73.
- 2. Cheng SY, Leonard JL, Davis PJ. Molecular aspects of thyroid hormone actions. Endocrin Rev. 2010;31(2):139-70.
- 3. Williams GR. Cloning and characterization of two novel thyroid hormone receptor beta isoforms. Mol Cell Biol. 2000;20(22):8329-42.
- 4. Macchia PE, Takeuchi Y, Kawai T, Cua K, Gauthier K, Chassande O, et al. Increased sensitivity to thyroid hormone in mice with complete deficiency of thyroid hormone receptor alpha. Proc Natl Acad Sci USA. 2001;98(1):349-54.
- 5. Yen PM. Physiological and molecular basis of thyroid hormone action. Physiol Rev. 2001;81(3):1097-142.
- 6. Obregon MJ. Thyroid hormone and adipocyte differentiation. Thyroid. 2008;18(2):185-95.
- 7. Flores-Delgado G, Marsch-Moreno M, Kuri-Harcuch W. Thyroid hormone stimulates adipocyte differentiation of 3T3 cells. Mol Cell Biochem. 1987;76(1):35-43.
- 8. Chawla A, Lazar MA. Induction of Rev-ErbA alpha, an orphan receptor encoded on the opposite strand of the alpha-thyroid hormone receptor gene, during adipocyte differentiation. J Biol Chem. 1993;268(22):16265-9.
- 9. Livak KJ, Schmittgen TD. Analysis of relative gene expression data using real-time quantitative PCR and the 2(-Delta Delta C(T)) Method. Methods. 2001;25(4):402-8.
- 10. Green H, Meuth M. An established pre-adipose cell line and its differentiation in culture. Cell. 1974;3(2):127-33.
- 11. Bradley DJ, Towle HC, Young WS, 3rd. Spatial and temporal expression of alpha- and beta-thyroid hormone receptor mRNAs, including the beta 2-subtype, in the developing mammalian nervous system. J Neurosci. 1992;12(6):2288-302.
- 12. Jiang W, Miyamoto T, Kakizawa T, Sakuma T, Nishio S, Takeda T, et al. Expression of thyroid hormone receptor alpha in 3T3-L1 adipocytes; triiodothyronine increases the expression of lipogenic enzyme and triglyceride accumulation. J Endocrinol. 2004;182(2):295-302.
- 13. Forrest D, Hanebuth E, Smeyne RJ, Everds N, Stewart CL, Wehner JM, et al. Recessive resistance to thyroid hormone in mice lacking thyroid hormone receptor beta: evidence for tissue-specific modulation of receptor function. EMBO J. 1996;15(12):3006-15.
- 14. Zhu X, Cheng SY. New insights into regulation of lipid metabolism by thyroid hormone. Curr Opin Endocrinol Diabetes Obes. 2010;17(5):408-13.
- 15. Liu YY, Schultz JJ, Brent GA. A thyroid hormone receptor alpha gene mutation (P398H) is associated with visceral adiposity and impaired catecholamine-stimulated lipolysis in mice. J Biol Chem. 2003;278(40):38913-20.
- 16. Figueira AC, Saidemberg DM, Souza PC, Martinez L, Scanlan TS, Baxter JD, et al. Analysis of agonist and antagonist effects on thyroid hormone receptor conformation by hydrogen/deuterium exchange. Mol Endocrinol. 2011;25(1):15-31.
- 17. Yoshida T, Monkawa T, Hayashi M, Saruta T. Regulation of expression of leptin mRNA and secretion of leptin by thyroid hormone in 3T3-L1 adipocytes. Biochem Biophys Res Comm. 1997;232(3):822-6.
- 18. Franklyn JA, Ramsden DB, Sheppard MC. Down-regulation of nuclear T3 receptors by thyroid hormones in the rat anterior pituitary. Mol Cell Endocrinol. 1985;40(2-3):145-8.
- 19. Monden T, Nakajima Y, Hashida T, Ishii S, Tomaru T, Shibusawa N, et al. Expression of thyroid hormone receptor isoforms down-regulated by thyroid hormone in human medulloblastoma cells. Endocr J. 2006;53(2):181-7.
- 20. Kanamori A, Brown DD. The regulation of thyroid hormone receptor beta genes by thyroid hormone in Xenopus laevis. J Biol Chem. 1992; 267(2):739-45.
- 21. Luvizotto RA, Conde SJ, Sibio MT, Nascimento AF, Lima-Leopoldo AP, Leopoldo AS, et al. Administration of physiologic levels of triiodothyronine increases leptin expression in calorie-restricted obese rats, but does not influence weight loss. Metabolism. 2010;59(1):1-6.
- 22. Liu CR, Li LY, Shi F, Zang XY, Liu YM, Sun Y, et al. Effects of hyper- and hypothyroid on expression of thyroid hormone receptor mRNA in rat myocardium. J Endocrinol. 2007;195(3):429-38.
Correspondence to:
Publication Dates
-
Publication in this collection
25 July 2013 -
Date of issue
July 2013
History
-
Received
07 Dec 2012 -
Accepted
21 Jan 2013