Abstracts
PURPOSE: To evaluate the sensitivity and specificity of machine learning classifiers (MLCs) for glaucoma diagnosis using Spectral Domain OCT (SD-OCT) and standard automated perimetry (SAP). METHODS: Observational cross-sectional study. Sixty two glaucoma patients and 48 healthy individuals were included. All patients underwent a complete ophthalmologic examination, achromatic standard automated perimetry (SAP) and retinal nerve fiber layer (RNFL) imaging with SD-OCT (Cirrus HD-OCT; Carl Zeiss Meditec Inc., Dublin, California). Receiver operating characteristic (ROC) curves were obtained for all SD-OCT parameters and global indices of SAP. Subsequently, the following MLCs were tested using parameters from the SD-OCT and SAP: Bagging (BAG), Naive-Bayes (NB), Multilayer Perceptron (MLP), Radial Basis Function (RBF), Random Forest (RAN), Ensemble Selection (ENS), Classification Tree (CTREE), Ada Boost M1(ADA),Support Vector Machine Linear (SVML) and Support Vector Machine Gaussian (SVMG). Areas under the receiver operating characteristic curves (aROC) obtained for isolated SAP and OCT parameters were compared with MLCs using OCT+SAP data. RESULTS: Combining OCT and SAP data, MLCs' aROCs varied from 0.777(CTREE) to 0.946 (RAN).The best OCT+SAP aROC obtained with RAN (0.946) was significantly larger the best single OCT parameter (p<0.05), but was not significantly different from the aROC obtained with the best single SAP parameter (p=0.19). CONCLUSION: Machine learning classifiers trained on OCT and SAP data can successfully discriminate between healthy and glaucomatous eyes. The combination of OCT and SAP measurements improved the diagnostic accuracy compared with OCT data alone.
Glaucoma; Diagnostic techniques, ophthalmological; Tomography, optical coherence; Sensitivity and specificity
OBJETIVO: Avaliar a sensibilidade e especificidade dos classificadores de aprendizagem de máquina no diagnóstico de glaucoma usando Spectral Domain OCT (SD-OCT) e perimetria automatizada acromática (PAA). MÉTODOS: Estudo transversal observacional. Sessenta e dois pacientes com glaucoma e 48 indivíduos normais foram incluídos. Todos os pacientes foram submetidos a exame oftalmológico completo, e perimetria automatizada acromática (24-2 SITA; Humphrey Field Analyzer II, Carl Zeiss Meditec, Inc., Dublin, CA) e exame de imagem da camada de fibras nervosas utilizando SD-OCT (Cirrus HD-OCT; Carl Zeiss Meditec Inc., Dublin, California). Curvas ROC (Receiver operator characteristic) foram obtidas para todos os parâmetros do SD-OCT e índices globais do campo visual (MD, PSD, GHT). Subsequentemente, os seguintes classificadores de aprendizagem de máquina (CAMs) foram testados usando parâmetros do OCT e CV: Bagging (BAG), Naive-Bayes (NB), Multilayer Perceptron (MLP), Radial Basis Function (RBF), Random Forest (RAN), Ensemble Selection (ENS), Classification Tree (CTREE), Ada Boost M1(ADA), Support Vector Machine Linear (SVML) e Support Vector Machine Gaussian (SVMG). Áreas abaixo da curva ROC (aROC) obtidas com os parâmetros isolados do campo visual (CV) e OCT foram comparados com os CAMs usando dados associados do OCT e CV. RESULTADOS: Combinando os dados do OCT e do CV, aROCs dos CAMs variaram entre 0,777(CTREE) e 0,946 (RAN). A maior aROC dos CAMs OCT+CV obtida com RAN (0,946) foi significativamente maior que o melhor parâmetro do OCT (p<0,05), mas não houve diferença estatística significativa com o melhor parâmetro do CV (p=0,19). CONCLUSÃO: Os classificadores de aprendizagem de máquina treinados com dados do OCT e CV podem discriminar entre olhos normais e glaucomatosos com sucesso. A combinação das medidas do OCT e CV melhoraram a acurácia diagnóstica comparados aos parâmetros do OCT.
Glaucoma; Técnicas de diagnóstico oftalmológico; Tomografia de coerência óptica; Sensibilidade e especificidade
ORIGINAL ARTICLE ARTIGO ORIGINAL
Sensitivity and specificity of machine learning classifiers for glaucoma diagnosis using Spectral Domain OCT and standard automated perimetry
Sensibilidade e especificidade dos classificadores de aprendizagem de máquina para o diagnóstico de glaucoma usando Spectral Domain OCT e perimetria automatizada acromática
Fabrício R. SilvaI; Vanessa G. VidottiI; Fernanda CremascoI; Marcelo DiasII; Edson S. GomiII; Vital P. CostaI
IPhysician, Glaucoma Service, Department of Ophthalmology, Universidade Estadual de Campinas, Campinas (SP), Brazil
IIEngineer, Department of Engineering, Universidade de São Paulo, São Paulo (SP), Brazil
Correspondence address Correspondence address: Fabrício Reis da Silva Rua Madre Maltez, 92 Pouso Alegre - (MG) - 37550-000 - Brazil E-mail: silvafr@bol.com.br; fabricioreis@institutovisao.com.br
ABSTRACT
PURPOSE: To evaluate the sensitivity and specificity of machine learning classifiers (MLCs) for glaucoma diagnosis using Spectral Domain OCT (SD-OCT) and standard automated perimetry (SAP).
METHODS: Observational cross-sectional study. Sixty two glaucoma patients and 48 healthy individuals were included. All patients underwent a complete ophthalmologic examination, achromatic standard automated perimetry (SAP) and retinal nerve fiber layer (RNFL) imaging with SD-OCT (Cirrus HD-OCT; Carl Zeiss Meditec Inc., Dublin, California). Receiver operating characteristic (ROC) curves were obtained for all SD-OCT parameters and global indices of SAP. Subsequently, the following MLCs were tested using parameters from the SD-OCT and SAP: Bagging (BAG), Naive-Bayes (NB), Multilayer Perceptron (MLP), Radial Basis Function (RBF), Random Forest (RAN), Ensemble Selection (ENS), Classification Tree (CTREE), Ada Boost M1(ADA),Support Vector Machine Linear (SVML) and Support Vector Machine Gaussian (SVMG). Areas under the receiver operating characteristic curves (aROC) obtained for isolated SAP and OCT parameters were compared with MLCs using OCT+SAP data.
RESULTS: Combining OCT and SAP data, MLCs' aROCs varied from 0.777(CTREE) to 0.946 (RAN).The best OCT+SAP aROC obtained with RAN (0.946) was significantly larger the best single OCT parameter (p<0.05), but was not significantly different from the aROC obtained with the best single SAP parameter (p=0.19).
CONCLUSION: Machine learning classifiers trained on OCT and SAP data can successfully discriminate between healthy and glaucomatous eyes. The combination of OCT and SAP measurements improved the diagnostic accuracy compared with OCT data alone.
Keywords: Glaucoma/diagnosis; Diagnostic techniques, ophthalmological/classification; Tomography, optical coherence/instrumentation; Sensitivity and specificity
RESUMO
OBJETIVO: Avaliar a sensibilidade e especificidade dos classificadores de aprendizagem de máquina no diagnóstico de glaucoma usando Spectral Domain OCT (SD-OCT) e perimetria automatizada acromática (PAA).
MÉTODOS: Estudo transversal observacional. Sessenta e dois pacientes com glaucoma e 48 indivíduos normais foram incluídos. Todos os pacientes foram submetidos a exame oftalmológico completo, e perimetria automatizada acromática (24-2 SITA; Humphrey Field Analyzer II, Carl Zeiss Meditec, Inc., Dublin, CA) e exame de imagem da camada de fibras nervosas utilizando SD-OCT (Cirrus HD-OCT; Carl Zeiss Meditec Inc., Dublin, California). Curvas ROC (Receiver operator characteristic) foram obtidas para todos os parâmetros do SD-OCT e índices globais do campo visual (MD, PSD, GHT). Subsequentemente, os seguintes classificadores de aprendizagem de máquina (CAMs) foram testados usando parâmetros do OCT e CV: Bagging (BAG), Naive-Bayes (NB), Multilayer Perceptron (MLP), Radial Basis Function (RBF), Random Forest (RAN), Ensemble Selection (ENS), Classification Tree (CTREE), Ada Boost M1(ADA), Support Vector Machine Linear (SVML) e Support Vector Machine Gaussian (SVMG). Áreas abaixo da curva ROC (aROC) obtidas com os parâmetros isolados do campo visual (CV) e OCT foram comparados com os CAMs usando dados associados do OCT e CV.
RESULTADOS: Combinando os dados do OCT e do CV, aROCs dos CAMs variaram entre 0,777(CTREE) e 0,946 (RAN). A maior aROC dos CAMs OCT+CV obtida com RAN (0,946) foi significativamente maior que o melhor parâmetro do OCT (p<0,05), mas não houve diferença estatística significativa com o melhor parâmetro do CV (p=0,19).
CONCLUSÃO: Os classificadores de aprendizagem de máquina treinados com dados do OCT e CV podem discriminar entre olhos normais e glaucomatosos com sucesso. A combinação das medidas do OCT e CV melhoraram a acurácia diagnóstica comparados aos parâmetros do OCT.
Descritores: Glaucoma/diagnóstico; Técnicas de diagnóstico oftalmológico/classificação; Tomografia de coerência óptica; Sensibilidade e especificidade
INTRODUCTION
Glaucoma is a neuropathy characterized by visual field loss with gradual thinning of the retinal nerve fiber layer (RNFL) and cupping of the optic nerve head (ONH)(1). The diagnosis of glaucoma is currently based on the appearance of the ONH and standard automated perimetry (SAP) testing results. Recent randomized clinical trials including the Ocular Hypertension Treatment Study and the European Glaucoma Prevention Study reported that the first detectable damage in patients with glaucoma can be either structural or functional(2,3). This suggests that using structural and functional testing in combination may improve glaucoma detection.
Optical coherence tomography (OCT), first described in 1991 by Huang et al.(4), is a noncontact, high-resolution technique using a scanning interferometer to produce cross-sectional images of the retina and peripapillary RNFL in vivo(4,5). Previous reports have shown that time domain (TD) OCT (Stratus, Carl Zeiss Meditec, Inc., Dublin, CA) has high sensitivity and specificity for diagnosing glaucoma, and has good correlation with VF findings detected with SAP(5-8).
Recently, several companies have developed newer versions of OCT employing spectral domain (SD) technology. SD-OCTs have higher axial resolution and scan speed than conventional TD-OCTs. The Cirrus HD-OCT (Carl Zeiss Meditec, Inc.) has an axial resolution of 5 microns and a scan speed of 27,000 A-scans per second, whereas the Stratus OCT has an axial resolution of 8 to 10 microns and a scan speed of 400 A-scans per second. The higher sampling rates of the newer OCTs allow more data to be collected at shorter scan times. Studies comparing these two technologies have demonstrated that the sensitivity and specificity of various RNFL parameters using the Cirrus OCT are excellent and equivalent to the Stratus OCT(9-13).
Since 1990 (Goldbaum MH, et al. IOVS 1990;31; ARVO Abstract 503), machine learning classifier (MLC) techniques have been applied to optical imaging and visual function measurements to improve glaucoma detection, with results suggesting that these techniques are as good as or better than currently available methods at classifying eyes as glaucomatous or healthy(14-24). Classifiers usually employ a form of supervised learning, where the program learns from positive and negative training examples, representing cases where, for example, there are signs of glaucoma on data obtained by examination of the visual field (positive examples) or not (negative examples). The training is repeated several times with the provision of various training data, with the positive or negative classification previously performed by an ophthalmologist, until the concept (identification of signs of glaucoma in one test) can be properly learned by the system.
To the best of our knowledge, there is no study in the literature evaluating the use of MLCs with combined SD-OCT and SAP for the diagnosis of glaucoma. The purpose of this study was to investigate the sensitivity and specificity of MLCs for the diagnosis of glaucoma combining structural and functional parameters, using data obtained with SD-OCT and SAP.
METHODS
Subjects
This observational cross-sectional study included 110 eyes of 110 participants (62 patients with glaucoma and 48 healthy control subjects) older than 40 years and enrolled in the Glaucoma Service of the University of Campinas, Campinas, Brazil, between August 2008 and November 2010. All subjects underwent a comprehensive ophthalmic evaluation, including review of medical history, best corrected visual acuity, slit lamp biomicroscopy, intraocular pressure measurement with Goldmann applanation tonometry, gonioscopy, dilated slit lamp fundus examination with a 78-D lens, SAP using the 24-2 Swedish Interactive Threshold Algorithm (SITA; Humphrey Field Analyzer II, Carl Zeiss Meditec, Inc., Dublin, CA) and RNFL imaging with Cirrus HD-OCT (Cirrus HD-OCT; Carl Zeiss Meditec Inc., Dublin, California). To be included in the study, participants had to have a best-corrected visual acuity better than or equal to 20/40, spherical refraction within ± 5.0 D, cylinder correction within ± 3.0 D, open angles on gonioscopy, and a reliable SAP with false-positive errors <33%, false-negative errors <33% and fixation losses <20%. Eyes with coexisting diabetes, retinal disease, uveitis, nonglaucomatous optic neuropathy, pseudophakia or aphakia, significant cataract according to the criteria of Lens Opacification Classification System III (defined as the maximum nuclear opacity (NC3, NO3), cortical (C3) and subcapsular (P3)), were excluded. One eye was randomly selected if both eyes were found to be eligible.
For healthy individuals, inclusion criteria were: IOP <21 mmHg, with no history of elevated IOP, 2 consecutive and reliable normal visual fields and normal appearance of the optic nerve. Glaucomatous eyes were defined as those with 2 or more IOP measurements >21 mmHg, a glaucomatous VF defect confirmed by 2 reliable and consecutive VF examinations and with glaucomatous appearance of the optic disc. Eyes with glaucomatous VF defects were defined as those fulfilling at least two of the following criteria: (1) cluster of 3 points with a probability of <5% on a pattern deviation map in a single hemifield including >1 point with a probability of <1%; (2) glaucoma hemifield test (GHT) outside 99% of the age-specific normal limits; and (3) pattern standard deviation (PSD) outside 95% of the normal limit. Glaucomatous appearance of the optic disc was defined as the presence of at least 2 of the following findings: cup-disc ratio greater than 0.6, focal defects of the neuroretinal rim, acquired pit of the optic nerve and peripapillary hemorrhage.
The severity of glaucomatous damage was determined according to the following criteria: a) early damage: mean deviation (MD) >-6 dB; b) moderate damage: MD between -6 dB and -15 dB; c) advanced damage: MD <-15 dB. Only patients with early or moderate damage were included in the study.
Informed consent was obtained from all participants before enrollment. All procedures conformed to the Declaration of Helsinki and the study was approved by the University of Campinas Medical Institutional Review Board.
Optical coherence tomography
Participants underwent ocular imaging with the commercially available Cirrus HD-OCT (software version 3.0, Carl Zeiss Meditec, Inc.), which uses spectral domain technology. The optic disc cube mode consists of 200 A-scans that are derived from 200 B-scans and covers a 6-mm2 area centered on the optic disc. After creating a RNFL thickness map from the 3-dimensional cube data set, the software automatically determines the center of the disc and extracts a circumpapillary circle (1.73-mm radius) for RNFL thickness measurement. All images were acquired with undilated pupils by a single, well-trained ophthalmologist (VGV), who was masked to the diagnosis. The OCT technology provides RNFL thickness maps with 17 parameters: average thickness, 4 quadrants (superior, inferior, nasal, and temporal) and 12 clock hour measurements. All OCT data were aligned according to the orientation of the right eye. Hence, clock hour 9 of the circumpapillary scan represented the temporal side of the optic disc for both eyes. Only well-centered scans, with no evidence of eye movement or segmentation within the area of RNFL analysis, and with a signal strength >6 were included.
Standard automated perimetry
All visual fields included were obtained with the 24-2 Swedish interactive threshold algorithm (SITA) of the Humphrey field Analyzer II, Carl Zeiss Meditec, Inc., Dublin, CA). Glaucoma subjects required at least two reliable visual field examinations, with the most recent examination within 3 months of the enrollment date. SAP parameters included in the analysis were MD, PSD, and GHT. For the GHT results, we assigned within normal limits (WNL) a value of 1; borderline, 2; and outside normal limits (ONL), 3.
Machine learning classifiers
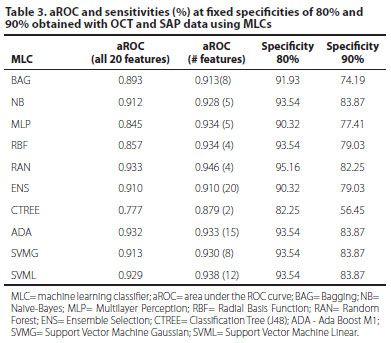
Based on patient data obtained from the Cirrus OCT and SAP, machine learning classifiers were developed using the following algorithms: Bagging (BAG), Naive-Bayes (NB), Multilayer Perceptron (MLP), Radial Basis Function (RBF), Random Forest (RAN), Ensemble Selection (ENS), Classification Tree (CTREE), Ada Boost M1 (ADA), Support Vector Machine Linear (SVML) and Support Vector Machine Gaussian (SVMG). Initially, MLC training sessions were supervised with all 17 parameters of the SD-OCT and 3 parameters of the SAP, a total of 20. Subsequently, a backward feature selection was used to find the minimal number of features that resulted in the highest aROC for each classifier. The analysis started with the evaluation of the classifiers performance over the full-dimensional feature set containing the 17 SD-OCT and 3 SAP features. Sequentially, the feature that presented the lowest aROC, computed over the SD-OCT data alone, was removed and the classifier's accuracy was computed. This process of dimension reduction, based on aROCs of the SD-OCT and SAP parameters sorted in descending order, was performed 19 times. It started with the exclusion of the parameter with the lowest aROC and stopped only when the parameter with the best aROC was used. The criterion for evaluating the algorithms involved the analysis of ROC curves generated from the results of several classification tasks for each classifier.
The classifiers were developed using a machine learning environment software called Weka(25) version 3.7.0 (Waikato Environment for Knowledge Analysis, The University of Waikato, New Zealand). The examination data and images were collected at the Department of Ophthalmology, University of Campinas and temporarily stored in a local workstation. The data was transferred to the server located at the Engineering Laboratory of Knowledge (KNOMA) from the Program of Computer and Digital Systems of the University of Sao Paulo.
To maximize the use of our collected data, the 10-fold cross-validation resampling method was employed. Accordingly, all data were randomly divided into 10 subsets, each containing approximately the same proportion of healthy and glaucomatous OCT thickness measurements. Nine subsets were used as training data, while the remaining subset was used as testing data. This process was performed 10 times, until each of the 10 folders had been used as a test set. The test results were averaged to estimate the classifier's accuracy.
Statistical analysis
All analyses were performed using MedCalc software version 11.0.1 (MedCalc Software, Mariakerke, Belgium). Continuous variables were compared using the Student's T test, whereas categorical variables were analyzed using the Chi-Square or the Fisher Exact test.
Receiver operating characteristic (ROC) curves were obtained for all SD-OCT parameters (average, 4 quadrants, and 12 clock-hours RNFL thickness measurements) and SAP parameters (MD, PSD e GHT). aROCs obtained for each SD-OCT and SAP parameter and each machine learning classifier, before and after optimization, were compared using the z test. P values <0.05 were considered to be statistically significant.
RESULTS
One hundred and ten eyes of 110 individuals were included in this study. Among the 110 individuals, 62 patients had glaucoma and 48 were healthy control subjects.
Table 1 demonstrates the clinical characteristics of the study population. The mean age was 57.0 ± 9.2 years for healthy individuals and 59.9 ± 9.0 years for glaucoma patients (p=0.103). There was no significant difference between the control and glaucoma groups regarding intraocular pressure (IOP) (14.8 ± 2.8 mmHg and 13.8 ± 2.5 mmHg, respectively) (p=0.062), although glaucoma patients were using a mean number of 2.2 ± 1.2 medications to lower IOP. Mean MD values were -4.1 ± 2.4 dB for glaucoma patients and -1.5 ± 1.6 dB for healthy individuals (p<0.001). Among the glaucoma patients, 51 (82.3%) were classified as having early damage and 11 (17.7%) as having moderate damage. Among the 62 eyes with glaucoma, 5 (8.06%) showed poor agreement between structural and functional measurements. In all cases, the visual field defect was more pronounced in the hemisphere opposite to the expected (based on the area of greater optic nerve damage).
SAP parameters with the greatest aROCs were: PSD (0.915 - CI 0.846-0.956), GHT (0.866 - CI 0.787-0.923) and MD (0.828 - CI 0.745- 0.894) (Table 2).
SD-OCT parameters with the greatest aROCs were: inferior quadrant (0.813 - CI 0.727-0.881), average thickness (0.807 - CI 0.721-0.876), 7 o'clock position (0.765 - CI 0.674-0.840) and 6 o'clock position (0.754 - CI 0.663-0.831) (Table 2). For a fixed specificity of 80%, the best sensitivities were observed with 7 o'clock position (64.5%) average thickness (62.1%), inferior quadrant (61.3%), and superior quadrant (57.6%) (Table 2).
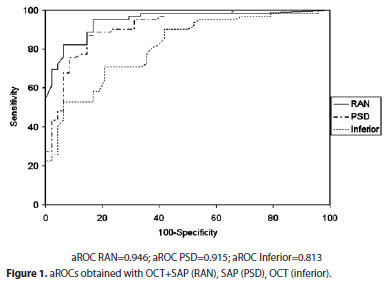
Combining all OCT and SAP data using MLCs, the aROCs varied from 0.777 (CTREE) to 0.933 (RAN) (Table 3). Using optimized classifiers (features in peak feature set) aROCs varied from 0.879 (CTREE, 2 features) to 0.946 (RAN, 4 features) (Table 3). The best OCT+SAP aROC obtained with RAN trained with 4 features (0.946) was significantly larger than the best single OCT parameter (0.813) (p<0.05), but was not significantly different from the aROC obtained with the best single SAP parameter (0.915) (p=0.37) (Figure 1).
DISCUSSION
Our study investigated the sensitivity and specificity of MLCs with the new version SD- OCT. To our knowledge, this study was the first to use MLCs with data obtained from SD-OCT and SAP. Many studies have been published assessing the sensitivity and specificity of TD-OCT, and some compared the diagnostic ability of TD-OCT and SD-OCT, demonstrating that they show similar and adequate performances(9-13). In a previous study, we reported the results of the SD-OCT in the diagnosis of glaucoma(25).
The diagnosis of glaucoma requires functional and structural analysis and the combination of structural and functional tests may improve glaucoma detection. Lauande-Pimentel et al.(26) showed enhancement of diagnostic accuracy when structural (scanning laser polarimetry) and functional (SAP) data were used in combination. Shah et al.(27) demonstrated that the combination of structural parameters (scanning laser polarimetry (GDX), OCT or confocal scanning laser ophthalmoscopy (CSLO)) with frequency doubling perimetry (FDT) or short wavelength automated perimetry (SWAP) led to a significant increase in sensitivity, which was higher than those obtained with structural parameters alone.
MLC techniques have also been employed with various technologies designed to perform structural and functional evaluation of glaucoma, including TD-OCT(15,17,19,23), HRT(18,22,24), GDx(16,20), and visual field(13,18,20,21). Several studies have used MLC techniques to combine functional and imaging data in attempt to improve diagnostic accuracy(19,22). Bowd et al.(19) trained MLCs (RVM and subspace Mixture of Gaussians) on Stratus OCT and SAP data and showed that combining OCT and SAP measurements using MLCs increased diagnostic performance marginally compared with MLC analysis of data obtained with each technology alone.
Mardin et al.(22) showed better performance for combined CSLO and SAP data compared with CSLO alone. However, combining CSLO and SAP data did not improve the accuracy compared with SAP data alone. We have also observed that combining OCT and SAP data using MLCs provided aROCs significantly larger than the best single OCT parameter (p<0.05), but not significantly different from the aROC obtained with the best single SAP parameter (p=0.37). This is likely due to a selection bias, as healthy controls were required to have normal visual field results and glaucoma patients were required to have abnormal visual fields. On the other hand, the purpose of MLCs is to replace human judgment exploiting all the information available, which justifies the inclusion of SAP in this case.
One way to reduce this interference would be to test the MLCs with structural and functional tests that are not used to define glaucoma. Racette et al.(28) used both SAP and stereophotographs as selection criteria, but used other devices (HRT and SWAP) to train and test MLCs. They have shown that the RVM classifier trained on optimized combinations of structural and functional parameters differentiated between glaucomatous and nonglaucomatous eyes better than the RVM trained on functional or structural parameters alone.
The case control study design has almost certainly overestimated the diagnostic performance of the MLCs by creating two distinct populations of healthy and disease subjects(29). However, our series should be seen as a preliminary study comparing different classifiers and sets of variables (SAP and OCT). Another limitation of our study is that we trained and tested the MLCs within the same population. Although we employed cross validation techniques to minimize this source of bias, it would be interesting to test our model on an independent data set. The above mentioned limitations could be overcome by including a consecutive case series of glaucoma suspects followed in a longitudinal study, allowing time to define what is disease.
In conclusion, MLCs trained on OCT and SAP data can successfully discriminate between healthy and glaucomatous eyes. The combination of OCT and SAP measurements improved the diagnostic accuracy compared with OCT data alone. Further studies are necessary to investigate the accuracy of these MLCs in different populations.
REFERENCES
1. Sommer A, Miller NR, Pollack I, Maumenee AE, George T. The nerve fiber layer in the diagnosis of glaucoma. Arch Ophthalmol. 1977;95(12):2149-56.
2. Kass MA, Heuer DK, Higginbotham EJ, Johnson CA, Keltner JL, Miller JP, et al. The Ocular Hypertension Treatment Study: a randomized trial determines that topical ocular hypotensive medication delays or prevents the onset of primary open-angle glaucoma. Arch Ophthalmol. 2002;120(6):701-13, discussion 829-30.
3. Miglior S, Zeyen T, Pfeiffer N, Cunha-Vaz J, Torri V, Adamsons I; European Glaucoma Prevention Study (EGPS) Group. Results of the European Glaucoma Prevention Study. Ophthalmology. 2005;112(3):366-75. Comment in Ophthalmology. 2005;112(9):1642-3; author reply 1643-5.
4. Huang D, Swanson EA, Lin CP, Schuman JS, Stinson WG, Chang W, et al. Optical coherence tomography. Science. 1991;254(5035):1178-81.
5. Schuman JS, Hee MR, Puliafito CA, Wong C, Pedut-Kloizman T, Lin CP, et al. Quantification of nerve fiber layer thickness in normal and glaucomatous eyes using optical coherence tomography. Arch Ophthalmol. 1995;113(5):586-96.
6. Harwerth RS, Vilupuru AS, Rangaswamy NV, Smith EL 3rd. The relationship between nerve fiber layer and perimetry measurements. Invest Ophthalmol Vis Sci. 2007; 48(2):763-73.
7. Zangwill LM, Bowd C, Berry CC, Williams J, Blumenthal EZ, Sánchez-Galeana CA, et al. Discriminating between normal and glaucomatous eyes using the Heidelberg Retina Tomograph, GDx Nerve Fiber Analyzer, and Optical Coherence Tomograph. Arch Ophthalmol. 2001;119(7):985-93.
8. Guedes V, Schuman JS, Hertzmark E, Wollstein G, Correnti A, Mancini R, et al. Optical coherence tomography measurement of macular and nerve fiber layer thickness in normal and glaucomatous eyes. Ophthalmology. 2003;110(1):177-89.
9. Chang RT, Knight OJ, Feuer WJ, Budenz DL. Sensitivity and specificity of time-domain versus spectral-domain optical coherence tomography in diagnosing early to moderate glaucoma. Ophthalmology. 2009;116(12):2294-9.
10. Jeoung JK, Park KH. Comparison of Cirrus OCT and Stratus OCT on the ability to detect localized retinal nerve fiber layer defects in preperimetric glaucoma. Invest Ophthalmol Vis Sci. 2010;51(2):938-45.
11. Park SB, Sung KR, Kang SY, Kim KR, Kook MS. Comparison of glaucoma diagnostic Capabilities of Cirrus HD and Stratus optical coherence tomography. Arch Ophthalmol. 2009;127(12):1603-9.
12. Moreno-Montañés J, Olmo N, Alvarez A, García N, Zarranz-Ventura J. Cirrus high-definition optical coherence tomography compared with Stratus optical coherence tomography in glaucoma diagnosis. Invest Ophthalmol Vis Sci. 2010;51(1):335-43.
13. Knight OJ, Chang RT, Feuer WJ, Budenz DL. Comparison of retinal nerve fiber layer measurements using time domain and spectral domain optical coherent tomography. Ophthalmology. 2009;116(7):1271-7.
14. Bizios D, Heijl A, Bengtsson B. Trained artificial neural network for glaucoma diagnosis using visual field data: a comparison with conventional algorithms. J Glaucoma. 2007; 16(1):20-8.
15. Burgansky-Eliash Z, Wollstein G, Chu T, Ramsey JD, Glymour C, Noecker RJ, et al. Optical coherence tomography machine learning classifiers for glaucoma detection: a preliminary study. Invest Ophthalmol Vis Sci. 2005;46(11):4147-52.
16. Bowd C, Medeiros FA, Zhang Z, Zangwill LM, Hao J, Lee TW, el al. Relevance vector machine and support vector machine classifier analysis of scanning laser polarimetry retinal nerve fiber layer measurements. Invest Ophthalmol Vis Sci. 2005;46(4):1322-9.
17. Bizios D, Heijl A, Hougaard JL, Bengtsson B. Machine learning classifiers for glaucoma diagnosis based on classification of retinal nerve fibre layer thickness parameters measured by Stratus OCT. Acta Ophthalmol. 2010;88(1):44-52.
18. Townsend KA, Wollstein G, Danks D, Sung KR, Ishikawa H, Kagemann L, et al. Heidelberg Retina Tomograph 3 machine learning classifiers for glaucoma detection. Br J Ophthalmol. 2008;92(6):814-8.
19. Bowd C, Hao J, Tavares IM, Medeiros FA, Zangwill LM, Lee TW, et al. Bayesian machine learning classifiers for combining structural and functional measurements to classify healthy and glaucomatous eyes. Invest Ophthalmol Vis Sci. 2008;49(3):945-53.
20. Adler W, Peters A, Lausen B. Comparison of classifiers applied to confocal scanning laser ophthalmoscopy data. Methods Inf Med. 2008;47(1):38-46.
21. Boden C, Chan K, Sample PA, Hao J, Lee TW, Zangwill LM, et al. Assessing visual field clustering schemes using machine learning classifiers in standard perimetry. Invest Ophthalmol Vis Sci. 2007;48(12):5582-90.
22. Mardin CY, Peters A, Horn F, Jünemann AG, Lausen B. Improving glaucoma diagnosis by the combination of perimetry and HRT measurements. J Glaucoma. 2006; 15(4):299-305.
23. Huang ML, Chen HY. Development and comparison of automated classifiers for glaucoma diagnosis using Stratus optical coherence tomography. Invest Ophthalmol Vis Sci. 2005;46(11):4121-9.
24. Zangwill LM, Chan K, Bowd C, Hao J, Lee TW, Weinreb RN, et al. Heidelberg retina tomograph measurements of the optic disc and parapapillary retina for detecting glaucoma analyzed by machine learning classifiers. Invest Ophthalmol Vis Sci. 2004;45(9):3144-51.
25. Vidotti VG, Costa VP, Silva FR, Resende GM, Cremasco F, Dias M, et al. Sensitivity and specificity of machine learning classifiers and spectral domain OCT for the diagnosis of glaucoma. Eur J Ophthalmol. 2012 Jun 15:0. [Epub ahead of print]
26. Lauande-Pimentel R, Carvalho RA, Oliveira HC, Gonçalves DC, Silva LM, Costa VP. Discrimination between normal and glaucomatous eyes with visual field and scanning laser polarimetry measurements. Br J Ophthalmology. 2001;85(5):586-91. Erratum in Br J Ophthalmol. 2002;86(6):707.
27. Shah NN, Bowd C, Medeiros FA, Weinreb RN, Sample PA, Hoffmann EM, et al. Combining structural and functional testing for detection of glaucoma. Ophthalmology. 2006;113(9):1593-602. Comment in Ophthalmology. 2007;114(7):1414. Ophthalmology. 2006;113(9):1479-80.
28. Racette L, Chiou CY, Hao J, Bowd C, Goldbaum MH, Zangwill LM, et al. Combining functional and structural tests improves the diagnostic accuracy of relevance vector machine classifiers. J Glaucoma. 2010;19(3):167-75.
29. Whiting P, Rutjes AW, Reitsma JB, Glas AS, Bossuyt PM, Kleijnen J. Sources of variation and bias in studies of diagnostic accuracy: a systematic review. Ann Intern Med. 2004;140(3):189-202.
Submitted for publication: October 10, 2012
Accepted for publication: March 19, 2013
Funding: This study was supported by Fundação de Amparo à Pesquisa do Estado de São Paulo (FAPESP): 07/51281-9 (Dr. Vital P. Costa)
Disclosure of potential conflicts of interest: F.R.Silva, None; V.G.Vidotti, None; F.Cremasco, None; M.Dias, None; E.S.Gomi, None; V.P.Costa, None.
Número do projeto: 406/2005, Comitê de Ética em Pesquisa da Faculdade de Ciências Médicas da UNICAMP.
Study carried out at Department of Ophthalmology, Universidade Estadual de Campinas, Campinas (SP), Brazil.
-
1Sommer A, Miller NR, Pollack I, Maumenee AE, George T. The nerve fiber layer in the diagnosis of glaucoma. Arch Ophthalmol. 1977;95(12):2149-56.
-
2Kass MA, Heuer DK, Higginbotham EJ, Johnson CA, Keltner JL, Miller JP, et al. The Ocular Hypertension Treatment Study: a randomized trial determines that topical ocular hypotensive medication delays or prevents the onset of primary open-angle glaucoma. Arch Ophthalmol. 2002;120(6):701-13, discussion 829-30.
-
3Miglior S, Zeyen T, Pfeiffer N, Cunha-Vaz J, Torri V, Adamsons I; European Glaucoma Prevention Study (EGPS) Group. Results of the European Glaucoma Prevention Study. Ophthalmology. 2005;112(3):366-75. Comment in Ophthalmology. 2005;112(9):1642-3; author reply 1643-5.
- 4. Huang D, Swanson EA, Lin CP, Schuman JS, Stinson WG, Chang W, et al. Optical coherence tomography. Science. 1991;254(5035):1178-81.
- 5. Schuman JS, Hee MR, Puliafito CA, Wong C, Pedut-Kloizman T, Lin CP, et al. Quantification of nerve fiber layer thickness in normal and glaucomatous eyes using optical coherence tomography. Arch Ophthalmol. 1995;113(5):586-96.
- 6. Harwerth RS, Vilupuru AS, Rangaswamy NV, Smith EL 3rd The relationship between nerve fiber layer and perimetry measurements. Invest Ophthalmol Vis Sci. 2007; 48(2):763-73.
- 7. Zangwill LM, Bowd C, Berry CC, Williams J, Blumenthal EZ, Sánchez-Galeana CA, et al. Discriminating between normal and glaucomatous eyes using the Heidelberg Retina Tomograph, GDx Nerve Fiber Analyzer, and Optical Coherence Tomograph. Arch Ophthalmol. 2001;119(7):985-93.
- 8. Guedes V, Schuman JS, Hertzmark E, Wollstein G, Correnti A, Mancini R, et al. Optical coherence tomography measurement of macular and nerve fiber layer thickness in normal and glaucomatous eyes. Ophthalmology. 2003;110(1):177-89.
- 9. Chang RT, Knight OJ, Feuer WJ, Budenz DL. Sensitivity and specificity of time-domain versus spectral-domain optical coherence tomography in diagnosing early to moderate glaucoma. Ophthalmology. 2009;116(12):2294-9.
- 10. Jeoung JK, Park KH. Comparison of Cirrus OCT and Stratus OCT on the ability to detect localized retinal nerve fiber layer defects in preperimetric glaucoma. Invest Ophthalmol Vis Sci. 2010;51(2):938-45.
- 11. Park SB, Sung KR, Kang SY, Kim KR, Kook MS. Comparison of glaucoma diagnostic Capabilities of Cirrus HD and Stratus optical coherence tomography. Arch Ophthalmol. 2009;127(12):1603-9.
- 12. Moreno-Montañés J, Olmo N, Alvarez A, García N, Zarranz-Ventura J. Cirrus high-definition optical coherence tomography compared with Stratus optical coherence tomography in glaucoma diagnosis. Invest Ophthalmol Vis Sci. 2010;51(1):335-43.
- 13. Knight OJ, Chang RT, Feuer WJ, Budenz DL. Comparison of retinal nerve fiber layer measurements using time domain and spectral domain optical coherent tomography. Ophthalmology. 2009;116(7):1271-7.
- 14. Bizios D, Heijl A, Bengtsson B. Trained artificial neural network for glaucoma diagnosis using visual field data: a comparison with conventional algorithms. J Glaucoma. 2007; 16(1):20-8.
- 15. Burgansky-Eliash Z, Wollstein G, Chu T, Ramsey JD, Glymour C, Noecker RJ, et al. Optical coherence tomography machine learning classifiers for glaucoma detection: a preliminary study. Invest Ophthalmol Vis Sci. 2005;46(11):4147-52.
- 16. Bowd C, Medeiros FA, Zhang Z, Zangwill LM, Hao J, Lee TW, el al. Relevance vector machine and support vector machine classifier analysis of scanning laser polarimetry retinal nerve fiber layer measurements. Invest Ophthalmol Vis Sci. 2005;46(4):1322-9.
- 17. Bizios D, Heijl A, Hougaard JL, Bengtsson B. Machine learning classifiers for glaucoma diagnosis based on classification of retinal nerve fibre layer thickness parameters measured by Stratus OCT. Acta Ophthalmol. 2010;88(1):44-52.
- 18. Townsend KA, Wollstein G, Danks D, Sung KR, Ishikawa H, Kagemann L, et al. Heidelberg Retina Tomograph 3 machine learning classifiers for glaucoma detection. Br J Ophthalmol. 2008;92(6):814-8.
- 19. Bowd C, Hao J, Tavares IM, Medeiros FA, Zangwill LM, Lee TW, et al. Bayesian machine learning classifiers for combining structural and functional measurements to classify healthy and glaucomatous eyes. Invest Ophthalmol Vis Sci. 2008;49(3):945-53.
- 20. Adler W, Peters A, Lausen B. Comparison of classifiers applied to confocal scanning laser ophthalmoscopy data. Methods Inf Med. 2008;47(1):38-46.
- 21. Boden C, Chan K, Sample PA, Hao J, Lee TW, Zangwill LM, et al. Assessing visual field clustering schemes using machine learning classifiers in standard perimetry. Invest Ophthalmol Vis Sci. 2007;48(12):5582-90.
- 22. Mardin CY, Peters A, Horn F, Jünemann AG, Lausen B. Improving glaucoma diagnosis by the combination of perimetry and HRT measurements. J Glaucoma. 2006; 15(4):299-305.
- 23. Huang ML, Chen HY. Development and comparison of automated classifiers for glaucoma diagnosis using Stratus optical coherence tomography. Invest Ophthalmol Vis Sci. 2005;46(11):4121-9.
- 24. Zangwill LM, Chan K, Bowd C, Hao J, Lee TW, Weinreb RN, et al. Heidelberg retina tomograph measurements of the optic disc and parapapillary retina for detecting glaucoma analyzed by machine learning classifiers. Invest Ophthalmol Vis Sci. 2004;45(9):3144-51.
- 25. Vidotti VG, Costa VP, Silva FR, Resende GM, Cremasco F, Dias M, et al. Sensitivity and specificity of machine learning classifiers and spectral domain OCT for the diagnosis of glaucoma. Eur J Ophthalmol. 2012 Jun 15:0. [Epub ahead of print]
- 26. Lauande-Pimentel R, Carvalho RA, Oliveira HC, Gonçalves DC, Silva LM, Costa VP. Discrimination between normal and glaucomatous eyes with visual field and scanning laser polarimetry measurements. Br J Ophthalmology. 2001;85(5):586-91. Erratum in Br J Ophthalmol. 2002;86(6):707.
- 27. Shah NN, Bowd C, Medeiros FA, Weinreb RN, Sample PA, Hoffmann EM, et al. Combining structural and functional testing for detection of glaucoma. Ophthalmology. 2006;113(9):1593-602. Comment in Ophthalmology. 2007;114(7):1414. Ophthalmology. 2006;113(9):1479-80.
- 28. Racette L, Chiou CY, Hao J, Bowd C, Goldbaum MH, Zangwill LM, et al. Combining functional and structural tests improves the diagnostic accuracy of relevance vector machine classifiers. J Glaucoma. 2010;19(3):167-75.
- 29. Whiting P, Rutjes AW, Reitsma JB, Glas AS, Bossuyt PM, Kleijnen J. Sources of variation and bias in studies of diagnostic accuracy: a systematic review. Ann Intern Med. 2004;140(3):189-202.
Correspondence address:
Publication Dates
-
Publication in this collection
06 Aug 2013 -
Date of issue
June 2013
History
-
Received
10 Oct 2012 -
Accepted
19 Mar 2013