Abstracts
Purpose:
The goal of this cross-sectional observational study was to quantify the pattern-shift visual evoked potentials (VEP) and the thickness as well as the volume of retinal layers using optical coherence tomography (OCT) across a cohort of Parkinson's disease (PD) patients and age-matched controls.
Methods:
Forty-three PD patients and 38 controls were enrolled. All participants underwent a detailed neurological and ophthalmologic evaluation. Idiopathic PD cases were included. Cases with glaucoma or increased intra-ocular pressure were excluded. Patients were assessed by VEP and high-resolution Fourier-domain OCT, which quantified the inner and outer thicknesses of the retinal layers. VEP latencies and the thicknesses of the retinal layers were the main outcome measures.
Results:
The mean age, with standard deviation (SD), of the PD patients and controls were 63.1 (7.5) and 62.4 (7.2) years, respectively. The patients were predominantly in the initial Hoehn-Yahr (HY) disease stages (34.8% in stage 1 or 1.5, and 55.8 % in stage 2). The VEP latencies and the thicknesses as well as the volumes of the retinal inner and outer layers of the groups were similar. A negative correlation between the retinal thickness and the age was noted in both groups. The thickness of the retinal nerve fibre layer (RNFL) was 102.7 μm in PD patients vs. 104.2 μm in controls.
Conclusions:
The thicknesses of retinal layers, VEP, and RNFL of PD patients were similar to those of the controls. Despite the use of a representative cohort of PD patients and high-resolution OCT in this study, further studies are required to establish the validity of using OCT and VEP measurements as the anatomic and functional biomarkers for the evaluation of retinal and visual pathways in PD patients.
Evoked potentials, visual; Tomography, optical coherence/methods; Parkinson disease
Objetivo:
Este estudo observacional transversal controlado visou quantificar os potenciais evocados visuais com estímulo de padrões alternantes (PEV), a espessura e o volume das camadas retinianas com tomografia de coerência óptica (TCO) num grupo de pacientes com doença de Parkinson (DP).
Métodos:
Quarenta e três pacientes com DP e 38 controles. Procedimentos: pacientes e controles foram submetidos a exames neurológico e oftalmológico detalhados, sendo incluídos pacientes com DP idiopática e excluídos casos com glaucoma ou aumento da pressão intraocular. Todos os participantes foram estudados com PEV e TCO de Fourier, sendo quantificadas as latências de P100, a espessura e o volume das camadas retinianas interna e externa.
Resultados:
A média das idades e desvio-padrão dos pacientes com DP e controles foram respectivamente 63,1(7,5) e 62,4 (7,2) anos. Os pacientes com DP situaram-se predominantemente nos estágios iniciais de Hoehn-Yahr (34.8% no estágio 1 ou 1.5; 55.8 % no estágio 2). Não foram observadas diferenças entre os dois grupos quanto às latências dos PEV, a espessura e o volume das camadas retinianas. Observamos uma correlação negativa entre a espessura das camadas retinianas e a idade em ambos os grupos. Não se observou diferença significativa quanto à espessura da camada retiniana das fibras do nervo óptico (CRFNO), que foi de 102,7 μm nos pacientes e 104,2 μm nos controles.
Conclusões:
A espessura das camadas retinianas, os PEV e a espessura da CRFNO foi semelhante nos pacientes com DP e controles. Apesar desse grupo representativo de pacientes com DP e da alta resolução da TCO utilizada neste estudo, mais estudos são necessários para estabelecer o papel da TCO e dos PEV como biomarcadores anatômico e funcional na avaliação da retina e da via visual dos pacientes com DP.
Potenciais evocados visuais; Tomografia de coerência óptica/métodos
INTRODUCTION
Parkinson's Disease (PD) is the second most common neurodegenerative disease, affecting
1-2 % of the world's population above the age 65(11 Lang AE, Lozano AM. Parkinson's disease: first of two parts. N Engl J
Med. 1998;339(15):1044-53.). The non-motor symptoms (olfactory, autonomic, and
visual) of PD have been described. Ophthalmological symptoms include blurred vision due
to dry eye, and diplopia from convergence insufficiency. Additionally, it has been
reported that PD patients present abnormalities in pattern-shift visual evoked
potentials (VEP), contrast sensitivity, and colour vision(33 Bodis-Wollner I, Yahr M. Measurements of visual evoked potentials in
Parkinson's disease. Brain 1978;101(4):661-71.
4 Regan D, Neima D. Low-contrast letter charts in early diabetic
retinopathy, ocular hypertension, glaucoma and Parkinson's disease. Br J Ophthalmol.
1984;68(12):885-9.-55 Onofrj M, Ghilardi MF, Basciani M, Gambi D. Visual evoked potentials in
Parkinsonism and dopamine blockade reveal a stimulus-dependent dopamine function in
humans. J Neurol Neurosurg Psychiatry. 1986;49(10):1150-9.). The human retina contains dopaminergic amacrine and
interplexiform cells, which play a regulatory role. Dopaminergic D1 and D2 receptors are
essentials for the receptive field organization of the ganglion cells(66 Mariani AP. Amacrine cells of the rhesus monkey retina. J Comp Neurol.
1990;301(3):382-400.
7 Kolb H, Cuenca N, Wang HH, Dekorver L. The synaptic organization of the
dopaminergic amacrine cell in the cat retina. J Neurocytol.
1990;19(3):343-66.
8 Witkovsky P, Nicholson C, Rice ME, Bohmaker K, Meller E. Extracellular
dopamine concentration in the retina of the clawed frog, Xenopus laevis. Proc Natl
Acad Sci USA. 1993;90(12):5667-71.-99 Bodis-Wollner I, Antal A. Optic nerve and central nervous dysfunctions:
Parkinson's disease and multiple sclerosis. In: Heckenlively JR, Arden GB, editors.
Principles and practice of clinical electrophysiology of vision 2nd ed. Cambridge,
Massachusetts, London, England: The Mit Press; 2006. p.867-88.). Optical coherence tomography (OCT), a non-invasive optical
interferometric method, generates cross-sectional retinal images in
vivo. Earlier studies using time-domain and spectral-domain OCT have found
evidence for the retinal changes in PD patients. However, these findings have not been
independently verified. Four separate studies have reported thinning of the inner
retinal layer in PD patients(1010 Inzelberg R, Ramirez JA, Nisipeanu P, Ophir A. Retinal nerve fiber layer
thinning in Parkinson disease. Vision Res. 2004;44(24):2793-7.
11 Altintas O, Iseri P, Ozkan B, Caglar Y. Correlation between retinal
morphological and functional findings and clinical severity in Parkinson's disease.
Doc Ophthalmol. 2008;116(2):137-46.
12 Hajee ME, March WF, Lazzaro DR, Wolintz AH, Shrier EM, Glazman S, et al.
Inner retinal layer thinning in Parkinson disease. Arch Ophthalmol.
2009;127(6):737-41.-1313 Moschos MM, Tagaris G, Markopoulos I, Margetis I, Tsapakis S, et al.
Morphologic changes and functional retinal impairment in patients with Parkinson
disease without visual loss. Eur J Ophthalmol. 2011;21(1):24-9.). Two of
these studies found a significant thinning of the peripapillary retinal nerve fibre
layer (RNFL) only in the inferior and temporal retinas of some PD
patients(1010 Inzelberg R, Ramirez JA, Nisipeanu P, Ophir A. Retinal nerve fiber layer
thinning in Parkinson disease. Vision Res. 2004;44(24):2793-7.,1313 Moschos MM, Tagaris G, Markopoulos I, Margetis I, Tsapakis S, et al.
Morphologic changes and functional retinal impairment in patients with Parkinson
disease without visual loss. Eur J Ophthalmol. 2011;21(1):24-9.). An independent study found a
reduction in the mean total thickness of the peripapillary RNFL and reduced macular
volume in 17 PD patients(1111 Altintas O, Iseri P, Ozkan B, Caglar Y. Correlation between retinal
morphological and functional findings and clinical severity in Parkinson's disease.
Doc Ophthalmol. 2008;116(2):137-46.). Further, there was an inverse correlation between the macular
thickness and the motor handicap. The objectives of this study were to define VEP and
Fourier-domain high-resolution OCT images as functional and biological marker,
respectively of PD. These tools allow the analysis of maculo-cortical pathway (via VEP)
and enable retinal measurements (via OCT), and therefore, could address the retinal
contribution to the visual dysfunction in PD.
METHODS
Patients and study population
This cross-sectional observational study recruited 43 idiopathic PD patients and 38 age-matched controls from a specialised PD clinic. A neurologist (E.M.A.B.Q), who also performed the VEP measurements, made the diagnosis based on the UK Brain Bank criteria(1414 Daniel SE, Lees AJ. Parkinson's Disease Society Brain Bank, London: overview and research. J Neural Transm Suppl. 1993;39:165-72.) and applied the United Parkinson Disease Scale (UPDRS). Patients were under dopaminergic medications at the time of the study. The Hoehn-Yahr (HY) stage was established in an off stage, without the effects of medication. All patients were between the HY stages 1 and 3 (mean 1.78). Exclusion criteria were the following: systemic co-morbidities such as neoplasia, diabetes, severe arterial hypertension, glaucoma or intraocular pressure greater than 20 mmHg, posterior-pole eye diseases such as macular degeneration or any optic neuropathy, or a best-corrected visual acuity worse than 20/30. The ophthalmologic evaluation and the OCT were performed at an on stage by one of three ophthalmologists involved in this study (L.B.Q., C.D., and E.B.A.) and comprised a visual acuity test (Snellen table), an Ishihara colors test, a biomicroscopy, and an intraocular pressure measurement using the Goldmann applanation tonometer. We examined 86 eyes of 43 PD patients and 76 eyes of 38 controls. All participants signed an informed consent form. The study was approved on 8/24/2010 by the ethical committee of the State University of Campinas (SP) and was conducted according to the Good Practice Guidelines (1977), the Helsinki Declaration (2000 version), and the Brazilian Clinical Study Guidelines.
Equipment and measures
Neurophysiologic analysis: a Nihon-Kohden 4-channel device registered VEP using a full-field checkerboard pattern (black and white), applying a 2-Hz stimuli and a controlled background luminance. Responses to the stimuli with a visual angle of 30' were considered for statistical analysis. Electrodes were placed on the scalp according to the 10/20 International System. The electrode was placed 5 cm above the inion and the reference electrode was placed over the midline frontal region (FpZ). Eyes were stimulated individually. The average responses from two trials of 150 stimuli for each eye were superimposed using a 1-Hz-100-Hz filter. Latencies and amplitudes of N75, P100, and N135 were measured. However, only the P100 latencies were considered for statistical analysis.
Morphological analysis: a Fourier-domain OCT (RTvue; Optovue, Cal, USA), with an approximate resolution of 5 μm, was used for examining the retinal morphology. The OCT examined an area corresponding to the central and paracentral visual fields. The standard glaucoma protocol, consisting of optic nerve head map scans and macula map scans, was performed in both PD patients and controls. The protocol measured the mean inner (IRL), outer (ORL), and full retinal layer (FRL) thicknesses, the volume of the parafoveal (diameter= 3.00 mm) and perifoveal (diameter 5.00 mm) regions, and the RNFL average mean thickness over a diameter of 3.45 mm for both superior and inferior hemispheres. The IRL includes the nerve fibre layer, the ganglion cell layer, and the inner plexiform layer. The ORL includes the retinal layers starting from the inner nuclear layer up to and including the retinal pigment epithelium. The OCT instrument was equipped with an eye tracker that compensated for the eye movement. When motion or media artefacts were detected, the OCT measurements were repeated.
Statistical analysis
Statistical analysis was performed using the descriptive statistics and employed no parametric tests. The data have been presented as the mean values and standard deviation to enable comparisons with published results. The Chi-square and Fisher's exact tests (for values less than 5) were used to compare the categorical variables. The Mann-Whitney and Kruskal-Wallis tests were used for comparing the numeric variables between two or three groups. The Spearman rank coefficient ® was used to analyze the relationships between the numerical variables. Correlation was considered strong if r≥0.70, moderate if 0.70>r>0.50, weak if 0.20<r<0.50, and no correlation if r≤0.20. The adopted significance level for the statistical tests was 5% (P<0.05).
RESULTS
The age frequencies were similar in both groups-28 subjects between the ages of 50 and 59 years (13 controls and 15 PD), 37 subjects between the ages of 60 and 69 years (18 controls and 19 PD), and 16 subjects between the ages of 70 and 79 years (7 controls and 9 PD) (Q-square=0.11, P=0.946). Thirteen PD patients (31.28%) and 8 control subjects (22.21%) included symptoms (P=0.365) such as visual tiredness (10 patients), dry eye (5), and blurred vision (5). Similarly, the symptoms presented by the control subjects include tiredness (2), dry eye (2), and blurred vision (5). Basic demographic data are shown in table 1.
Control group vs. PD group: Ishihara color test
The scores of PD patients and control subjects were normal (91.89% and 97.37%, respectively; P=0.358).
Control group vs. PD group: visual evoked potentials
The mean (SD) P100 cortical latencies obtained after stimulating the right eye of controls and PD patients were 106.35(6.99) ms and 108.36(10.23) ms (P=0.365), respectively. The mean cortical latencies for the left eye were 108.15(6.97) and 109.13(8.87) ms (P=0.728), respectively. The average of the P100 latencies of the right and left eyes were 107.25(6.57) ms and 108.75(9.27) ms, respectively in controls and PD patients (P=0.516). Thus, the cortical VEP responses (P100), with a visual angle of 30', showed similar latencies in both patients and controls.
Within the control group, there was a positive correlation between the age, and the cortical VEP latencies of the right and left eyes (r=0.42543 and 0.43343, respectively; P=0.0108 and 0.0093, respectively), and between the age and the average of the latencies of the right and left eye (r=0.41969, P=0.0121). In the PD group, there was no correlation between the age and the VEP latencies of the right and left eyes (r=0.05669 and 0.10101; P=0.7214 and 0.5245, respectively), and the average of the latencies of the right and left eyes (r=0.07507; P=0.6366). There was no correlation between the PD duration and the VEP latencies for the right eyes and left eyes (r=0.21453 and r=0.07592; P=0.1725 and 0.6328, respectively), as well as between the PD duration and the average of the VEP latencies of the right and left eyes (r=0.13992, P=0.3768). There was no correlation between the HY stage and the VEP latencies of the right and left eyes (r=0.06210 and 0.03200, respectively; P=0.6960 and 0.8405, respectively), and between the HY stage and the average of the VEP latencies of the right and left eyes (r=0.04989, P=0.7537). There was no correlation between the UPDRS total scores and the VEP latencies for the right and left eye (r=0.1482 and 0.20985, respectively; P=0.3635 and 0.1822, respectively), and between the UPDRS total scores and the average of the latencies of both eyes (r=0.21471, P=0.1721).
Control group vs. PD Group: optical coherence tomography
The mean (SD) interocular RNFL thickness was similar in controls [104.17 (12.31) μm] and PD patients [102.68 (11.50) μm] (P=0.169). The inner, outer, and, the total layer thicknesses as well as the volumes of the parafoveal and perifoveal regions of both eyes of the PD patients were similar to those of controls. The OCT results are summarised in tables 2 and 3.
Correlations in PD group
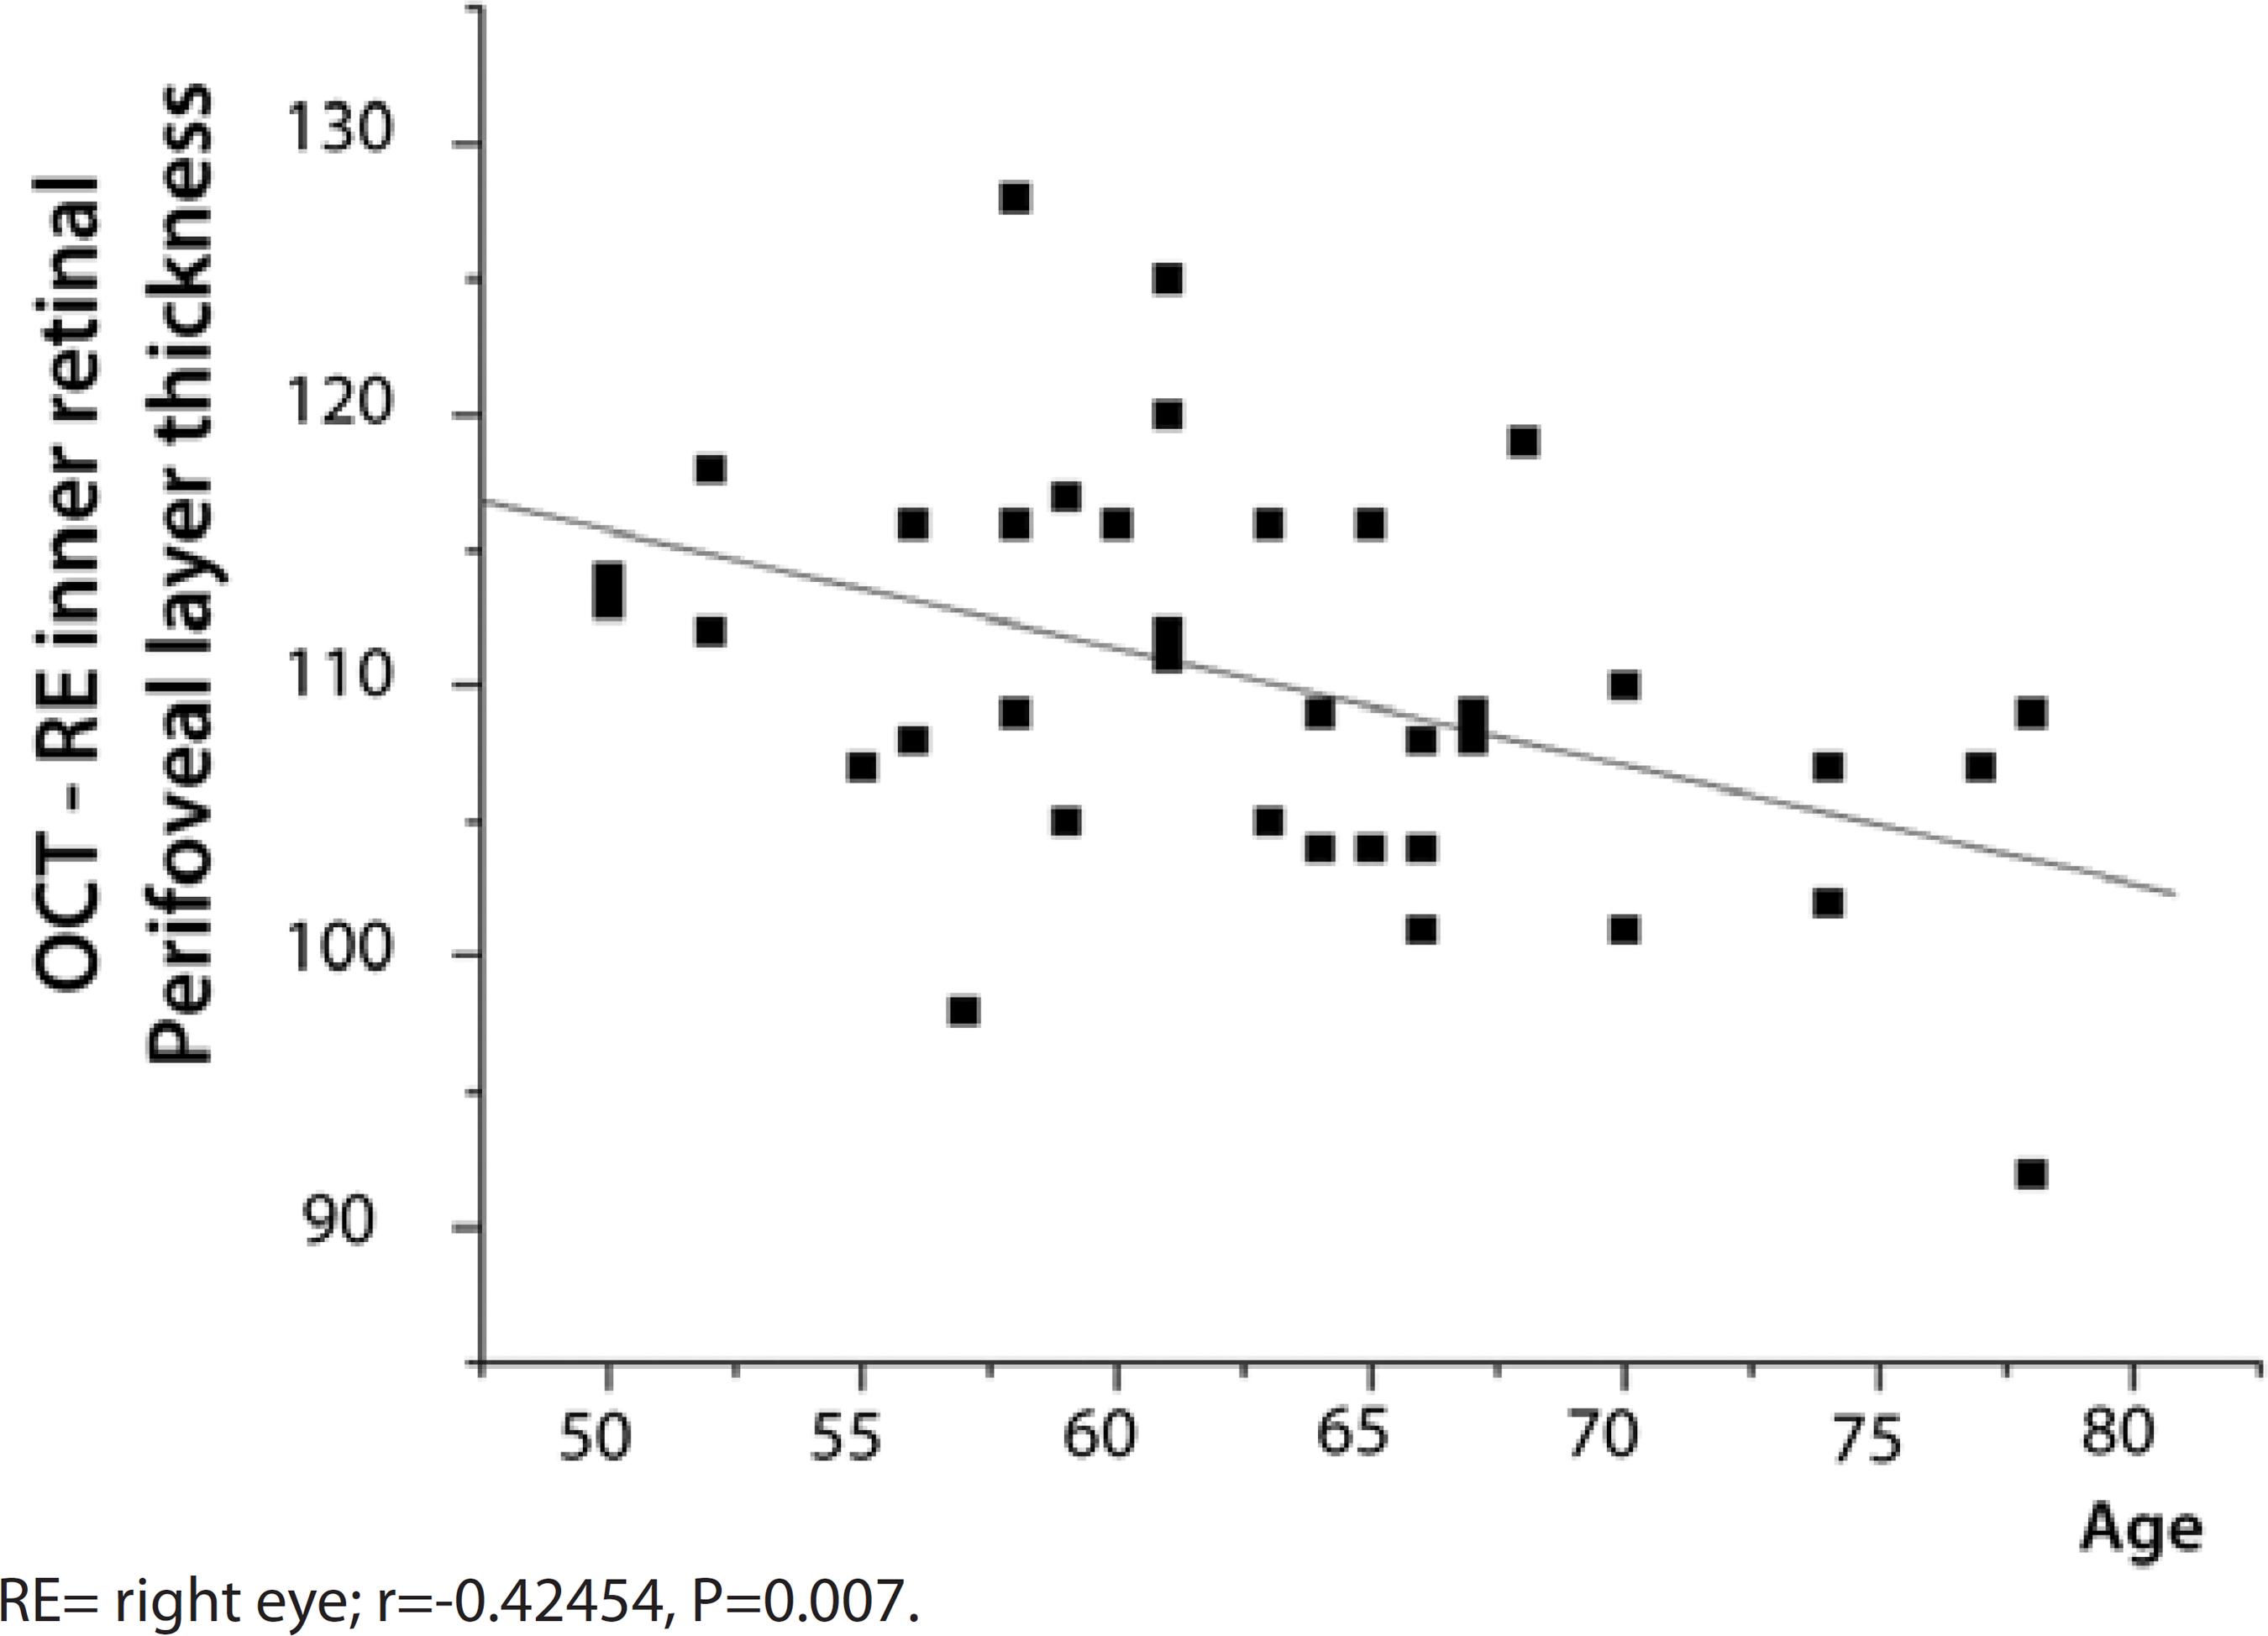
A negative correlation was found between the age of the PD patients and the retinal layer thickness as well as the volume. Increased age was associated with a thinner right eye inner perifoveal layer (Figure 1), lower right eye inner perifoveal layer volume (r=-0.41840, P=0.0080), and lower total right eye perifoveal layer thickness (r=-0.32039, P=0.0468).
There was no correlation between the PD patients' age and the inner and outer parafoveal thicknesses and volumes of the right eye, and between the age and the inner and outer parafoveal and perifoveal thicknesses and volumes of the left eye (r<-0.20)
A negative correlation was observed between the disease duration and the retinal layer thickness and volume. Extended disease duration was associated with reduced left eye inner parafoveal layer thickness and volume (r=-0.35717, P=0.0256).
There was a negative correlation between the total UPDRS scores and the total parafoveal thickness (r=-0.33281, P=0.0383).
There was no correlation between the HY stage and the retinal layer thickness and volume in either eyes (r<0.1, P>0.05). The RNFL did not correlate with patients' age, PD duration, or the HY stage (P>0.05). There was no correlation among the RNFL thickness, VEP latency, patients' age, PD duration, or the HY stage (r<-0.20; P>0.05).
The mean RNFL thickness correlated positively to the inner perifoveal retinal layer thickness (r=0.60302, P<0.0001), its volume (r=0.59759, P<0.0001), and to the total parafoveal layer thickness (r=0.46176, P=0.0031). The VEP latencies were not correlated to the inner perifoveal and parafoveal retinal layer thickness or volume (r<0.20, P>0.05).
The mean interocular outer parafoveal retinal layer thicknesses (SD) were, 183.7 (8.40) μm in females and 188.21 (8.02) μm in males (P=0.036). The mean interocular outer parafoveal retinal layer volumes (SD) were, 1.15 (0.05) mm3 in females vs. 1.17 (0.09) mm3 in males (P=0.040). The total parafoveal layer thicknesses (SD) were, 302.97 (11.81) μm in females vs. 313.52 (13.48) μm in males (P=0.017). The VEP P100 latency was lower in female (104.88 ms) than in males (111.13 ms, P=0.002) PD patients. In controls, gender-specific differences in VEP or retinal layer thicknesses were not observed.
There was no correlation among the presence of visual symptoms, the mean interocular retinal layer thicknesses and volumes (inner and outer, parafoveal and perifoveal), the RNFL thickness, and the mean P100 VEP latency (r<0.20, P>0.05).
There was no correlation among the Ishihara scores, the mean interocular retinal layer thickness, its volume, the mean interocular RNFL thickness, and the mean interocular P100 VEP latency (r<0.20, P>0.05).
Correlations within the control group
Older age was positively correlated with increased VEP latencies of the right eye (r=0.42543, P=0.0108) and the left eye (r=0.43343, P=0.0093), as well as with increased mean VEP latencies (r=0.41969, P=0.0121).
Older age negatively correlated with reduced right eye total perifoveal retinal layer thickness (r=-0.32861, P=0.0440), left eye inner perifoveal layer thickness (r=-0.38507 P=0.0170), and volume (r=-0.39097, P=0.0152). Older age correlated negatively with lower mean inner perifoveal thickness (r=-0.3483, P=0.0318) and volume (r=-0.33693, P=0.0386).
The mean interocular retinal layer thicknesses and volumes (inner and outer, parafoveal and perifoveal), the mean interocular RNFL thickness, and the mean interocular P100 VEP latency of males and females were similar (P>0.05).
The RNFL thickness did not correlated with age (r=-0.17161, P=0.3029). There was a positive correlation between the RNFL thickness and the mean interocular parafoveal inner layer thickness (r=0.39658, P=0.0124) as well as between the RNFL thickness and volume (r=0.39332, P=0.0132). The RNFL thickness positively correlated with the mean interocular inner perifoveal thickness (r=-0.61725, P<0.0001) and volume (r=0.63374, P<0.0001), the mean interocular outer perifoveal thickness (r=0.40547, P=0.0104) and volume (r=0.41664, P=0.0083), and with the mean interocular total perifoveal thickness (r=0.5466, P=0.0003).
There was no correlation between the RNFL thickness and the VEP latency (r=-0.23014, P=0.1835).
The complaints regarding vison did not correlate with the mean interocular retinal layer thickness (inner and outer, parafoveal and perifoveal), mean interocular RNFL thickness, and mean interocular P100 VEP latency (r<0.20, P>0.05).
DISCUSSION
The impact of PD increases with life expectancy. Difficulty in reading, tiredness of the eyes, diplopia, and blurring of vision are commonly experienced by PD patients(1515 Fenelon G, Mahieux F, Huon R, Ziegler M. Hallucinations in Parkinson's disease: prevalence, phenomenology and risk factors. Brain. 2000;123(Pt 4):733-45.). Impairments in vision can be due to dysfunctions ranging from that of the extrinsic ocular muscles to that of the occipital visual cortex(1616 Archibald NK, Clarke MP, Mosimann UP, Burn DJ. Retinal thickness in Parkinson's disease. Parkinsonism Relat Disord. 2011;17(6):431-6.,1717 Almer Z, Klein KS, Marsh L, Gerstenhaber M, Repka MX. Ocular motor and sensory function in Parkinson's disease. Ophthalmology. 2012;119(1):178-82.). Whereas some deficits likely originate from the central processing tertiary visual areas, other symptoms are related to the alterations in visual acuity and colour, motion, as well as contrast perception. These symptoms have rarely been associated with PD(1616 Archibald NK, Clarke MP, Mosimann UP, Burn DJ. Retinal thickness in Parkinson's disease. Parkinsonism Relat Disord. 2011;17(6):431-6.). However, one post-mortem study that employed liquid chromatography found reduced dopamine content in the retinas of PD patients(1818 Harnois C, Di Paolo T. Decreased dopamine in the retinas of patients with Parkinson's disease. Invest Ophthalmol Vis Sci. 1990;31(11):2473-5.).
Because PD occurs predominately in population over the age of 50, it was hypothesised that there could be a higher incidence of vision-related complaints in these patients than in controls. However, our results show that visual impairments occurred both in patients (31.58%) and controls (22.22%). Thus, our cohort of PD patients did not emphasise visual complaints other than those secondary to their handicapping motor symptoms(1919 Bodis-Wollner I, Antal A. Primary visual and visuocognitive deficits. In: Pfeiffer RF, Bodis-Wolllner I, editors. Parkinson's disease and nonmotor dysfunction. Totowa, NJ: Humana Press; 2005. cap 20. p.233-44.). Similar to that observed in control group, the most frequently encountered visual symptoms in PD patients were the visual tiredness and blurred vision.
The mean age of this cohort of 43 PD patients was 63.07 years (79.02% between 50 and 69 years), which was similar to that in the control group of 38 individuals (62.39 years). The mean PD duration and HY stage were 6.97 years and 1.78, respectively, which indicated instances of initial to intermediate stages of PD. The total UPDRS mean score (SD) was 17.63 (8.99), indicating a light to moderate severity of PD symptoms.
The results of the Ishihara visual color test were normal for 91.89% of PD patients and 97.37% of controls. These results suggested that the Ishihara visual color test is not appropriate for assessing the colour vision of PD patients. The Farnsworth-Munsell 100 colour test is considered as the best method for evaluating the color perception(2020 Marras C, Schuele B, Munhoz RP, Rogaeva E, Langsto JW, Kasten M, et al. Phenotype in parkinsonian and nonparkinsonian LRRK2 G2019S mutation carriers. Neurology. 2011;77(4):325-33.).
The VEP P100 latencies of the PD patients and age-matched controls were similar. We chose the 30' angle check size because it is between the 60' (1 degree, perimacular function test) and the 15' (0.25 degree, foveal function test) check sizes. Because various studies used different VEP stimuli, a comparison of the results is not practical(66 Mariani AP. Amacrine cells of the rhesus monkey retina. J Comp Neurol. 1990;301(3):382-400.,2121 Bodis-Wollner I. Visual deficits related to dopamine deficiency in experimental animals and Parkinson's disease patients. Trends Neurosci. 1990;13(7):296-302.,2222 Masson G, Mestre D, Blin O. Dopaminergic modulation of visual sensitivity in man. Fundam Clin Pharmacol. 1993;7(8):449-63.). The VEP latencies did not correlate with the age, PD duration, and the HY stage. However, the VEP latencies and age of subjects in the control group showed an expected positive correlation. Thus, the pattern-shift VEP is a relatively poor method for assessing the anterior visual pathway dysfunction because it is incapable of differentiating impaired macular function from impaired ganglion cell function. However, the pattern electroretinogram would be able to differentiate these processes and assess the status of the retinal ganglion cells(2323 Sartucci F, Orlandi G, Lucetti C, Bonuccelli U, Murri L, et al. Visuo-cognitive dysfunctions in Parkinson's disease. J Clin Neurophysiol. 2003;20(5):375-81.).
The spectral-domain OCT data did not show any differences in the inner or outer parafoveal and perifoveal retinal layer thicknesses and volume between the PD patients and controls. The PD stage did not correlate with the retinal layer thickness. Our results contradict the results of an earlier spectral-domain OCT study, which found inner retinal macular layer thinning in 24 PD patients(1212 Hajee ME, March WF, Lazzaro DR, Wolintz AH, Shrier EM, Glazman S, et al. Inner retinal layer thinning in Parkinson disease. Arch Ophthalmol. 2009;127(6):737-41.). Altintas et al., who used time-domain OCT in their study of 17 PD patients (11 controls) found a thinning of the inner superior, outer inferior temporal, and nasal macular regions, as well as a lower mean macular volume and an inverse correlation between the foveal thickness and motor handicap(1111 Altintas O, Iseri P, Ozkan B, Caglar Y. Correlation between retinal morphological and functional findings and clinical severity in Parkinson's disease. Doc Ophthalmol. 2008;116(2):137-46.). Albrecht et al. found a thicker inner nuclear layer in 40 PD patients. Factors, such as the different methods used for measuring the retinal layers and measuring only at their thickest sections, may have contributed to these differences(2424 Albrecht P, Muller A K, Sudmeyer M, Ferrea S, Ringelstein M, et al. Optical coherence tomography in parkinsonian syndromes. PLOS One. 2012;7(4):e34891.). The relatively smaller sample size used in earlier studies may also have contributed to the differences in the results of OCT(1212 Hajee ME, March WF, Lazzaro DR, Wolintz AH, Shrier EM, Glazman S, et al. Inner retinal layer thinning in Parkinson disease. Arch Ophthalmol. 2009;127(6):737-41.,1616 Archibald NK, Clarke MP, Mosimann UP, Burn DJ. Retinal thickness in Parkinson's disease. Parkinsonism Relat Disord. 2011;17(6):431-6.).
Our results are similar to that of Archibald et al., who found no differences between the macular thicknesses of 32 PD patients and 19 controls(1616 Archibald NK, Clarke MP, Mosimann UP, Burn DJ. Retinal thickness in Parkinson's disease. Parkinsonism Relat Disord. 2011;17(6):431-6.). Schneider et al used a newly developed semiautomatic algorithm for spectral domain OCT. This algorithm enabled a retinal single-layer analysis and calculation of the average thickness of retinal layers in Parkinsonian syndromes. The authors calculated the average thickness of single retinal layers to foveal scans of 65 PD patients, 16 progressive supranuclear palsy (PSP) patients, 12 patients with multiple system atrophy (MSA), and 41 matched controls. Compared with controls, a significant reduction in the thickness of retinal layers was found only in PSP and MSA patients. The single retinal layer measurement of the PD patients revealed no significant changes. Notably, the thickening of the outer nuclear layer in PSP and that of the outer plexiform layer in MSA was highly specific to these diseases and helped distinguish PSP from MSA with high sensitivity and specificity(2525 Schneider M, Muller HP, Lauda F, Tumani H, Ludolph AC, Kassubeck J, et al. Retinal single-layer analysis in Parkinsonian syndromes: an optical coherence tomography study. J Neural Transm. 2014;121(1):41-7.).
The thickness of the RNFL of the PD patients was similar to that of the control subjects. Previous reports of OCT studies described a thinner RNFL in PD patients(1010 Inzelberg R, Ramirez JA, Nisipeanu P, Ophir A. Retinal nerve fiber layer thinning in Parkinson disease. Vision Res. 2004;44(24):2793-7.,1111 Altintas O, Iseri P, Ozkan B, Caglar Y. Correlation between retinal morphological and functional findings and clinical severity in Parkinson's disease. Doc Ophthalmol. 2008;116(2):137-46.,1313 Moschos MM, Tagaris G, Markopoulos I, Margetis I, Tsapakis S, et al. Morphologic changes and functional retinal impairment in patients with Parkinson disease without visual loss. Eur J Ophthalmol. 2011;21(1):24-9.). However, Archibald et al. who employed time-domain OCT found no such thinning of the RNFL in PD patients(1616 Archibald NK, Clarke MP, Mosimann UP, Burn DJ. Retinal thickness in Parkinson's disease. Parkinsonism Relat Disord. 2011;17(6):431-6.). The RNFL thickness did not correlate with patient's age, PD disease duration, and HY stage. Similar to that found in the control group, a positive correlation between the retinal layer thickness, volume, and RNFL thickness was observed. However, further studies are needed to verify the validity of these results.
The effect of aging on retinal layer thickness was seen in both PD and controls, suggesting that the retinal thinning was age-related and cannot be considered as a biomarker of this disease. The male PD patients showed higher retinal layer thickness and volume than the female patients. Such gender differences were not observed in control group. A predominance of the initial stages of the disease was seen in the PD group. The HY stage did not correlate with the retinal layer thickness and volume. There were no correlations between VEP latencies and the retinal layer thickness and volume.
In PD patients, gender differences in the mean outer interocular parafoveal and total thickness and the mean outer interocular parafoveal volume were observed. These values were lower in females. However, such gender differences were not observed in the control group.
In both PD patients and controls, there was no correlation between complaints regarding vision, mean interocular retinal layer and mean RNFL thicknesses, retinal layer volumes, and the mean VEP latencies.
During this study, we encountered technical problems such as tremor interferences in OCT and VEP analyses. Therefore, we excluded those patients who could not tolerate the examinations and registers that did not have technical requirements for the analysis. Despite these technical difficulties, our study included a considerable number of subjects because our inclusion/exclusion criteria were rigorous and excluded ocular and systemic pathologies.
REFERENCES
-
1Lang AE, Lozano AM. Parkinson's disease: first of two parts. N Engl J Med. 1998;339(15):1044-53.
-
2Braak H, Del Tredici K, Bratzke H, Hamm-Clement J, Sandmann-Keil D, Rüb U. Staging of the intracerebral inclusion body pathology associated with idiopathic Parkinson's disease (preclinical and clinical stages). J Neurol. 2002;249 Suppl 3:III/1-5.
-
3Bodis-Wollner I, Yahr M. Measurements of visual evoked potentials in Parkinson's disease. Brain 1978;101(4):661-71.
-
4Regan D, Neima D. Low-contrast letter charts in early diabetic retinopathy, ocular hypertension, glaucoma and Parkinson's disease. Br J Ophthalmol. 1984;68(12):885-9.
-
5Onofrj M, Ghilardi MF, Basciani M, Gambi D. Visual evoked potentials in Parkinsonism and dopamine blockade reveal a stimulus-dependent dopamine function in humans. J Neurol Neurosurg Psychiatry. 1986;49(10):1150-9.
-
6Mariani AP. Amacrine cells of the rhesus monkey retina. J Comp Neurol. 1990;301(3):382-400.
-
7Kolb H, Cuenca N, Wang HH, Dekorver L. The synaptic organization of the dopaminergic amacrine cell in the cat retina. J Neurocytol. 1990;19(3):343-66.
-
8Witkovsky P, Nicholson C, Rice ME, Bohmaker K, Meller E. Extracellular dopamine concentration in the retina of the clawed frog, Xenopus laevis. Proc Natl Acad Sci USA. 1993;90(12):5667-71.
-
9Bodis-Wollner I, Antal A. Optic nerve and central nervous dysfunctions: Parkinson's disease and multiple sclerosis. In: Heckenlively JR, Arden GB, editors. Principles and practice of clinical electrophysiology of vision 2nd ed. Cambridge, Massachusetts, London, England: The Mit Press; 2006. p.867-88.
-
10Inzelberg R, Ramirez JA, Nisipeanu P, Ophir A. Retinal nerve fiber layer thinning in Parkinson disease. Vision Res. 2004;44(24):2793-7.
-
11Altintas O, Iseri P, Ozkan B, Caglar Y. Correlation between retinal morphological and functional findings and clinical severity in Parkinson's disease. Doc Ophthalmol. 2008;116(2):137-46.
-
12Hajee ME, March WF, Lazzaro DR, Wolintz AH, Shrier EM, Glazman S, et al. Inner retinal layer thinning in Parkinson disease. Arch Ophthalmol. 2009;127(6):737-41.
-
13Moschos MM, Tagaris G, Markopoulos I, Margetis I, Tsapakis S, et al. Morphologic changes and functional retinal impairment in patients with Parkinson disease without visual loss. Eur J Ophthalmol. 2011;21(1):24-9.
-
14Daniel SE, Lees AJ. Parkinson's Disease Society Brain Bank, London: overview and research. J Neural Transm Suppl. 1993;39:165-72.
-
15Fenelon G, Mahieux F, Huon R, Ziegler M. Hallucinations in Parkinson's disease: prevalence, phenomenology and risk factors. Brain. 2000;123(Pt 4):733-45.
-
16Archibald NK, Clarke MP, Mosimann UP, Burn DJ. Retinal thickness in Parkinson's disease. Parkinsonism Relat Disord. 2011;17(6):431-6.
-
17Almer Z, Klein KS, Marsh L, Gerstenhaber M, Repka MX. Ocular motor and sensory function in Parkinson's disease. Ophthalmology. 2012;119(1):178-82.
-
18Harnois C, Di Paolo T. Decreased dopamine in the retinas of patients with Parkinson's disease. Invest Ophthalmol Vis Sci. 1990;31(11):2473-5.
-
19Bodis-Wollner I, Antal A. Primary visual and visuocognitive deficits. In: Pfeiffer RF, Bodis-Wolllner I, editors. Parkinson's disease and nonmotor dysfunction. Totowa, NJ: Humana Press; 2005. cap 20. p.233-44.
-
20Marras C, Schuele B, Munhoz RP, Rogaeva E, Langsto JW, Kasten M, et al. Phenotype in parkinsonian and nonparkinsonian LRRK2 G2019S mutation carriers. Neurology. 2011;77(4):325-33.
-
21Bodis-Wollner I. Visual deficits related to dopamine deficiency in experimental animals and Parkinson's disease patients. Trends Neurosci. 1990;13(7):296-302.
-
22Masson G, Mestre D, Blin O. Dopaminergic modulation of visual sensitivity in man. Fundam Clin Pharmacol. 1993;7(8):449-63.
-
23Sartucci F, Orlandi G, Lucetti C, Bonuccelli U, Murri L, et al. Visuo-cognitive dysfunctions in Parkinson's disease. J Clin Neurophysiol. 2003;20(5):375-81.
-
24Albrecht P, Muller A K, Sudmeyer M, Ferrea S, Ringelstein M, et al. Optical coherence tomography in parkinsonian syndromes. PLOS One. 2012;7(4):e34891.
-
25Schneider M, Muller HP, Lauda F, Tumani H, Ludolph AC, Kassubeck J, et al. Retinal single-layer analysis in Parkinsonian syndromes: an optical coherence tomography study. J Neural Transm. 2014;121(1):41-7.
-
Funding: No specific financial support was available for this study.
Publication Dates
-
Publication in this collection
Jul-Aug 2014
History
-
Received
03 Sept 2013 -
Accepted
01 May 2014