ABSTRACT
BACKGROUND
Leathery Murdah, Terminalia coriacea (Roxb.) Wight & Arn. from family Combretaceae is used in Ayurveda and Siddha traditional systems of medicine to heal ulcers.
OBJECTIVE
The present study was conducted to assess the gastroprotective effect and understand the fundamental mechanism of action of Leathery Murdah, Terminalia coriacea (Roxb.) Wight & Arn. Leaf Methanolic Extract.
METHODS
The test extract was screened for anti-ulcer activity by Aspirin induced ulcerogenesis in pyloric ligation and ethanol induced gastric ulcers at three doses - 125, 250, and 500 mg/kg, p.o. using Ranitidine 50 mg/kg and Misoprostol 100 μg/kg as standard drug in respective models. Seven parameters were carefully examined, that is, ulcer index, total protein, mucin, catalase, malondialdehyde, and superoxide dismutase levels and histopathology. High Performance Liquid Chromatographic - Ultra Violet profiling and Liquid Chromatography - Mass Spectral analysis of crude Terminalia coriacea leaves methanolic extract were carried out as a part of chemical characterization to identify bioactive compounds.
RESULTS
All the test doses exhibited significant gastroprotective function, particularly the higher doses demonstrated improved action. The results revealed a significant increase in the levels of catalase, superoxide dismutase, and Mucin with reduction in ulcer index, the levels of total protein, and malondialdehyde. Histopathological observations also illustrated the gastroprotective effect of Terminalia coriacea leaves methanolic extract.
CONCLUSION
Terminalia coriacea leaves methanolic extract exhibited strong anti-oxidant and anti-secretory activities mediated gastroprotection besides inducing the gastric mucosal production. The observed pharmacological response can be attributed to the flavonoidal compounds namely - Quercetin-3-O-rutinoside, Luteolin-7-O-glucoside, Myricetin hexoside, Quercetin-3-O-glucoside, Isorhamnetin-3-O-rhamnosylglucoside and Isorhamnetin-3-O-glucoside identified in the extract for the first time with High Performance Liquid Chromatographic - Ultra Violet and Liquid Chromatography - Mass Spectral analysis.
HEADINGS
Gastric Mucosa; Terminalia; Plant extracts; Peptic ulcer
RESUMO
CONTEXTO
Leathery Murdah, Terminalia coriacea (Roxb.) Wight & Arn. da família Combretaceae é usada nos tradicionais sistemas da medicina Ayurveda e Siddha para cicatrização de úlceras.
OBJETIVOS
O presente estudo foi realizado para avaliar o efeito gastroprotetor e para esclarecer o mecanismo fundamental da ação do extrato metanólico de folhas de Leathery Murdah, Terminalia coracea (Roxb.) Wight & Arn.
MÉTODOS
O extrato teste foi testado para ação antiulcerogênica induzida pela Aspirina através da ligação pilórica e úlceras gástricas induzidas por etanol em três doses - 125, 250 e 500 mg/kg, via oral, utilizando-se Ranitidina 50 mg/kg e Misoprostol 100 μg/kg como drogas padrão nos respectivos modelos. Sete parâmetros foram cuidadosamente analisados tais como índice ulcerogênico, níveis de proteínas totais, de mucina, de catalase, de malondialdeído e de superoxido dismutase, além da histopatologia. A análise do perfil espectroscópico pela Cromatografia Líquida de Alta Eficiência - Ultravioleta e análise crua pela Cromatografia Líquida - Espectrometria de Massas foram realizadas como parte da caracterização química para identificar os componentes bioativos.
RESULTADOS
Todas as doses utilizadas exibiram função gastroprotetora, em particular as doses mais elevadas. Os testes revelaram aumentos significantes de catalase, superóxido dismutase e mucina, com diminuição do índice ulcerogênico, dos níveis de proteínas totais, e de malondialdeído. As observações histopatológicas também ilustraram o efeito gastroprotetor do extrato metanólico de folhas de Terminalia coracea.
CONCLUSÃO
O extrato metanólico de folhas de Terminalia coracea mostrou forte atividade antioxidante e antissecretória além de induzir a produção de mucosa gástrica. A resposta farmacológica observada pode ser atribuída aos compostos flavonoides denominados Quercetin-3-O-rutinosideo, Luteolin-7-O-glucosideo, Myricetin hexosideo, Quercetin-3-O-glucosideo, Isorhamnetin-3-O-rhamnosylglucosideo e Isorhamnetin-3-O-glucosideo, identificados no extrato pela primeira vez pelas análises de Cromatografia Líquida de Alta Eficiência - Ultravioleta e Cromatografia Líquida - Espectrometria de Massas.
DESCRITORES
Mucosa gástrica; Terminalia; Extratos vegetais; Úlcera péptica
INTRODUCTION
Peptic ulcer disease (PUD) is one of the most prevalent gastrointestinal disorders with high annual incidence and significant mortality rates. Unfortunately, the drugs available for the treatment of PUD confer simple to severe side effects like arrhythmias, gynaecomastia, enterochromaffin like hyperplasia and hematopoietic changes like leucopoenia and thrombocytopenia, limiting drug utility and leading the demand of a safe and effective gastroprotective agents especially for the people of non-industrialized countries2828. Khan MSA, Mat Jais AM, Khan M, Zakaria ZA, Ranjbar M. Gastroprotective effect of Tabernaemontana divaricata (L). R.Br. flower methanolic extract in rats. Pharmacologyonline . 2011b;2:24-35.. An extensive research is being conducted on herbs to discover and identify remedies and lead compounds for the management of PUD as a consequence of growing interest in natural products and complementary and alternative therapies. In this context, we have also been studying traditional herbs in Ayurveda, Siddha and Unani systems of medicine11. Ahmed N, Khan MSA, Mat Jais AM, Mohtarrudin N, Ranjbar M, Amjad MS, et al. Anti-ulcer activity of sandalwood (Santalum album L.) stem hydroalcoholic extract in three gastric-ulceration models of Wistar rats. Bol Latinoam Caribe Plant Med Aromat. 2013;12:81-91.,2626. Khan MSA, Hussain SA, Mat Jais AM, Zakaria ZA, Khan M. Anti-ulcer activity of Ficus religiosa stem bark ethanolic extract in rats. J Med Plants Res. 2011a; 5:354-9.
27. Khan MSA, Mat Jais AM, Afreen A. Prostaglandin analogous and antioxidant activity mediated gastroprotective action of Tabernaemontana divaricata (L.) R. Br. flower methanolic extract against chemically induced gastric ulcers in rats. Biomed Res Intl. 2013;2013:1-18.-2828. Khan MSA, Mat Jais AM, Khan M, Zakaria ZA, Ranjbar M. Gastroprotective effect of Tabernaemontana divaricata (L). R.Br. flower methanolic extract in rats. Pharmacologyonline . 2011b;2:24-35.. Leathery Murdah, Terminalia coriacea (Roxb.) Wight & Arn. (Combretaceae) is a traditional herb used in Siddha for the treatment of ulcers. Terminalia coriacea is found in parts of Andhra Pradesh and Tamil Nadu states of India. It is called as “Tani” or “Nalli maddi” by the locals and it is used as cattle feed1313. Chetty KM, Sivaji K, Rao KT. Flowering plants of Chittoor District. 2nd ed., Andhra Pradesh, India: Students Offset Printers and Publishers, Tirupathi. 2008. p. 125-6.,3131. Kirtikar R, Basu BD. Terminalia coriacea. In: Indian Medicinal Plants. 2nd ed., Allahabad, India: Lolit Mohan Basu Publication. 1935. p. 1028-9.. Our previous studies reveal that T. coriacea has anti-convulsant, anti-inflammatory, anti-nociceptive, anti-pyretic and wound healing properties88. Bhatt CSB, Khan MSA. Preliminary phytochemical screening, acute toxicity studies and anti-pyretic activity of Terminalia coriacea stem bark aqueous extract. Abstract book of 62nd Indian Pharmaceutical Congress (2010). Manipal. pp. 343.,2525. Khan MSA, Hasan MW, Shereen M, Sultana T, Dastagir IM, Ali AJ, et al. Anti-nociceptive effect of Terminalia coriacea (Roxb.) Wight & Arn. leaf methanolic extract. Pharmacologyonline . 2011c;7:1176-89.,2929. Khan MSA, Mat Jais AM, Zakaria ZA, Mohtarrudin N, Ranjbar M, Khan M, et al. Wound healing potential of Leathery Murdah, Terminalia coriacea {Roxb.} Wight & Arn. Phytopharmacology. 2012; 3:158-68.,4848. Pasha SG, Khateeb MS, Pasha SA, Khan MSA, Shankaraiah P. Anti-epileptic activity of methanolic extract of Terminalia coriacea {Roxb.} Wight & Arn. in rats. J Adv Pharm Technol Res. 2013;3:502-10.,6161. Siddiqua F. Anti-oedematogenic and anti-inflammatory activities of Terminalia coriacea (Roxb.) Wight & Arn. stem bark aqueous extract in three experimental models. Master of Pharmacology Thesis . Anwarul Uloom College of Pharmacy affiliated to Jawaharlal Nehru Technological University, Hyderabad, 2014.. The present study focuses on the assessment of phytochemicals and gastroprotective potential of Terminalia coriacea leaves methanolic extract (TCLME) in view of its traditional use.
METHODS
Plant material and the preparation of extract
The fresh leaves of Leathery Murdah, Terminalia coriacea (Roxb.) Wight & Arn. (Synonyms - T. alata, T. crenulata, T. elliptica, T. tomentosa) belonging to the Combretaceae family were collected from Talakonda forest, Tirumala Hills, Tirupathi, Andhra Pradesh, India. The plant material was authenticated by a plant taxonomist, Dr. P. V. Prasanna (Scientist-E) at the Botanical Survey of India, Deccan Regional Centre, Hyderabad (establishment under the Ministry of Environment & Forests, Government of India). The specimen deposited in the herbarium was assigned a voucher number BSID 882. After collection, the leaves were shade dried and coarsely powdered. The extraction was carried out in six phases; in each phase approximately 110 gm of the powdered leaves were extracted using methanol AR (SD Fine-Chem Limited) in a soxhlet apparatus in 1:4 ratio. The extract was concentrated under reduced pressure and stored in an airtight container in a refrigerator at the temperature below 10°C. The solution of TCLME was prepared using distilled water for the evaluation of the anti-ulcer activity.
Drugs and chemicals
Chloroform AR, diethyl ether LR, methanol AR, phenolphthalein pH indicator solution, and sodium hydroxide pellets were procured from SD Fine-Chem Limited, Mumbai, while pure aspirin was obtained from Divis Laboratories, Hyderabad. Absolute Ethanol was purchased from Changshu Yangyuan Chem, China, Ranitidine (as Rantac 150 mg) from J.B Chemicals and Pharmaceuticals, Mumbai and Misoprostol (as Misoprost-200) from Cipla Ltd., Goa, while surgical spirit was obtained from Kakatiya Pharma, Hyderabad. Topfer’s reagent and distilled water were obtained from Nice Chemicals, China, and Stangen Fine Chemicals, Hyderabad, respectively. All chemicals were used without further purification.
Animals
Adult male Wistar rats weighing 150-200 gm were used for the evaluation of anti-ulcer activity. The animals were maintained under standard laboratory conditions in polypropylene cages under 12 hr light/dark cycle, controlled temperature (24±2°C), fed with commercial pellet diet, and water ad libitum in an animal house approved by the Committee for the Purpose and Supervision of Experiments on Animals (Reg. no. 1534/PO-/a/11/CPCSEA). All the animals were acclimatized to the laboratory environment for 10 days before the initiation of experiments. The protocol (IAEC/AUCP/2011-12/03) was approved by the Institutional Animal Ethical Committee before the commencement of animal experimentation. All measures were taken to ensure that the experiments were conducted in accordance with the instructions of IAEC, Anwarul Uloom College of Pharmacy, New Mallepally, Hyderabad, Andhra Pradesh, India.
Acute toxicity test and selection of test doses
Three test doses (125, 250, and 500 mg/kg) of TCLME were selected based on our earlier report where maximum safe dose was found to be 2000 mg/kg, p.o.2525. Khan MSA, Hasan MW, Shereen M, Sultana T, Dastagir IM, Ali AJ, et al. Anti-nociceptive effect of Terminalia coriacea (Roxb.) Wight & Arn. leaf methanolic extract. Pharmacologyonline . 2011c;7:1176-89.. In order to determine LD50, the method described by Chinedu et al. (2013) was followed with slight modification1414. Chinedu E, Arome D, Ameh FS. A new method for determining acute toxicity in animal models. Toxicol Intl. 2013;20:224-6.. Briefly, the study was carried out in eight stages with three test doses given from second to eighth stages. Doses of 50-5000 mg/kg were given in the first four stages (Stage - 1: 50, 200, 400, 800; Stage - 2: 1000, 1500, 2000; Stage - 3: 3000, 4000, 5000). The method was extended and doses from 6000-20,000 mg/ kg, p.o. were given in later four stages with an incremental dose of 1000 mg/ kg, p.o. to female albino Wistar rats. Each dose was administered to one rat and they were observed for 24 hours for mortality and signs of toxicity. A confirmatory test was performed at the end of each stage by administering the highest dose of each level to one more animal to confirm the lethality. The total number of animals used for acute toxicity study was 33 (inclusive of confirmatory test).
Analytical profile of TCLME
• Confirmatory chemical tests for flavonoids
TCLME was subjected to Alkali reagent, Zinc-Hydrochloric acid and Shinoda tests to reconfirm presence of flavonoids2020. Harborne JB. Phytochemical methods. 3rd ed., London: Chapman and Hall. 1978. p. 135.,3030. Khandelwal KR. Practical Pharmacognosy. 12th ed., Pune: Nirali Prakashan. 2004. p. 149-60.,3232. Kokate CK, Purohit AP, Gokhale SB. Pharmacognosy. 39th ed., Pune: Nirali Prakashan . 2007. p. 108-9..
• High Performance Liquid Chromatographic (HPLC) and Ultra Violet (UV) spectroscopic analysis
HPLC-UV analysis was carried out at Analytical Development Laboratory, Mylan Laboratories Limited, Bollaram, Hyderabad with the method described earlier by Khan et al.2727. Khan MSA, Mat Jais AM, Afreen A. Prostaglandin analogous and antioxidant activity mediated gastroprotective action of Tabernaemontana divaricata (L.) R. Br. flower methanolic extract against chemically induced gastric ulcers in rats. Biomed Res Intl. 2013;2013:1-18.. Briefly, HPLC analysis of TCSBAE was performed by gradient system using Waters 2996 Photo Diode Array HPLC System with Kromasil C18 - (250 X 4.5 mm, 5 μm) column. Two solvents, A (water with 0.1% trifluoroacetic acid) and B (acetonitrile with 0.1% trifluoroacetic acid) were used for elution of constituents. The column was equilibrated in 85% A / 15% B prior to injection of sample and upon injection this composition was then changed to 60% A / 40% B over 30 min utilizing a linear gradient followed by changing to 50% A / 50% B over the next 10 min and then the concentration was returned to 85% A / 15% B over the final 10 min. The flow rate was set to 1 ml/min, injection volume was 10 μL and column temperature was maintained at 30°C. The system was run for 60 minutes. The eluents were monitored at 255 and 350 nm. Further the characteristic A & B band wavelengths in U.V region were recorded, to identify the nature of flavonoids as per the method described by Bohm and Tsimogiannis et al.99. Bohm B. Extraction, Purification and Identification of Flavonoids. Introduction to Flavonoids. Amsterdam, The Netherlands: Harwood Academic Publishers. 1998. p. 200-4.,6363. Tsimogiannis D, Samiotaki M, Panayotou G, Oreopoulou V. Characterization of Flavonoid Subgroups and Hydroxy Substitution by HPLC-MS/MS. Molecules. 2007;12:593-606.. The peak numbers, retention times, area, percentage area, A & B bands in U.V region were recorded.
• Liquid Chromatography-Mass Spectral (LC-MS) analysis
LC-MS analysis was also carried out at analytical development laboratory, Mylan Laboratories Limited, Bolarum, Hyderabad. The liquid chromatographic analysis of TCLME was performed by gradient system using Waters 2996 PDA HPLC system with Luna C18 - (250 X 4.5 mm, 5 μm) column. Two solvents, A (water with 0.1% trifluoroacetic acid) and B (acetonitrile with 0.1% trifluoroacetic acid) were used for elution of constituents. The column was equilibrated in 85% A / 15% B prior to injection of sample and upon injection this composition was then changed to 75% A / 25% B from 0-22 min. With linear gradient change 85% A / 15% B from 22-35 min. The flow rate was set to 1 mL/min and column temperature was maintained at 30°C. The injection volume was 10 μL. The system was run for 35 minutes and the eluents were monitored at 254 nm, 300 nm and 366 nm. The mass spectral analysis was done by Electro Spray Ionization using a coupled Agilent Ion-Trap Mass Spectrometer in both positive and negative models in the scan range of 100-2000 m/z.
• Evaluation of anti-ulcer activity by in-vivo assays
Aspirin induced ulcerogenesis in pylorus ligated rats. Aspirin induced ulcerogenesis in pylorus ligated rats model was used for the evaluation of anti-ulcer activity with slight modification. The animals were divided into five groups (n=6). Group I - served as negative control and received only vehicle. Groups II, III & IV received TCLME at 125, 250 and 500 mg/kg respectively per oral at the volume of 10 ml/kg. Group - V served as standard and was treated with standard drug (Ranitidine 50 mg/kg)1919. Goel RK, Chakrabarti A, Sanyal AK. The effect of biological variables on the anti-ulcerogenic effect of vegetable plantain banana. Planta Med. 1985;2:85-8.. Aspirin suspended in 1% CMC in water was administered orally at a dose of 500 mg/kg in 12 hours fasted rats2424. Kannappan N, Jaikumar S, Manavalan R, Kottai Muthu A. Anti-ulcer activity of methanolic extract of Jatropha curcas (Linn.) on Aspirin-induced gastric lesions in Wistar rats. Pharmacologyonline. 2008;1:279-93.. The test extract and standard drug treatment was done 30 min prior the administration of Aspirin. After 30 min, the pyloric ligation surgery was performed as per Shay et al.6060. Shay H, Komarov SA, Fels SS, Meranze D, Gruenstein M, Siplet H. A simple method for the uniform production of gastric ulceration in the rat. Gastroenterology. 1945;5:43-61.. Four hours later, the animals were sacrificed by euthanasia.
• Collection and Measurement of Gastric Juice (GJ)
The stomachs were excised carefully keeping the esophagus closed. The stomachs were opened along the greater curvature, removing the luminal contents. The gastric contents were collected and centrifuged at 1000 rpm for 10 minutes. After centrifugation samples were decanted and the volume of gastric juice was noted and is expressed as mL/100 g body weight. The contents were subjected to analysis for free and total acidities.
• Determination of gastric juice pH (pH)
One mL of supernatant liquid was diluted to 10 mL with distilled water. The pH of the solution was recorded with the help of digital pH meter.
• Estimation of Free and Total Acidities (FA & TA)
The above solution was titrated against 0.01 N NaOH using Topfer’s reagent as indicator. The end point of the titration was when the solution turns orange in colour. The volume of NaOH was noted which corresponds to the free acidity. Further the titration was continued till the solution regained pink colour. The total volume of NaOH was noted, which corresponds to total acidity.
• Determination of Ulcer Index (UI)
Mean ulcer score for each animal is expressed as Ulcer Index. The stomachs were washed with running water to see the ulcers in the glandular portion of the stomach. The number of ulcers per stomach were noted and the severity of the ulcers was scored microscopically with the help of hand lens (10x) and scoring was done as per Kulkarni3333. Kulkarni SK. Handbook of Experimental Pharmacology. 3rd ed., New Delhi: Vallabh Prakashan. 1999. p. 148-50.. The scoring was based on the following observations and assigned values: 0=Normal Stomach; 0.5=Red Colouration 1=Spot Ulcers; 1.5=Haemorraghic Streaks 2=Ulcers >3 mm but <5 mm; 3=Ulcers >5 mm.
• Determination of Gastric Mucin Content (GMC)
Mucin content was estimated by the method described by Corne et al.1616. Corne SJ, Morrissey SM, Woods RJ. A method for the quantitative estimation of gastric barrier mucus. J Physiol. 1974;242:116-7. with some modifications. The glandular segments of the stomachs of rats subjected to the ethanol induced ulcers model were isolated and weighed. Each glandular segment was immediately immersed in 10 mL of 0.1% alcian blue solution (0.16 M sucrose/0.05 M sodium acetate, pH 5.8). After immersion for 2 h, excess dye was removed by two successive rinses with 10 mL of 0.25 M sucrose, first for 15 min and then for 45 min. The stomachs were all sequentially transferred to a 0.5 M magnesium chloride and shaken for 2 h. Four mL of the blue extract was then shaken vigorously with an equal volume of ether. The resulting emulsion was centrifuged at 3600 g-force and the absorbance of the aqueous layer was read at 580 nm. The amount of alcian blue extracted per gram of wet glandular tissue was then calculated.
• Estimation of Catalase (CAT)
Catalase activity in stomach tissue was determined according to the method of Leyck and Parnham3636. Leyck S, Parnham MJ. Acute anti inflammatory and gastric effects of the seleno-organic compound ebselen. Agents Actions. 1990;30:426-31.. The stomach tissue was scraped and homogenized in ice cold saline medium with the help of a homogenizer. The solution was centrifuged for 10 minutes at 3000 g-force and collected for the experiment. 100 L of the supernatant was added to a solution of 3 L of H2O2, phosphate buffer mixture (50 mM phosphate buffer, pH 7.0, and 30% H2O2). The change in optical density at 240 nm per unit time was measured.
• Estimation of Superoxide Dismutase (SOD)
Superoxide dismutase activity in stomach tissue was determined according to the method of Fridovich1818. Fridovich I. Superoxide radical and superoxide dismutases. Annu Rev Biochem. 1995;64:97-112.. The stomach tissue was scrapped and homogenized in ice cold normal saline medium with the help of a homogenizer. Then, the tissue homogenate was centrifuged for 10 minutes at 3000 g force and the supernatant was collected and used for the estimation of SOD activity. 10 mL of the solution was taken in a test tube and mixed with 0.5 mL of 50 mM phosphate buffer (pH 7.8), 0.1 mM of EDTA, 0.05 mM xanthine, and 0.01 mM cytochrome c, and then, 100 mL of 2.5 mM of xanthine oxidase was added to start the reaction, and the absorbance was measured at 550 nm.
• Determination of Malondialdehyde (MDA)
Malondialdehyde, formed from the breakdown of polyunsaturated fatty acids, serves as a convenient index for determining the extent of peroxidation reaction. Malondialdehyde has been identified as the product of lipid peroxidation that reacts with thiobarbituric acid to give a red colour absorbing light maximally at 535 nm. One g of tissue sample with 10 mL of 0.2 M Tris HCl buffer (pH 7.2) was taken in a tissue homogenizer to get a 10% homogenate. 500 μL of supernatant from the homogenate, 1 mL of 10% trichloroacetic acid and 1 mL of 0.67% thiobarbituric acid were taken in a tightly stoppered tube. The tube was heated to boiling temperature for 45 min. After cooling the tube, the contents were centrifuged. The supernatant was read at 532 nm against blank. The concentration of test samples was obtained using molar extinction coefficient of MDA. The amount of MDA is expressed as number of moles of MDA / mg of tissue6464. Utley HG, Bernheim F, Hochstein P. Effect of sulfhydryl reagents on peroxidation in microsomes. Arch Biochem Biophys. 1967;118:29-32..
• Estimation of Total Protein content (TP)
Total protein content was estimated by the method of Lowry et al.3939. Lowry OH, Rosebrough NJ, Farr AL, Randall RJ. Protein measurement with the Folin phenol reagent. J Biol Chem. 1951;193:265-75.. The dissolved proteins in gastric juice were estimated in the alcoholic precipitate obtained by adding 90% alcohol with gastric juice in a 9:1 ratio, respectively. Then, 0.1 mL of alcoholic precipitate of gastric juice was dissolved in 1 mL of 0.1 N NaOH. From this, 0.05 mL was taken in another test tube and 4mL of alkaline mixture was added and allowed to stand. After 10 min, 0.4 mL of phenol reagent was added and again allowed to stand for 10 min for the development of colour. Reading was taken against a blank prepared with distilled water at 610 nm. The protein content was calculated from the standard curve prepared with bovine albumin and has been expressed in terms of µg/ mL of gastric juice.
• Acute Ethanol induced gastric lesions
All the animals (n=6) in each group were fasted for 36 hours before the administration of ethanol. The standard drug (Misoprostol 100 g/kg, p.o.) or the test extract was administered one hour before ethanol administration. Ethanol (90%) was administered to all animals at a dose of 1 mL/200 gm. After one hour all animals were sacrificed, and stomachs were isolated as per Salim et al.5757. Salim AS. Removing oxygen-derived free radicals stimulates healing of ethanol-induced erosive gastritis in the rat. Digestion 1990; 47:24-8.. Lesion severity was determined by measuring ulcer index.
Histopathological Studies
The isolated stomachs were preserved in 15% formalin solution and were sent to the pathologist for histopathological examination by staining with haematoxylin and eosin. The morphological changes were observed and recorded with 100x lenses11. Ahmed N, Khan MSA, Mat Jais AM, Mohtarrudin N, Ranjbar M, Amjad MS, et al. Anti-ulcer activity of sandalwood (Santalum album L.) stem hydroalcoholic extract in three gastric-ulceration models of Wistar rats. Bol Latinoam Caribe Plant Med Aromat. 2013;12:81-91..
Statistical analysis
Data obtained was analyzed by One way ANOVA followed by Dunnett’s multiple comparisons post-hoc test using Graphpad Prism version 5.0, 32 bit for windows, Graphpad software, San Diego, California, USA (http://www.graphpad.com/). The values are expressed as Mean ± standard error of mean (SEM). <0.05 was considered statistically significant.
RESULTS AND DISCUSSION
Results of extraction and acute toxicity testing
The dried mass of crude Terminalia coriacea leaves methanolic extract (TCLME) was found to be 24.54% w/w with respect to the powdered leaves. There were no mortalities or signs of toxicity up to the dose of 20,000 mg/kg, p.o, therefore further dosing was discontinued.
Results of Analytical Profile of TCLME
• Confirmatory chemical tests for flavonoids
All the chemicals tests confirmed the presence of flavonoids.
• Results of HPLC-UV analysis
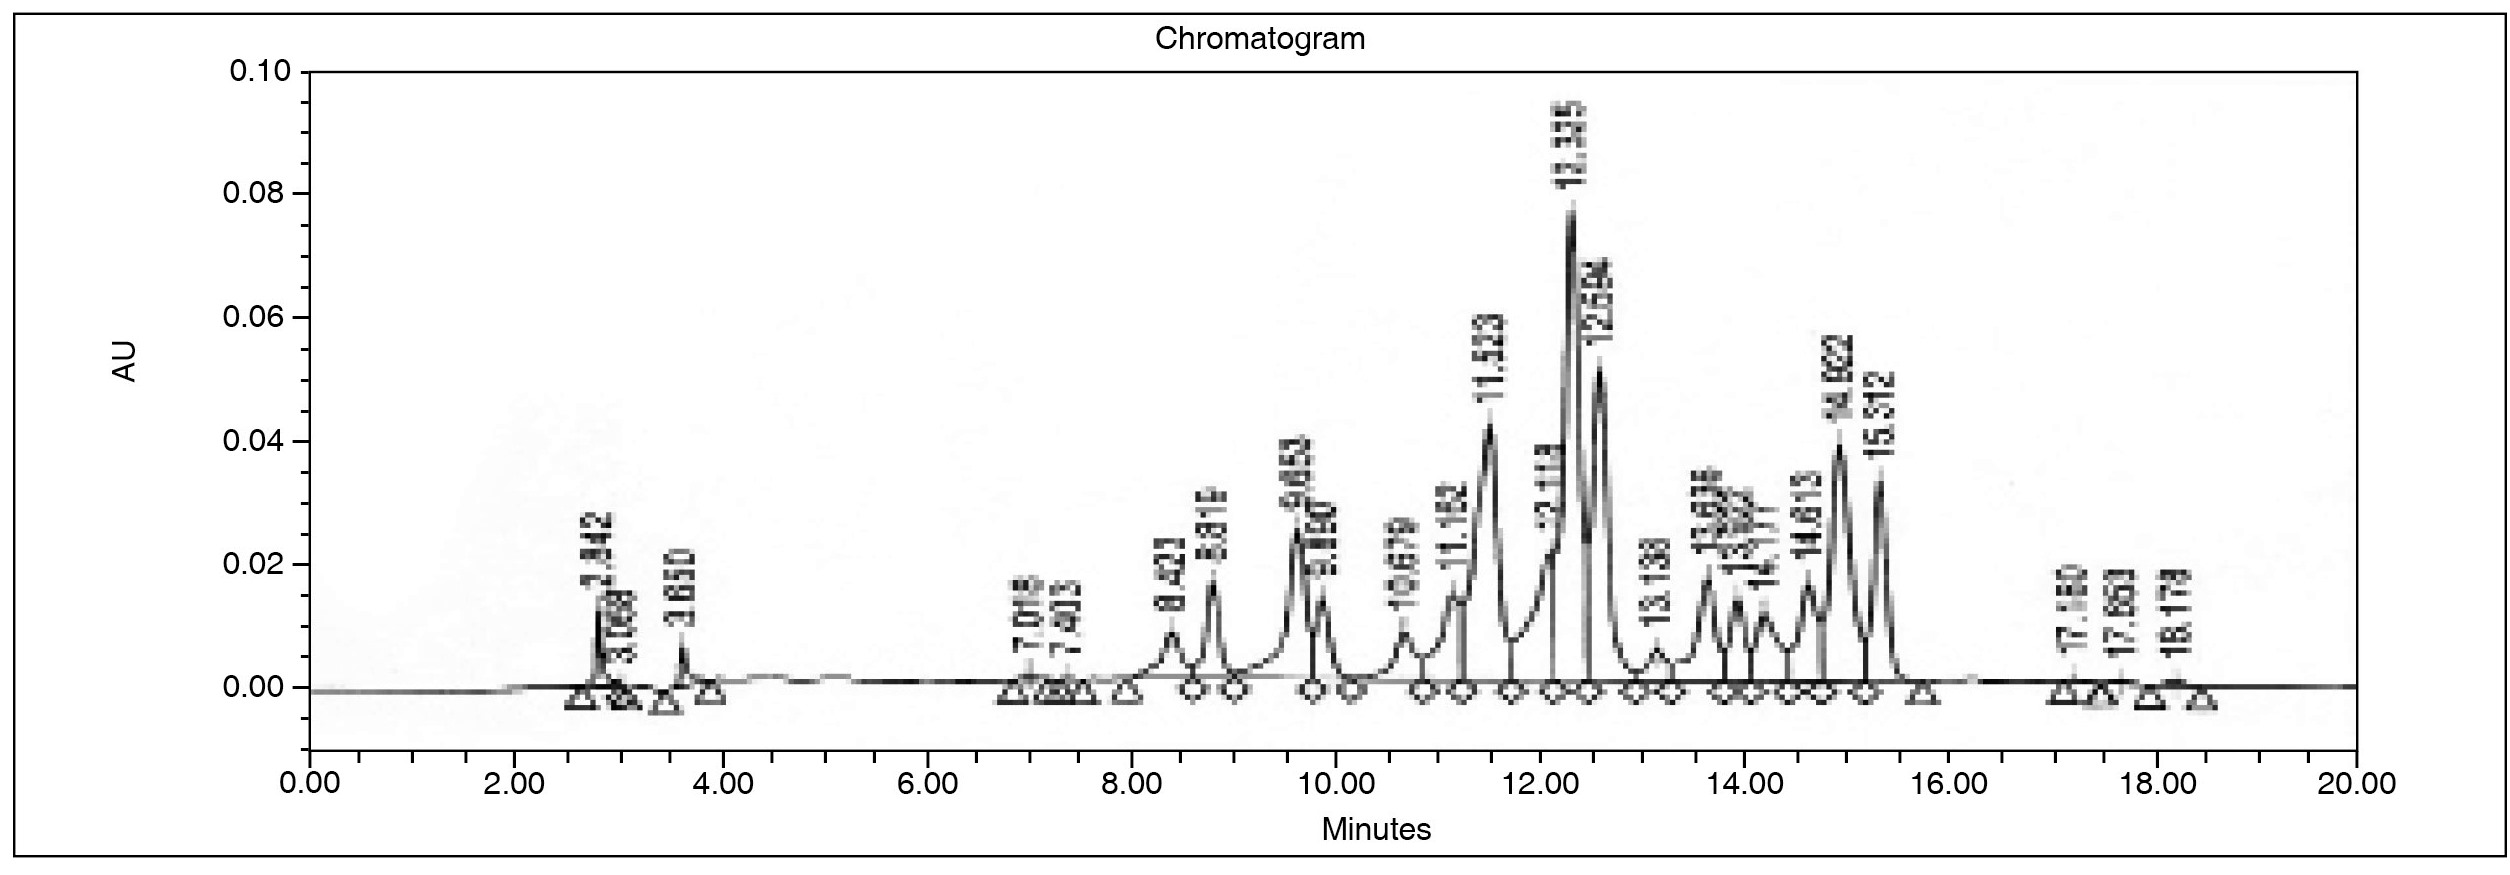
On HPLC analysis of TCLME, 25 peaks were recorded. Peaks 8, 12, 13, 14, 15, 17, 21, and 22 had noteworthy area and percentage area. The peak numbers and their respective retention times are shown in Table 1 and Figure 1. Further, the UV spectrum plot indicates, that peaks 8-15 gave characteristic band A & B wavelengths demonstrating flavonoidal nature of compounds. The six peaks 8-10 and 13-15 gave typical band A & B wavelengths of flavonols while peaks 11 and 12 were confirmed as flavones. The HPLC-UV spectrum plot results are summarized in Table 1.

• Results of LC-MS analysis
The LC-MS analysis of crude TCLME lead to the identification of seven flavonoids by the recorded m/z values of molecular ions and their fragment ions via reported fragmentation patterns. The compounds could mostly be Rutin (Quercetin-3-O-rutinoside), Luteolin-7-O-glucoside, Myricetin hexoside, Apigenin-6-C-glucoside, Quercetin-3-O-glucoside, Isorhamnetin-3-O-rhamnosylglucoside, and Isorhamnetin-3-O-glucoside. An intense peak with m/z 633.1 was recorded between 7.7-7.9 min in positive mode ESI-MS. Rutin is reported to be characterized by the presence of sodium adduct (m/z 633). The molecular ion [MH]+ with m/z 611 is almost absent and presence of aglycone residue [aglycone+H]+ of m/z 302 is rare indicating hindrance in the removal of glucose5050. Pietta P, Gardana C, Pietta A. Flavonoids in herbs. In Flavonoids in Health and Disease. 2nd ed., A Catherine, Rice Evans, Lester Packer (eds). Taylor and Francis CRC Press. 2003. p. 43-50.. Therefore, the observed peak could be due to Rutin. The retention time 8.1-8.4 min showed molecular ion peaks m/z 449.2 [M+H]+ and 447.0 [M-H]- in both ESI positive and negative modes respectively and the various reported fragments - 413.2, 329.1, and 299.1 of Luteolin-7-O-glucoside in ESI positive mode as described by Colombo et al.1515. Colombo R, Yariwake JH, Queiroz EF, Ndjoko K, Hostettmann K. On-line identification of minor flavones from sugarcane juice by LC/UV/MS and post-column derivatization. J Braz Chem Soc. 2009; 20:1574-9.. The retention time 8.9-9.2 min revealed molecular ion m/z of Myricetin hexoside 479.0 [M-H]- & 316 [Aglycone-H]-. The recorded m/z values were in conformance with the plant metabolomics standards of Institute of Food Research, Norwich Research Park, UK5252. Plant Metabolomics Standard MS Data. Institute of Food Research. Norwich Research Park, UK. [Internet]. [retrieved on 2014 February 01]. Available from: http://www.ifr.ac.uk/metabolomics/default.html
http://www.ifr.ac.uk/metabolomics/defaul...
.
During the retention time 10.6-10.8 min, in the positive and negative mode ESI-MS, molecular ion m/z of 433.2 [M+H]+, 431.1 [M-H]- and the standard fragments 397.2, 367.1, 313.2 were observed in + ESI-MS. These facts establish identity of compound as Apigenin-6-C-glucoside as mentioned by Correia et al.1717. Correia H, Gonzalez-Paramas A, Amaral MT, Santos-Buelga C, Batista MT. Polyphenolic profile characterization of Agrimonia eupatoria L. by HPLC with different detection devices. Biomed Chromatogr. 2006;20:88-94.. The same report evidenced the character of next compound as Quercetin-3-O-glucoside that appeared between the retention time 11.1-11.3 min. The observed sodium adduct, molecular ion, and aglycone fragments in +ESI-MS m/z were at 487.1 [M+Na]+, 465.1 [M+H]+, 303.1 [Aglycone+H]+ while deprotonated dimer, glycoside, and aglycone were recorded in -ESI-MS as 927.1 [Dimer-H]-, 463.1 [M-H]-, 301 [Aglycone-H]-. The molecular ions and fragments of Isorhamnetin-3-O-rhamnosylglucoside 663.2 [M+K]+, 647.2 [M+Na]+, 625.2 [M+H]+, and 623.1 [M-H]- and Isorhamnetin-3-O-glucoside 501.1 [M+Na]+, 479.1 [M+H]+, 317.1 [Aglycone+H]+ & 477.1 [M-H]- were observed between 12.5-12.8 and 13.8-14.1 min respectively. The identity of former was established by the plant metabolomics standard MS data by IFR, UK and later compound was recognized with the reports of Makris and Kefalas; Scheiber et al.4040. Makris DP, Kefalas P. Characterization of polyphenolic phytochemicals in red grape pomace. Int J Waste Resources. 2013;3:126.,5959. Schieber A, Keller P, Streker P, Klaiber I, Carle R. Detection of Isorhamnetin glycosides in extracts of apples (Malus domestica cv. “Brettacher”) by HPLC-PDA and HPLC-APCI-MS/MS. Phytochem Anal. 2002; 12:87-94.. Beside these compounds, the spectra also revealed presence of Kaempferol and its fragments. The observed characteristic m/z values and corresponding fragments were 121 [0, 2 B+ ring fragment], 133 [1,3B+ ring fragment], 213 [M+H-H2O-2CO]+, 231 [M+H-2CO]+, 259 [M+H-CO]+, 287 [M+H]+, and 309 [M+Na]+ (data not shown) Tsimogiannis et al.6363. Tsimogiannis D, Samiotaki M, Panayotou G, Oreopoulou V. Characterization of Flavonoid Subgroups and Hydroxy Substitution by HPLC-MS/MS. Molecules. 2007;12:593-606.. The LC-MS analysis results are summarized in the Table 2.
Identification of flavonoids present in Terminalia coriacea leaf methanolic extract by LC-MS analysis
• Results of Aspirin induced ulcerogenesis in pylorus ligated rats model
The results are shown in Table 3.
• Effect of TCLME on Volume of gastric juice
TCLME 250 & 500 mg/kg and standard drug exhibited potent anti-secretory effect. All the above treatments decreased the volume of gastric juice by P<0.001 while the decrease with TCLME 150 mg/kg was found to be P<0.01.
• Effect of TCLME on pH of gastric juice
Ranitidine elevated the pH of gastric juice with P<0.001 while all the doses of test extract raised pH with P<0.05.
• Effect of TCLME on free and total acidities
Ranitidine 50 mg/kg reduced the free and total acidity with P<0.001 and P<0.01 respectively. TCLME 500 mg/kg was the only dose that reduced both free and total acidities (P<0.01 and P<0.05 respectively). TCLME 125 mg/kg did not show any significant reduction in free and total acidities whereas TCLME 250 mg/kg reduced only free acidity by P<0.01.
• Effect of TCLME on ulcer index
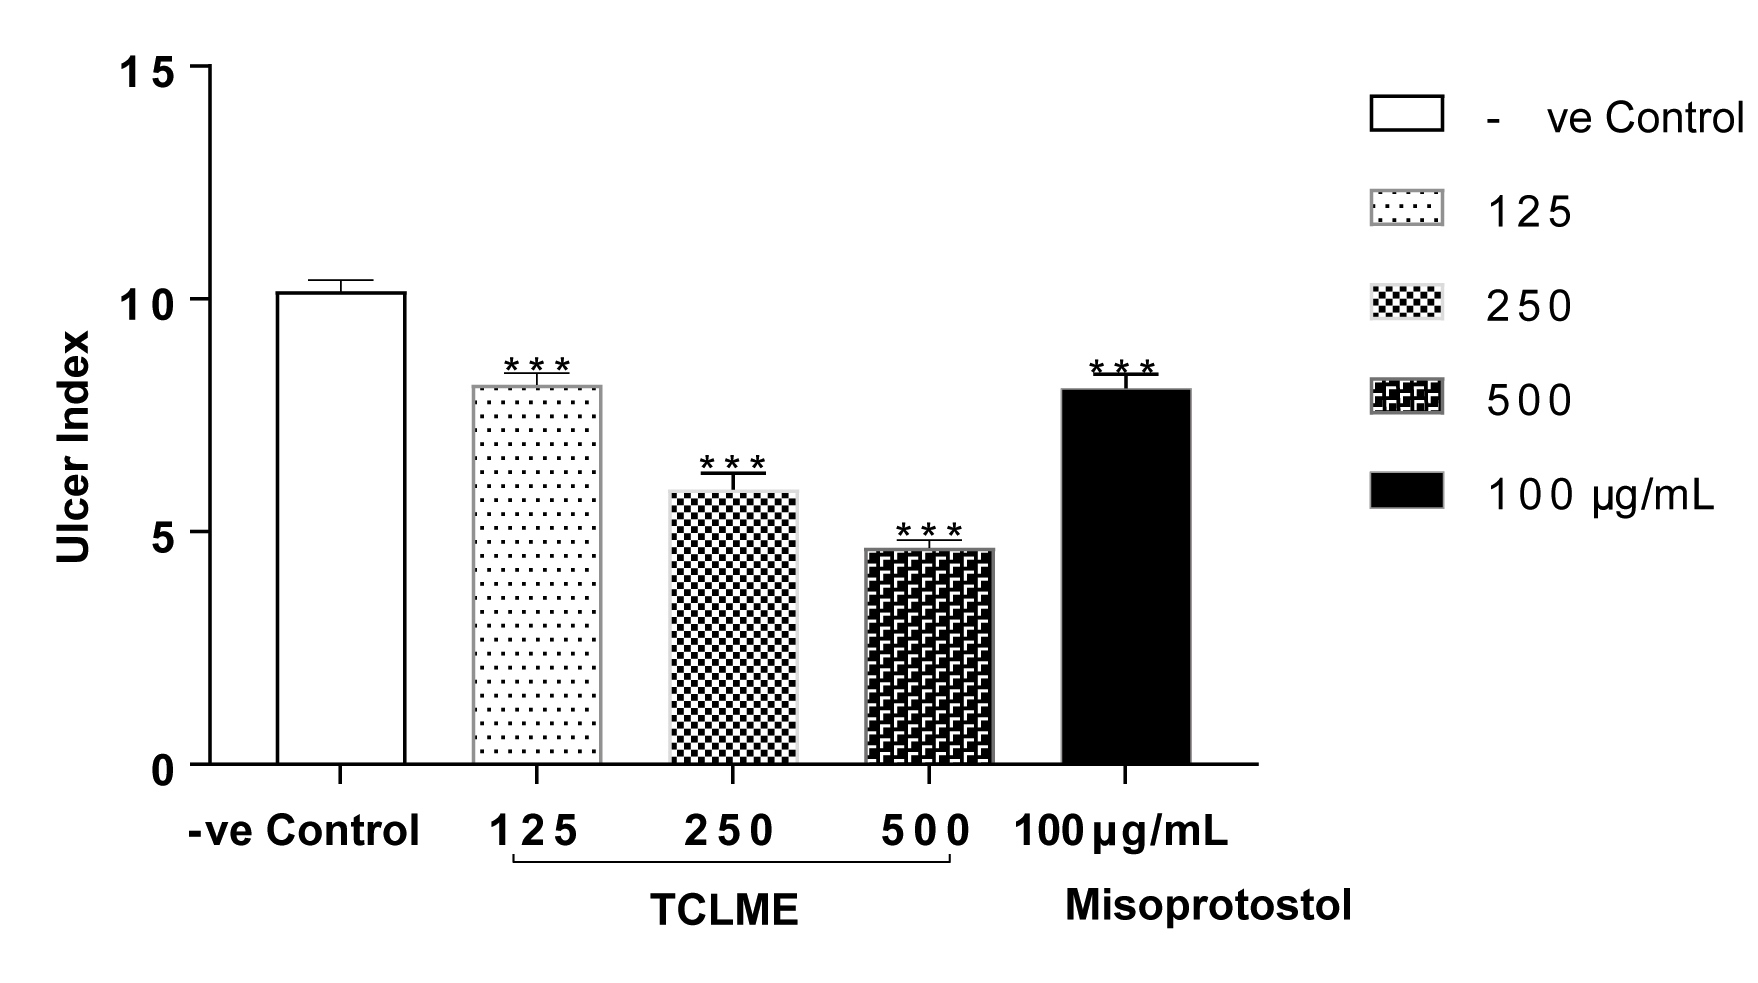
All the doses of test extract and the standard drug displayed strong anti-ulcer effect as all the treatments lead to decrease in ulcer index by P<0.001 when compared to the negative control (as shown in Figure 2).

• Effect of TCLME on gastric mucin content
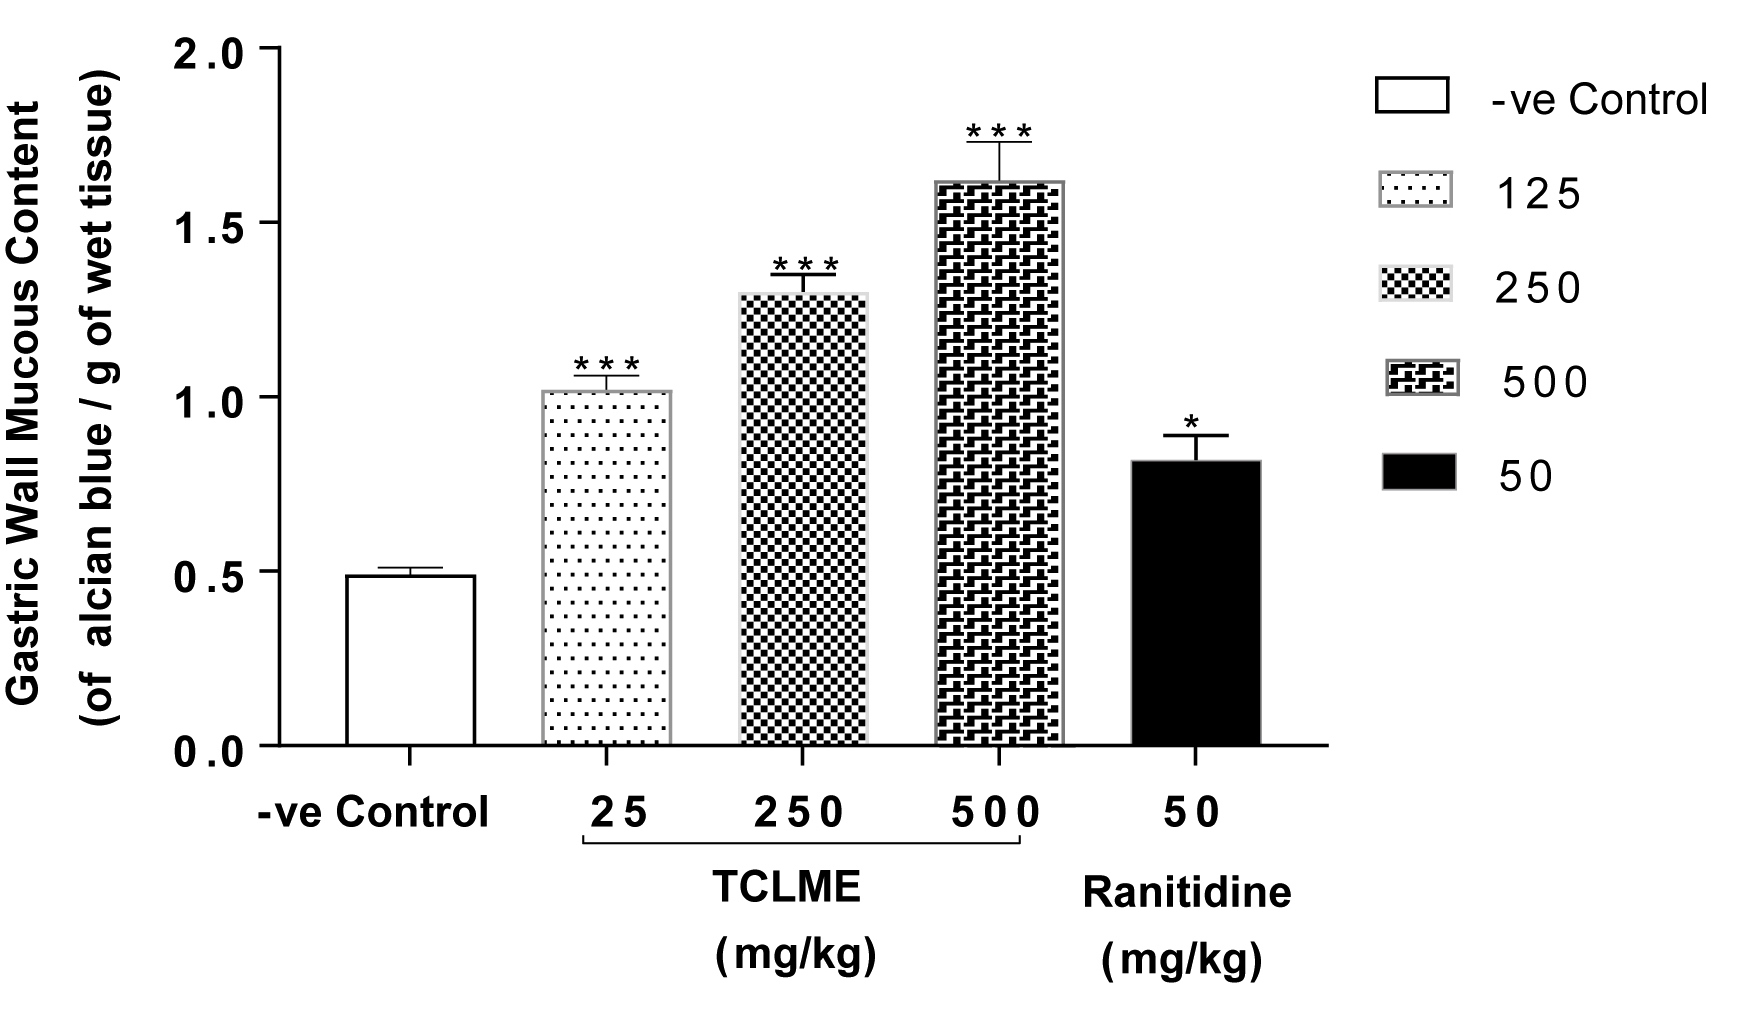
TCLME 125-500 mg/kg enhanced the production of gastric Mucin with P<0.001. Though Ranitidine showed a significant effect (P<0.05) but it not as effective as the test extracts (as shown in Figure 3).

Gastric wall mucous content in Aspirin induced ulcerogenesis in pylorus ligated rats model.

• Effect of TCLME on Total Protein (TP)
Although significant inhibition but of varying levels (P<0.01 - P<0.001) was seen with the treatment of TCLME on depletion of proteins from gastric tissue. In all the test extract treated groups the effect was better than the standard that showed P<0.05 (as shown in Table 3).
• Effect of TCLME on Malondialdehyde (MDA)
All the test extracts demonstrated greater degree of inhibition on lipid peroxidation ( P<0.001) while the standard suppressed level of MDA by P<0.01 (as shown in Table 3).
• Effect of TCLME on Catalase (CAT)
Ranitidine 50 mg/kg and TCLME 500 mg/kg increased the levels of Catalase with P<0.001 whereas TCLME 125 & 250 mg/ kg improved the levels by P<0.01 (as shown in Table 3).
• Effect of TCLME on Superoxide dismutase (SOD)
Ranitidine and the higher test dose (250 & 500 mg/kg) of TCLME upgraded the level of Superoxide dismutase by P<0.001. TCLME 125 mg/kg promoted SOD with P<0.01 (as shown in Table 3).
Results of Acute ethanol induced gastric lesions model
• Effect of TCLME on Ulcer Index of acute ethanol induced gastric lesions
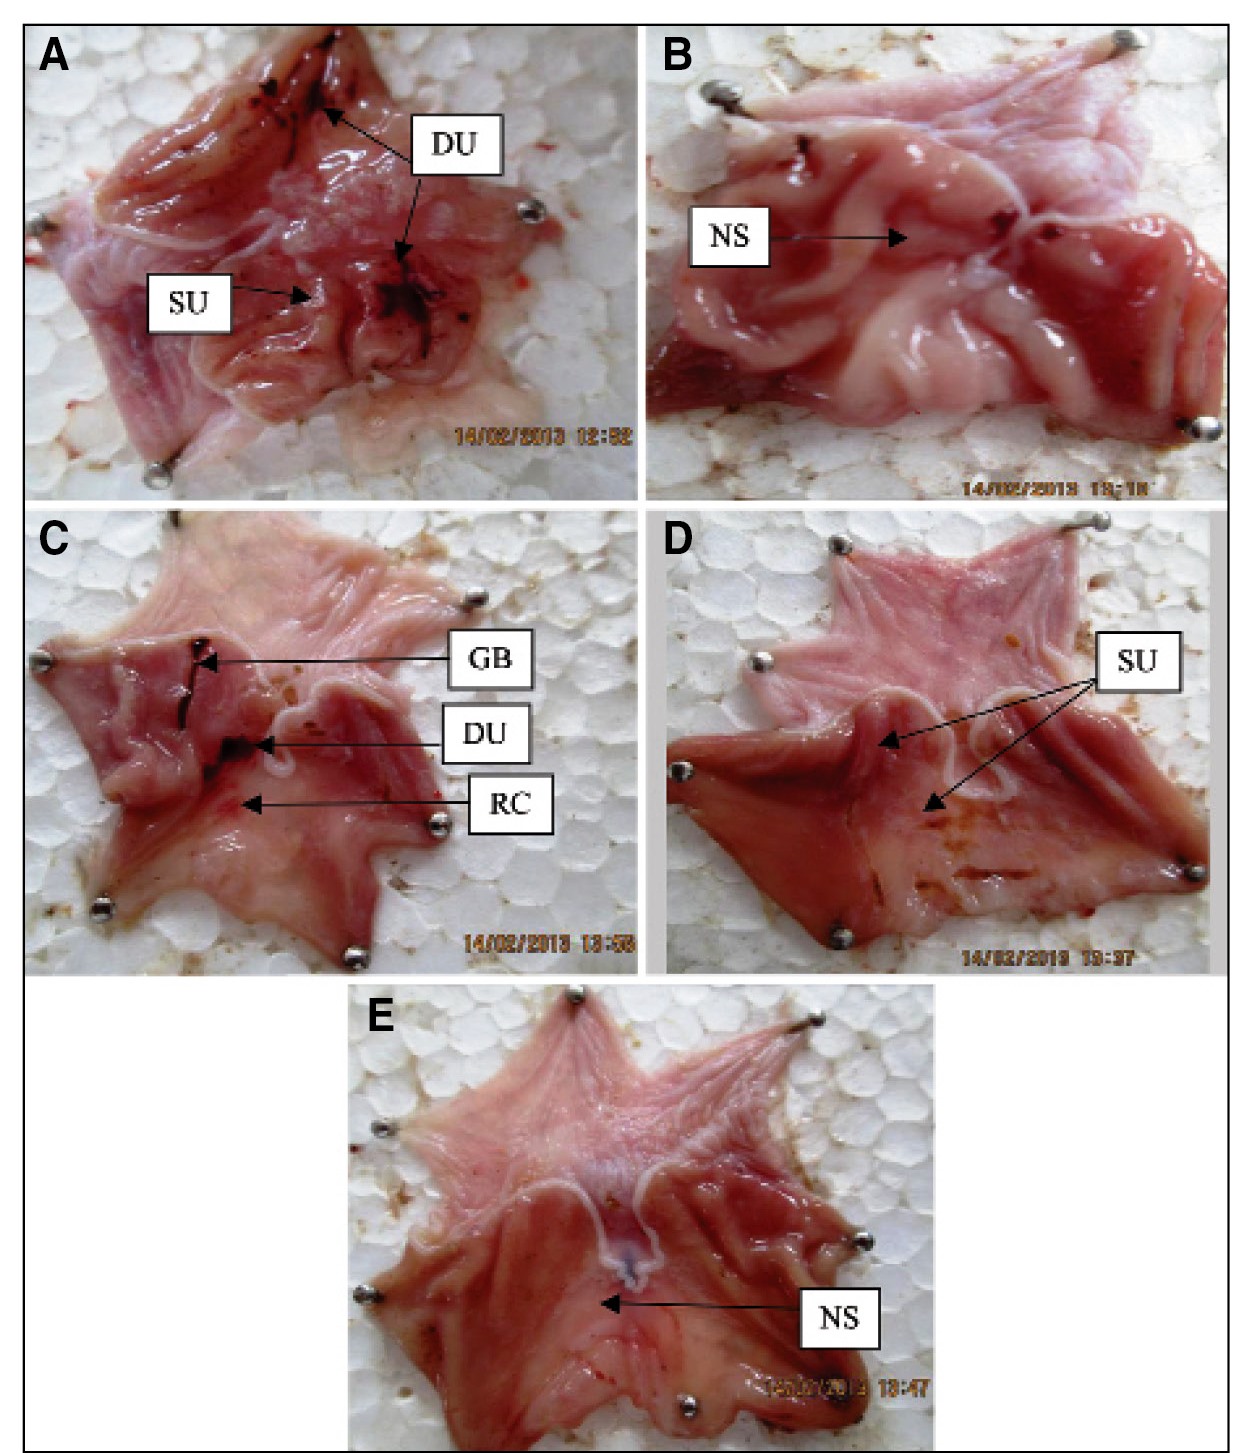
The gastroprotective action of TCLME was also evident in ethanol induced gastric lesions model. TCLME at all the test doses diminished the ulcer index like standard with P<0.001 vs. Control Table 4 and Figure 4. The macroscopic images of stomachs of rats subjected to this model are shown in Figure 5.

Photographs of stomachs subjected to Ethanol induced gastric ulcers. (A) Negative Control; (B) Standard (Misoprostol 100 g/kg); (C) Test-I (TCLME 125 mg/kg); (D) Test-II (TCLME 250 mg/kg) and (E) Test-III (TCLME 500 mg/kg). Where DU - Deep Ulcer, GB - Gastric Bleeding, NS - Normal Stomach, RC - Red Coloration, SU - Spot Ulcer and TCLME - Terminalia coriacea leaf methanolic extract.
• Effect of TCLME on histology of gastric tissues
(A) Negative Control. The stomachs of negative control group showed degenerated epithelial cells, severe haemorrhage, necrosis, vascular congestion and marked inflammatory infiltration.
(B) Standard Misoprostol (100 μg/kg). Grossly, the mucosa of standard group showed intact epithelial lining. The sub-mucosa was found to be mostly normal, however mild haemorrhage was seen in few stomachs.
(C) TCLME (125 mg/kg). The stomachs of rats treated with TCLME 125 mg/kg revealed moderate haemorrhage, mild oedema, and few scattered inflammatory cells.
(D) TCLME (250 mg/kg). Mild inflammatory infiltration and congestion of vascular spaces was noticed in stomachs of group that received TCLME 250 mg/kg.
(E) TCLME (500 mg/kg). The treatment of TCLME 500 mg/ kg prevented gastric ulceration. On examination the stomachs were found to be normal with intact epithelial lining and no signs of injury. Histopathological slides of rat’s stomachs are shown in Figure 6.
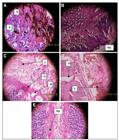
Histopathological slides of rat’s stomachs subjected to Ethanol induced gastric ulcers. (A) Negative Control; (B) Standard (Misoprostol 100 g/kg); (C) Test-I (TCLME 125 mg/kg); (D) Test-II (TCLME 250 mg/kg) and (E) Test-III (TCLME 500 mg/kg) where I - Inflammatory infiltration, N - Necrosis, NS - Normal Stomach, O - Oedema and TCLME - Terminalia coriacea leaf methanolic extract.
All these flavonoids are reported in the allied species. Quercetin-3-O-glucoside was isolated from aerial parts of T. muelleri5555. Rashed K, Luo MT, Zhang LT, Zheng YT. Inhibition of human immunodeficiency virus (HIV-1) by Terminalia muelleri extracts and bioactive constituents. Pharmanest 2013;4:1069-80. while Quercetin-3-O-rutinoside (Rutin) is reported in T. catappa3838. Lin YL, Kuo YH, Shiao MS, Chen CC, Ou JC. Flavonoid Glycosides from Terminalia catappa L. J Chin Chem Soc. 2000;47:253-6.,4444. Mohale DS, Dewani AP, Chandewar AV, Khadse CD, Tripathi AS, Agrawal SS. Brief review on medicinal potential of Terminalia catappa. Journal of Herbal Medicine and Toxicology. 2009;3:7-11.. Luteolin-7-O-glucoside (Cynaroside) is reported to be present in T. arjuna4949. Pettit GR, Hoard MS, Doubek DL, Schmidt JM, Pettit RK, Tackett LP, Chapuis JC. Antineoplastic agents 338. The cancer cell growth inhibitory constituents of Terminalia arjuna (Combretaceae). J Ethnopharmacol . 1996;53:57-63.. Isorhamnetin glycosides was isolated from T. chebula leaves whereas Apigenin-6-C-glucoside (Isovitexin), Kaempferol and Quercetin glycosides are reported in T. arjuna, T. catappa22. Anonymous. Terminalia arjuna. Altern Med Rev. 1999;4:436-437.,3838. Lin YL, Kuo YH, Shiao MS, Chen CC, Ou JC. Flavonoid Glycosides from Terminalia catappa L. J Chin Chem Soc. 2000;47:253-6.,4444. Mohale DS, Dewani AP, Chandewar AV, Khadse CD, Tripathi AS, Agrawal SS. Brief review on medicinal potential of Terminalia catappa. Journal of Herbal Medicine and Toxicology. 2009;3:7-11.. Myricetin hexoside is present in T. ferdinandiana4545. Mohanty S, Cock IE. The chemotherapeutic potential of Terminalia ferdinandiana: Phytochemistry and bioactivity. Phcog Rev. 2012;6:29-36.. Flavonoids are being extensively studied for their beneficial effects on human health and literature reveals that they produce no or very little toxicity2121. Havsteen BH. The biochemistry and medical significance of the flavonoids. Pharmacol Ther. 2002;96:67-202.,4141. Manach C, Morand C, Demigne C, Texier O, Regerat F, Rémésy C. Bioavailability of rutin and quercetin in rats. FEBS Lett. 1997;409:12-6.. Moreover, they are considered to be responsible for the therapeutic effects of many traditional herbs. The gastroprotective role of flavonoids is well documented4747. Parmar NS, Parmar S. Anti-ulcer potential of flavonoids. Indian J Physiol Pharmacol. 1998;42:343-51.,5858. Sandhar HK, Kumar B, Prasher S, Tiwari P, Salhan M, Sharma P. A review of phytochemistry and pharmacology of flavonoids. Internationale Pharmaceutica Sciencia. 2011;1:25-41.,6262. Sumbul S, Ahmad MA, Asif M, Akhtar M. Role of phenolic compounds in peptic ulcer: An overview. J Pharm Bioall Sci. 2011; 3:361-67.,6565. Zayachkivska OS, Konturek SJ, Drozdowicz D, Konturek PC, Brzozowski T, Ghegotsky MR. Gastroprotective effects of flavonoids in plant extracts. J Physiol Pharmacol. 2005;56:219-31.. More than 95 flavonoids have been studied for their effectiveness in PUD. About 42 flavonoids were found to be inactive. The inactivity varies broadly with the experimental model, animal used in the study, route of administration and dose4646. Mota KSDL, Dias GEN, Pinto MEF, Luiz-Ferreira A, Souza-Brito ARM, Hiruma-Lima CA, Barbosa-Filho JM, Batista LM. Flavonoids with gastroprotective activity. Molecules 2009;14:979-1012.. Flavonoids exhibit anti-secretory1010. Carlo GD, Autore G, Izzo AA, Maiolino P, Mascolo N, Viola P, Diurno MV, Capasso F. Inhibition of intestinal motility and secretion by flavonoids in mice and rats: structure-activity relationships. J Pharm Pharmacol. 1993;45:1054-9., anti-spasmodic3737. Lima JT, Almeida JRGS, Barbosa-Filho JM, Assis TS, Silva MS, Dacunha EVL, Braz-Filho R, Silva BA. Spasmolytic action of diplotropin, a furanoflavan from Diplotropis ferruginea Benth., involves calcium blockade in ginea-pig ileum. Z Naturforsch. 2005;60:1-8., anti-ulcer1212. Casa CL, Villegas I, Lastra CADL, Motilva V, Martin Calero MJ. Evidence for protective and antioxidant properties of rutin, a natural flavone, against ethanol induced gastric lesions. J Ethnopharmacol. 2000;71:45-53., and anti-diarrhoeal1010. Carlo GD, Autore G, Izzo AA, Maiolino P, Mascolo N, Viola P, Diurno MV, Capasso F. Inhibition of intestinal motility and secretion by flavonoids in mice and rats: structure-activity relationships. J Pharm Pharmacol. 1993;45:1054-9. properties. The other actions like anti-inflammatory and anti-platelet effects are the secondary actions or alternative mechanisms that support therapeutic actions of flavonoids on gastrointestinal tract1111. Carotenuto A, Fattorusso E, Lanzotti V, Magno S, Feo VD, Cicala C. The flavonoids of Allium neapolitanum. Phytochemistry 1997;44:949-57.. The biochemical and pharmacological actions of flavonoids are attributed to their strong antioxidant potential3434. Larson RA. The antioxidants of higher plants. Phytochemistry. 1998;27:969-78.. The antioxidant mechanism of action of flavonoids, especially rutin and quercetin, is mainly due to the presence of an O-dihydroxy in the B ring (catechol), and additionally a 2, 3 double bond in conjugation with a 4-oxo function, as well as the presence of hydroxyl groups in positions 3, 5 and 7 in their structures2121. Havsteen BH. The biochemistry and medical significance of the flavonoids. Pharmacol Ther. 2002;96:67-202.,5151. Pietta PG. Flavonoids as antioxidant. J Nat Prod. 2000; 62:1035-42.,5656. Russo A, Acquaviva R, Campisi A, Sorrenti V, Giacomo CD, Virgata G, Barcellona ML, Vanella A. Bioflavonoids as antiradicals, antioxidants and DNA cleavage protectors. Cell Biol Toxicol. 2000; 16:91-8.. These compounds cover a full range of activity from weak to strong. Apigenin is inactive44. Barnaulov OD, Manicheva OA, Shelyuto VL, Konopleva MM, Glyzin VI. Effect of flavonoids on development of experimental gastric dystrophies in mice. Khim Farm Zh. 1985a;18:935-41. while Kaempferol exhibited gastroprotection at doses 50 & 100 mg/kg2222. Izzo AA, Carlo GD, Mascolo N, Capasso F. Antiulcer effect of flavonoids: role of endogenous PAF. Phytother Res. 1994; 8:179-81.. Luteolin-7-O-glucoside (Cynaroside) at 47.4 mg/kg and Myricetin at a dose of 0.05 mL/g were found to be active anti-ulcer compounds in mice and rats on screening with reserpine induced gastric ulcers model44. Barnaulov OD, Manicheva OA, Shelyuto VL, Konopleva MM, Glyzin VI. Effect of flavonoids on development of experimental gastric dystrophies in mice. Khim Farm Zh. 1985a;18:935-41.,66. Barnaulov OD, Manicheva OA, Zapesochnaya GG, Shelyuto VL, Glyzin VI. Effects of certain flavonoids on the ulcerogenic action of reserpine in mice. Khim Farm Zh . 1982;16:300-3.,5353. Rainova L, Nakov N, Bogdanova S, Minkov E, Stoytcheva DS. Ulceroprotective activity of the flavonoids of Genista rumelica Vel. Phytother Res . 1988;2:137-9..
Rutin prevents gastric mucosal ulceration in wide-range of in-vivo models like absolute ethanol, acidified-ethanol, and reserpine induced gastric ulcers33. Barnaulov OD, Manicheva OA, Komissarenko NF. Comparative evaluation of the effect of some flavonoids on changes in the gastric wall of reserpine-treated or immobilized mice. Pharm Chem J. 1983;17:946-51.,1212. Casa CL, Villegas I, Lastra CADL, Motilva V, Martin Calero MJ. Evidence for protective and antioxidant properties of rutin, a natural flavone, against ethanol induced gastric lesions. J Ethnopharmacol. 2000;71:45-53.,2222. Izzo AA, Carlo GD, Mascolo N, Capasso F. Antiulcer effect of flavonoids: role of endogenous PAF. Phytother Res. 1994; 8:179-81.. The cytoprotective effect is mediated by dose dependent inhibition of mucosal platelet-activating factor (PAF) and anti-oxidant mechanism2222. Izzo AA, Carlo GD, Mascolo N, Capasso F. Antiulcer effect of flavonoids: role of endogenous PAF. Phytother Res. 1994; 8:179-81.. In a study, Rutin at a dose of 200 mg/kg, reduced level of lipid peroxides and increased the activity of anti-oxidant enzymes like glutathione peroxidase. The beneficial effects of Rutin do not involve effects on endogenous prostaglandins and non-protein sulfhydryls1212. Casa CL, Villegas I, Lastra CADL, Motilva V, Martin Calero MJ. Evidence for protective and antioxidant properties of rutin, a natural flavone, against ethanol induced gastric lesions. J Ethnopharmacol. 2000;71:45-53.. Quercetin is one of the most studied flavonoids that protects gastrointestinal mucosa from acute lesions induced by various methods like absolute ethanol2323. Kahraman A, Erkasap N, Koken T, Serteser M, Aktepe F, Erkasap S. The antioxidative and antihistaminic properties of quercetin in ethanol-induced gastric lesions. Toxicology 2003;183:133-42.,4242. Martin MJ, Casa CL, Lastra CADL, Cabeza J, Villegas I, Motilva V. Anti-oxidant mechanisms involved in gastroprotective effects of Quercetin. Z Naturforsch C: J Biosci. 1998;53:82-8.,5454. Rao CV, Govindarajan SKOR, Rawat AKS, Mehrotra S, Pushpangadan P. Quercetin, a bioflavonoid, protects against oxidative stress-related gastric mucosal damage in rats. Nat Prod Sci. 2003;9:68-72., acidified-ethanol2222. Izzo AA, Carlo GD, Mascolo N, Capasso F. Antiulcer effect of flavonoids: role of endogenous PAF. Phytother Res. 1994; 8:179-81., aspirin5454. Rao CV, Govindarajan SKOR, Rawat AKS, Mehrotra S, Pushpangadan P. Quercetin, a bioflavonoid, protects against oxidative stress-related gastric mucosal damage in rats. Nat Prod Sci. 2003;9:68-72., indomethacin, pyloric ligation4343. Martin MJ, Motilva V, Lastra CADL. Quercetin and naringenin, effects on ulcer formation and gastric secretion in rats. Phytother Res . 1993;7:150-3., reserpine33. Barnaulov OD, Manicheva OA, Komissarenko NF. Comparative evaluation of the effect of some flavonoids on changes in the gastric wall of reserpine-treated or immobilized mice. Pharm Chem J. 1983;17:946-51.
4. Barnaulov OD, Manicheva OA, Shelyuto VL, Konopleva MM, Glyzin VI. Effect of flavonoids on development of experimental gastric dystrophies in mice. Khim Farm Zh. 1985a;18:935-41.
5. Barnaulov OD, Manicheva OA, Yasinov RK, Yakovlev GP. Evaluation of the effect of flavonoids from the aerial parts of Astragalus quisqualis bunge and A. floccosifolius sumn on the development of experimental lesions in the mouse stomach. Rast Resur. 1985b;21:85-90.-66. Barnaulov OD, Manicheva OA, Zapesochnaya GG, Shelyuto VL, Glyzin VI. Effects of certain flavonoids on the ulcerogenic action of reserpine in mice. Khim Farm Zh . 1982;16:300-3. and restraint stress2222. Izzo AA, Carlo GD, Mascolo N, Capasso F. Antiulcer effect of flavonoids: role of endogenous PAF. Phytother Res. 1994; 8:179-81. induced gastric ulcers. Quercetin (3, 5, 7, 3’, 4’ - pentahydroxy-flavonol) is also one of the compounds that shows diverse mechanisms of action like increase in mucous production4242. Martin MJ, Casa CL, Lastra CADL, Cabeza J, Villegas I, Motilva V. Anti-oxidant mechanisms involved in gastroprotective effects of Quercetin. Z Naturforsch C: J Biosci. 1998;53:82-8., enhancement of mucosal sulfhydryl2323. Kahraman A, Erkasap N, Koken T, Serteser M, Aktepe F, Erkasap S. The antioxidative and antihistaminic properties of quercetin in ethanol-induced gastric lesions. Toxicology 2003;183:133-42. and anti-oxidant mechanism (increase in superoxide dismutase)3535. Lastra CADL, Martin MJ, Motilva V. Antiulcer and gastroprotective effects of quercetin, a gross and histologic study. Pharmacology. 1994;48:56-62., anti-histaminic properties like decrease in histamine level, reduction in number of mast cells, PAF2222. Izzo AA, Carlo GD, Mascolo N, Capasso F. Antiulcer effect of flavonoids: role of endogenous PAF. Phytother Res. 1994; 8:179-81., inhibition of H. pylori growth, lipid peroxidation2323. Kahraman A, Erkasap N, Koken T, Serteser M, Aktepe F, Erkasap S. The antioxidative and antihistaminic properties of quercetin in ethanol-induced gastric lesions. Toxicology 2003;183:133-42.,4242. Martin MJ, Casa CL, Lastra CADL, Cabeza J, Villegas I, Motilva V. Anti-oxidant mechanisms involved in gastroprotective effects of Quercetin. Z Naturforsch C: J Biosci. 1998;53:82-8. and formation of acid by parietal cells77. Beil W, Birkhoiz C, Sewing KF. Effects of flavonoids on parietal cell acid secretion, gastric mucosal prostaglandin production and Helicobacter pylori growth. Arzneim Forsch. 1995;45:697-700..
CONCLUSION
It is concluded that Leathery Murdah, Terminalia coriacea (Roxb.) Wight & Arn. possesses strong dose-dependent gastroprotective action and it can be mainly attributed to the flavonoids present in it. The identified flavonoids Kaempferol, Luteolin, Myricetin, Quercetin and Rutin possess weak to strong anti-ulcer activity. The present study highlights that TCLME exhibits gastroprotective action predominantly due to its anti-secretory, anti-ulcer, and anti-oxidant effects besides prevention of lipid peroxidation and induction of mucous secretion.
ACKNOWLEDGEMENT
The authors wish to acknowledge Botanical Survey of India, Deccan Regional Centre for authentication of the plant material; Mylan Laboratories for providing HPLC, HPLC-UV and LC-MS facility; College of Veterinary Sciences, Acharya N.G Ranga Agriculture University for providing technical support in performing biochemical assays and Central Laboratory, Shadan Institute of Medical Sciences for assisting in histopathology.
REFERENCES
-
1Ahmed N, Khan MSA, Mat Jais AM, Mohtarrudin N, Ranjbar M, Amjad MS, et al. Anti-ulcer activity of sandalwood (Santalum album L.) stem hydroalcoholic extract in three gastric-ulceration models of Wistar rats. Bol Latinoam Caribe Plant Med Aromat. 2013;12:81-91.
-
2Anonymous. Terminalia arjuna Altern Med Rev. 1999;4:436-437.
-
3Barnaulov OD, Manicheva OA, Komissarenko NF. Comparative evaluation of the effect of some flavonoids on changes in the gastric wall of reserpine-treated or immobilized mice. Pharm Chem J. 1983;17:946-51.
-
4Barnaulov OD, Manicheva OA, Shelyuto VL, Konopleva MM, Glyzin VI. Effect of flavonoids on development of experimental gastric dystrophies in mice. Khim Farm Zh. 1985a;18:935-41.
-
5Barnaulov OD, Manicheva OA, Yasinov RK, Yakovlev GP. Evaluation of the effect of flavonoids from the aerial parts of Astragalus quisqualis bunge and A. floccosifolius sumn on the development of experimental lesions in the mouse stomach. Rast Resur. 1985b;21:85-90.
-
6Barnaulov OD, Manicheva OA, Zapesochnaya GG, Shelyuto VL, Glyzin VI. Effects of certain flavonoids on the ulcerogenic action of reserpine in mice. Khim Farm Zh . 1982;16:300-3.
-
7Beil W, Birkhoiz C, Sewing KF. Effects of flavonoids on parietal cell acid secretion, gastric mucosal prostaglandin production and Helicobacter pylori growth. Arzneim Forsch. 1995;45:697-700.
-
8Bhatt CSB, Khan MSA. Preliminary phytochemical screening, acute toxicity studies and anti-pyretic activity of Terminalia coriacea stem bark aqueous extract. Abstract book of 62nd Indian Pharmaceutical Congress (2010). Manipal. pp. 343.
-
9Bohm B. Extraction, Purification and Identification of Flavonoids. Introduction to Flavonoids Amsterdam, The Netherlands: Harwood Academic Publishers. 1998. p. 200-4.
-
10Carlo GD, Autore G, Izzo AA, Maiolino P, Mascolo N, Viola P, Diurno MV, Capasso F. Inhibition of intestinal motility and secretion by flavonoids in mice and rats: structure-activity relationships. J Pharm Pharmacol. 1993;45:1054-9.
-
11Carotenuto A, Fattorusso E, Lanzotti V, Magno S, Feo VD, Cicala C. The flavonoids of Allium neapolitanum Phytochemistry 1997;44:949-57.
-
12Casa CL, Villegas I, Lastra CADL, Motilva V, Martin Calero MJ. Evidence for protective and antioxidant properties of rutin, a natural flavone, against ethanol induced gastric lesions. J Ethnopharmacol. 2000;71:45-53.
-
13Chetty KM, Sivaji K, Rao KT. Flowering plants of Chittoor District. 2nd ed., Andhra Pradesh, India: Students Offset Printers and Publishers, Tirupathi. 2008. p. 125-6.
-
14Chinedu E, Arome D, Ameh FS. A new method for determining acute toxicity in animal models. Toxicol Intl. 2013;20:224-6.
-
15Colombo R, Yariwake JH, Queiroz EF, Ndjoko K, Hostettmann K. On-line identification of minor flavones from sugarcane juice by LC/UV/MS and post-column derivatization. J Braz Chem Soc. 2009; 20:1574-9.
-
16Corne SJ, Morrissey SM, Woods RJ. A method for the quantitative estimation of gastric barrier mucus. J Physiol. 1974;242:116-7.
-
17Correia H, Gonzalez-Paramas A, Amaral MT, Santos-Buelga C, Batista MT. Polyphenolic profile characterization of Agrimonia eupatoria L. by HPLC with different detection devices. Biomed Chromatogr. 2006;20:88-94.
-
18Fridovich I. Superoxide radical and superoxide dismutases. Annu Rev Biochem. 1995;64:97-112.
-
19Goel RK, Chakrabarti A, Sanyal AK. The effect of biological variables on the anti-ulcerogenic effect of vegetable plantain banana. Planta Med. 1985;2:85-8.
-
20Harborne JB. Phytochemical methods 3rd ed., London: Chapman and Hall. 1978. p. 135.
-
21Havsteen BH. The biochemistry and medical significance of the flavonoids. Pharmacol Ther. 2002;96:67-202.
-
22Izzo AA, Carlo GD, Mascolo N, Capasso F. Antiulcer effect of flavonoids: role of endogenous PAF. Phytother Res. 1994; 8:179-81.
-
23Kahraman A, Erkasap N, Koken T, Serteser M, Aktepe F, Erkasap S. The antioxidative and antihistaminic properties of quercetin in ethanol-induced gastric lesions. Toxicology 2003;183:133-42.
-
24Kannappan N, Jaikumar S, Manavalan R, Kottai Muthu A. Anti-ulcer activity of methanolic extract of Jatropha curcas (Linn.) on Aspirin-induced gastric lesions in Wistar rats. Pharmacologyonline. 2008;1:279-93.
-
25Khan MSA, Hasan MW, Shereen M, Sultana T, Dastagir IM, Ali AJ, et al. Anti-nociceptive effect of Terminalia coriacea (Roxb.) Wight & Arn. leaf methanolic extract. Pharmacologyonline . 2011c;7:1176-89.
-
26Khan MSA, Hussain SA, Mat Jais AM, Zakaria ZA, Khan M. Anti-ulcer activity of Ficus religiosa stem bark ethanolic extract in rats. J Med Plants Res. 2011a; 5:354-9.
-
27Khan MSA, Mat Jais AM, Afreen A. Prostaglandin analogous and antioxidant activity mediated gastroprotective action of Tabernaemontana divaricata (L.) R. Br. flower methanolic extract against chemically induced gastric ulcers in rats. Biomed Res Intl. 2013;2013:1-18.
-
28Khan MSA, Mat Jais AM, Khan M, Zakaria ZA, Ranjbar M. Gastroprotective effect of Tabernaemontana divaricata (L). R.Br. flower methanolic extract in rats. Pharmacologyonline . 2011b;2:24-35.
-
29Khan MSA, Mat Jais AM, Zakaria ZA, Mohtarrudin N, Ranjbar M, Khan M, et al. Wound healing potential of Leathery Murdah, Terminalia coriacea {Roxb.} Wight & Arn. Phytopharmacology. 2012; 3:158-68.
-
30Khandelwal KR. Practical Pharmacognosy 12th ed., Pune: Nirali Prakashan. 2004. p. 149-60.
-
31Kirtikar R, Basu BD. Terminalia coriacea In: Indian Medicinal Plants 2nd ed., Allahabad, India: Lolit Mohan Basu Publication. 1935. p. 1028-9.
-
32Kokate CK, Purohit AP, Gokhale SB. Pharmacognosy 39th ed., Pune: Nirali Prakashan . 2007. p. 108-9.
-
33Kulkarni SK. Handbook of Experimental Pharmacology 3rd ed., New Delhi: Vallabh Prakashan. 1999. p. 148-50.
-
34Larson RA. The antioxidants of higher plants. Phytochemistry. 1998;27:969-78.
-
35Lastra CADL, Martin MJ, Motilva V. Antiulcer and gastroprotective effects of quercetin, a gross and histologic study. Pharmacology. 1994;48:56-62.
-
36Leyck S, Parnham MJ. Acute anti inflammatory and gastric effects of the seleno-organic compound ebselen. Agents Actions. 1990;30:426-31.
-
37Lima JT, Almeida JRGS, Barbosa-Filho JM, Assis TS, Silva MS, Dacunha EVL, Braz-Filho R, Silva BA. Spasmolytic action of diplotropin, a furanoflavan from Diplotropis ferruginea Benth., involves calcium blockade in ginea-pig ileum. Z Naturforsch. 2005;60:1-8.
-
38Lin YL, Kuo YH, Shiao MS, Chen CC, Ou JC. Flavonoid Glycosides from Terminalia catappa L. J Chin Chem Soc. 2000;47:253-6.
-
39Lowry OH, Rosebrough NJ, Farr AL, Randall RJ. Protein measurement with the Folin phenol reagent. J Biol Chem. 1951;193:265-75.
-
40Makris DP, Kefalas P. Characterization of polyphenolic phytochemicals in red grape pomace. Int J Waste Resources. 2013;3:126.
-
41Manach C, Morand C, Demigne C, Texier O, Regerat F, Rémésy C. Bioavailability of rutin and quercetin in rats. FEBS Lett. 1997;409:12-6.
-
42Martin MJ, Casa CL, Lastra CADL, Cabeza J, Villegas I, Motilva V. Anti-oxidant mechanisms involved in gastroprotective effects of Quercetin. Z Naturforsch C: J Biosci. 1998;53:82-8.
-
43Martin MJ, Motilva V, Lastra CADL. Quercetin and naringenin, effects on ulcer formation and gastric secretion in rats. Phytother Res . 1993;7:150-3.
-
44Mohale DS, Dewani AP, Chandewar AV, Khadse CD, Tripathi AS, Agrawal SS. Brief review on medicinal potential of Terminalia catappa Journal of Herbal Medicine and Toxicology. 2009;3:7-11.
-
45Mohanty S, Cock IE. The chemotherapeutic potential of Terminalia ferdinandiana: Phytochemistry and bioactivity. Phcog Rev. 2012;6:29-36.
-
46Mota KSDL, Dias GEN, Pinto MEF, Luiz-Ferreira A, Souza-Brito ARM, Hiruma-Lima CA, Barbosa-Filho JM, Batista LM. Flavonoids with gastroprotective activity. Molecules 2009;14:979-1012.
-
47Parmar NS, Parmar S. Anti-ulcer potential of flavonoids. Indian J Physiol Pharmacol. 1998;42:343-51.
-
48Pasha SG, Khateeb MS, Pasha SA, Khan MSA, Shankaraiah P. Anti-epileptic activity of methanolic extract of Terminalia coriacea {Roxb.} Wight & Arn. in rats. J Adv Pharm Technol Res. 2013;3:502-10.
-
49Pettit GR, Hoard MS, Doubek DL, Schmidt JM, Pettit RK, Tackett LP, Chapuis JC. Antineoplastic agents 338. The cancer cell growth inhibitory constituents of Terminalia arjuna (Combretaceae). J Ethnopharmacol . 1996;53:57-63.
-
50Pietta P, Gardana C, Pietta A. Flavonoids in herbs. In Flavonoids in Health and Disease 2nd ed., A Catherine, Rice Evans, Lester Packer (eds). Taylor and Francis CRC Press. 2003. p. 43-50.
-
51Pietta PG. Flavonoids as antioxidant. J Nat Prod. 2000; 62:1035-42.
-
52Plant Metabolomics Standard MS Data. Institute of Food Research. Norwich Research Park, UK. [Internet]. [retrieved on 2014 February 01]. Available from: http://www.ifr.ac.uk/metabolomics/default.html
» http://www.ifr.ac.uk/metabolomics/default.html -
53Rainova L, Nakov N, Bogdanova S, Minkov E, Stoytcheva DS. Ulceroprotective activity of the flavonoids of Genista rumelica Vel. Phytother Res . 1988;2:137-9.
-
54Rao CV, Govindarajan SKOR, Rawat AKS, Mehrotra S, Pushpangadan P. Quercetin, a bioflavonoid, protects against oxidative stress-related gastric mucosal damage in rats. Nat Prod Sci. 2003;9:68-72.
-
55Rashed K, Luo MT, Zhang LT, Zheng YT. Inhibition of human immunodeficiency virus (HIV-1) by Terminalia muelleri extracts and bioactive constituents. Pharmanest 2013;4:1069-80.
-
56Russo A, Acquaviva R, Campisi A, Sorrenti V, Giacomo CD, Virgata G, Barcellona ML, Vanella A. Bioflavonoids as antiradicals, antioxidants and DNA cleavage protectors. Cell Biol Toxicol. 2000; 16:91-8.
-
57Salim AS. Removing oxygen-derived free radicals stimulates healing of ethanol-induced erosive gastritis in the rat. Digestion 1990; 47:24-8.
-
58Sandhar HK, Kumar B, Prasher S, Tiwari P, Salhan M, Sharma P. A review of phytochemistry and pharmacology of flavonoids. Internationale Pharmaceutica Sciencia. 2011;1:25-41.
-
59Schieber A, Keller P, Streker P, Klaiber I, Carle R. Detection of Isorhamnetin glycosides in extracts of apples (Malus domestica cv. “Brettacher”) by HPLC-PDA and HPLC-APCI-MS/MS. Phytochem Anal. 2002; 12:87-94.
-
60Shay H, Komarov SA, Fels SS, Meranze D, Gruenstein M, Siplet H. A simple method for the uniform production of gastric ulceration in the rat. Gastroenterology. 1945;5:43-61.
-
61Siddiqua F. Anti-oedematogenic and anti-inflammatory activities of Terminalia coriacea (Roxb.) Wight & Arn. stem bark aqueous extract in three experimental models. Master of Pharmacology Thesis . Anwarul Uloom College of Pharmacy affiliated to Jawaharlal Nehru Technological University, Hyderabad, 2014.
-
62Sumbul S, Ahmad MA, Asif M, Akhtar M. Role of phenolic compounds in peptic ulcer: An overview. J Pharm Bioall Sci. 2011; 3:361-67.
-
63Tsimogiannis D, Samiotaki M, Panayotou G, Oreopoulou V. Characterization of Flavonoid Subgroups and Hydroxy Substitution by HPLC-MS/MS. Molecules. 2007;12:593-606.
-
64Utley HG, Bernheim F, Hochstein P. Effect of sulfhydryl reagents on peroxidation in microsomes. Arch Biochem Biophys. 1967;118:29-32.
-
65Zayachkivska OS, Konturek SJ, Drozdowicz D, Konturek PC, Brzozowski T, Ghegotsky MR. Gastroprotective effects of flavonoids in plant extracts. J Physiol Pharmacol. 2005;56:219-31.
-
Disclosure of funding: no funding received
Publication Dates
-
Publication in this collection
08 May 2017 -
Date of issue
July-Sept 2017
History
-
Received
25 Jan 2017 -
Accepted
03 Mar 2017