Abstracts
Knowledge of maximum daily rain and its return period in a region is an important tool to soil conservation, hydraulic engineering and preservation of road projects. The objective of this work was to evaluate the spatial variability of maximum annual daily rain considering different return periods, at the Rio de Janeiro State. The data set was composed by historical series of 119 rain gauges, for 36 years of observation. The return periods, estimated by Gumbel distribution, were 2, 5, 10, 25, 50 and 100 years. The spatial variability of the return periods was evaluated by semivariograms. All the return periods presented spatial dependence, with exponential and spherical model fitted to the experimental semivariograms. The parameters of the fitted semivariogram model were very similar; however, it was observed the presence of higher nugget effects for semivariograms of longer return periods. The values of maximum annual daily average rain in all the return periods increased from north to south and from countryside to the coast. In the region between the Serra do Mar range and the coast, besides increasing in magnitude, an increase in the spatial variability of the studied values with increasing return periods was also noticed. This behavior is probably caused by the orographic effect. The interpolated maps were more erratic for higher return periods and at the North, Northeast and Coastal Plain regions, in which the installation of new pluviometric stations are recommended.
runoff; extreme rainfall; geostatistics; kriging
O conhecimento das precipitações pluviais máximas diárias e seu período de retorno em uma região são características importantes no dimensionamento de trabalhos de conservação de solos, obras hidráulicas, estradas, etc. No entanto, muitos locais não possuem séries históricas adequadas de precipitação, sendo o uso da interpolação geoestatística uma alternativa para a estimativa de dados visando viabilizar a elaboração de mapas de iso-ocorrência. Nesse contexto, o presente trabalho teve como objetivo avaliar a distribuição das precipitações pluviais máximas diárias anuais para diferentes períodos de retorno para o Estado do Rio de Janeiro por meio de técnicas geoestatísticas. As séries de dados foram provenientes de 119 postos pluviométricos, que apresentavam, em média, 36 anos de observações. Para cada estação foi identificada a chuva média máxima diária anual e, em seguida, foram estimados os eventos associados aos períodos de retorno de 2, 5, 10, 25, 50 e 100 anos por meio da distribuição Gumbel. Com esses conjuntos de dados, foram obtidos os modelos experimentais de semivariogramas. Os resultados revelaram que as chuvas associadas aos seus respectivos períodos de retorno apresentaram dependência espacial, com modelo exponencial e esférico ajustados aos semivariogramas experimentais. A precipitação pluvial máxima média diária anual e os eventos associados aos diferentes períodos de retorno tenderam ser maiores de Norte para Sul e do interior para o litoral no Estado. Entre a Serra do Mar e o litoral observou-se, além do aumento na magnitude dos valores, maior variabilidade espacial à medida que se aumentaram os períodos de retorno. O modelo geoestatístico foi mais errático para maiores períodos de retorno, e para as regiões Norte, Noroeste e da Baixada Litorânea, sendo estes locais recomendados para a instalação de novas estações pluviométricas.
escoamento superficial; precipitações extremas; geoestatística; krigagem
Spatial variability of maximum annual daily rain under different return periods at the Rio de Janeiro state, Brazil
Variabilidade espacial da chuva máxima diária anual média e sob diferentes períodos de retorno no estado do Rio de Janeiro, Brasil
Roriz Luciano MachadoI, * * Corresponding author. ; Marcos Bacis CeddiaII; Daniel Fonseca de CarvalhoII; Eleandro Silva da CruzIII; Marcio Rocha FrancelinoI
IInstituto Federal de Educação, Ciência e Tecnologia Goiano - Campus Ceres, Rod. 154, km 03, Caixa Postal 51, 76300-000 Ceres (GO). E-mail: rorizmachado@efgoiano.edu.br
IIUniversidade Federal Rural do Rio de Janeiro, Km 7, BR 4654, 23890-000 Seropédica (RJ). E-mail: ceddia@ufrrj.br, carvalho@ufrrj.br; marciorocha@ufrrj.br IIIINCRA. Cuiabá (MT). E-mail: eleandro.cruz@cba.incra.gov.br
ABSTRACT
Knowledge of maximum daily rain and its return period in a region is an important tool to soil conservation, hydraulic engineering and preservation of road projects. The objective of this work was to evaluate the spatial variability of maximum annual daily rain considering different return periods, at the Rio de Janeiro State. The data set was composed by historical series of 119 rain gauges, for 36 years of observation. The return periods, estimated by Gumbel distribution, were 2, 5, 10, 25, 50 and 100 years. The spatial variability of the return periods was evaluated by semivariograms. All the return periods presented spatial dependence, with exponential and spherical model fitted to the experimental semivariograms. The parameters of the fitted semivariogram model were very similar; however, it was observed the presence of higher nugget effects for semivariograms of longer return periods. The values of maximum annual daily average rain in all the return periods increased from north to south and from countryside to the coast. In the region between the Serra do Mar range and the coast, besides increasing in magnitude, an increase in the spatial variability of the studied values with increasing return periods was also noticed. This behavior is probably caused by the orographic effect. The interpolated maps were more erratic for higher return periods and at the North, Northeast and Coastal Plain regions, in which the installation of new pluviometric stations are recommended.
Key words: runoff, extreme rainfall, geostatistics, kriging.
RESUMO
O conhecimento das precipitações pluviais máximas diárias e seu período de retorno em uma região são características importantes no dimensionamento de trabalhos de conservação de solos, obras hidráulicas, estradas, etc. No entanto, muitos locais não possuem séries históricas adequadas de precipitação, sendo o uso da interpolação geoestatística uma alternativa para a estimativa de dados visando viabilizar a elaboração de mapas de iso-ocorrência. Nesse contexto, o presente trabalho teve como objetivo avaliar a distribuição das precipitações pluviais máximas diárias anuais para diferentes períodos de retorno para o Estado do Rio de Janeiro por meio de técnicas geoestatísticas. As séries de dados foram provenientes de 119 postos pluviométricos, que apresentavam, em média, 36 anos de observações. Para cada estação foi identificada a chuva média máxima diária anual e, em seguida, foram estimados os eventos associados aos períodos de retorno de 2, 5, 10, 25, 50 e 100 anos por meio da distribuição Gumbel. Com esses conjuntos de dados, foram obtidos os modelos experimentais de semivariogramas. Os resultados revelaram que as chuvas associadas aos seus respectivos períodos de retorno apresentaram dependência espacial, com modelo exponencial e esférico ajustados aos semivariogramas experimentais. A precipitação pluvial máxima média diária anual e os eventos associados aos diferentes períodos de retorno tenderam ser maiores de Norte para Sul e do interior para o litoral no Estado. Entre a Serra do Mar e o litoral observou-se, além do aumento na magnitude dos valores, maior variabilidade espacial à medida que se aumentaram os períodos de retorno. O modelo geoestatístico foi mais errático para maiores períodos de retorno, e para as regiões Norte, Noroeste e da Baixada Litorânea, sendo estes locais recomendados para a instalação de novas estações pluviométricas.
Palavras-chave: escoamento superficial, precipitações extremas, geoestatística, krigagem.
INTRODUCTION
The knowledge about maximum daily rain in one region and its period of return is important for planning spill-way, channel, dams, and drainages in engineering projects (BEIJO et al., 2005). In order to minimize problems from extreme events, engineers have been using statistical methods for obtaining the magnitude of one maximum event associated to a recurrent period. The frequency distribution analysis is commonly used to estimate a return period of a maximum annual rain event, which can be defined as a period, in year, in which a referred event, in average, can be equaled or overcome at least once (ELTZ et al., 1992). The maximum daily rain, for example, is used in the calculation of dimension of terraces considering a return period of 5 to 10 years (CRUCIANI, 1989).
According to BEIJO et al. (2005) the theory of extreme values has been applied in many research areas that use statistical analysis of variables related to the meteorological phenomena, most frequently the Gumbel distribution, Fisher-Tippet I type distribution or double exponential, developed by GUMBEL (1958). However, in many regions, there is lack of rain historical series, not allowing the use of Gumbel distribution. In this case, the interpolation is the most frequently used.
Most of the interpolation methods do not consider the existence of spatial correlation between the data. According to ZAMBOTI (2001), the existence of spatial correlation implies that nearer observations are more similar than the farther ones and, consequently, the use of statistical methods that consider the independence of observations are not appropriated. In this context, the use of geostatistics has increased, and are used to evaluate the spatial dependence between observations such as these of, as covariance, correlation and semivariance. Moreover, geostatistics offers an interpolation method (kriging), which has no bias and minimum variance (BURGESS and WEBSTER, 1980; VIEIRA, 2000).
Geostatistics was used by VIEIRA et al. (1991) for mapping the spatial variability of maximum daily rain for Sao Paulo State (Brazil). The authors concluded that, with the exception of the coastal region, only one exponential semivariogram model was sufficient to estimate all the periods of return in the State. MONTEBELLER et al. (2007) applied geostatiscs to mapping the spatial variability of the rainfall erosivity potential for Rio de Janeiro State, Brazil, and also found that a single exponential model was sufficient to estimate erosivity along the state.
The purpose of this paper was to evaluate and map, using geostatistics, the spatial variability of maximum average daily rain, as well as, maximum average annual rain associated to the period of return of 2, 5, 10, 25, 50 and 100 years at Rio de Janeiro State.
2. MATERIAL AND METHODS
Considering the purpose of this work, 119 pluviometric stations were selected, being 101 scattered along the Rio de Janeiro State and 18 located along the border line between Rio de Janeiro and Minas Gerais (7), São Paulo (7), and Espirito Santo States (4), (Figure 1).
The steps of the work consisted on the collection and selection of historical series, standardization of maximum rain data and calculation of the return period. Thereafter, the geographic coordinates of the pluviometric stations were converted to UTM system, and descriptive statistics as well as geostatistical analysis were performed using SAEG 5.0 and Geostat software (VIEIRA et al., 1983), respectively.
The data of maximum annual daily rain were extracted from pluviometric historical series belonging to meteorological stations of HIDROWEB/ANA (Hydrological Information System/Brazilian Water Agency), INMET (Brazilian Meteorological Institute), LIGHT (Electricity S/A) and SERLA (River and Lagoon Foundation of Rio de Janeiro State).
The historical series presented, in average, 36 years of observation, encompassing a period from 1915 to 2006. The calculation of maximum annual daily average rain was made from historical series data analysis, which was organized in electronic spreadsheet. The rain precipitation related to different return periods (2, 5, 10, 25, 50 and 100 years) were obtained, in each historical series, through the maximum annual daily average rain and its standard deviation at the Gumbel distribution. The following equations were used:

where:
γ = reduced variable of the Gumbel distribution;
ln = neperian logarithm;
T = period of return, in years;
γn e Sn = table values as function of the numbers of years (n) of the data series.
Descriptive statistics of all the historical series were determined, including mean, standard error, mode, median, maximum, minimum, variance, asymmetry, kurtosis and normality (Lilliefors test), using the software SAEG 5.0. Thereafter, the geographic coordinates of each pluviometric station, belonging to zones 23S e 24S, were transformed to the Universal Transverse Mercator (UTM) projection system, through TC-GEO software, developed by IBGE (Brazilian Geography and Statistics Institute) and GEOCALC (Blue Marble Geographics, 1992), respectively.
In order to evaluate the spatial variability and generate maps of rain by geostatistics tools, the spatial dependence of the rain was measured through semivariance analysis (γ(h)) (equation 4), according to methodology described by VIEIRA and LOMBARDI NETO (1995). This procedure was made by the software GEOSTAT (VIEIRA et al., 1983).

where:
γ(h) = semivariance as function of a distance h;
N(h) = number of pairs [Z(x1), Z(x1 + h)] spaced by a h vector;
xi = spatial position of a Z variable, and
Z = maximum annual daily rain values (mm day-1) associated to different period of return.
After calculation of experimental semivariograms for maximum annual daily average rain, and at different return periods, models were fitted based on the values of the parameters nugget effect (Co), sill (C0+C1) and range (a) parameters. The choice of the best model was based on "Jack Knifing" procedure (Vieira et al., 1983). Besides, the spatial dependence index (SDI = Co/(Co+C1)*100) of the semivariograms, proposed by Cambardella et al. (1994), was evaluated. However, the SDI criteria proposed by Zimback (2001) was used instead because it consider the relation between the structural semivariance (C1) and the sill (C0 +C1), in percentage (C1/(Co+C1)*100). Classes of SDI were: weak (SDI<25%), moderated (26<SDI<75%) and strong (SDI>75%).
The parameters of the best fitted model were used in ordinary kriging interpolation of the maximum annual daily rain, and at different return periods, through Geostat software (VIEIRA et al., 1983). The files with interpolated data were exported to the Surfer 8.0 software (GOLDEN SOFTWARE Inc., 2002), where kriged maps, with 1000 x 1000 meters grid resolution, were obtained.
3. RESULTS AND DISCUSSION
The statistics parameters of maximum daily rain at different periods of return are presented on table 1. Most of the statistics parameters increased proportionally according to the return period. This behavior indicates that the higher the period necessary to equal or overcome a specific rain, at least once in average, the higher the variability associated. According to Warrick and NIELSEN (1980), the coefficient of variance (CV), exception to the 2 and 5 year return period, were considered high (>24%).
The values of asymmetry, higher than 0.5 or smaller than -0.5, as well as kurtosis, higher than 3, indicate that the data do not follow normal distribution (WEBSTER, 2001), which were confirmed by the Lilliefors normality test. The non normality of the data can be explained by the intrinsic characteristic of the attribute evaluated, which is considered an extreme event in the nature, being similar to other kinds of distribution, for example, the Gumbel distribution. According to ISAAKS and SRIVASTAVA (1989), a variable does not need to have normal distribution in order to apply geostatistical analysis, being more important the proportional effect, which means that the average and the variability of the data are constant at the study site.
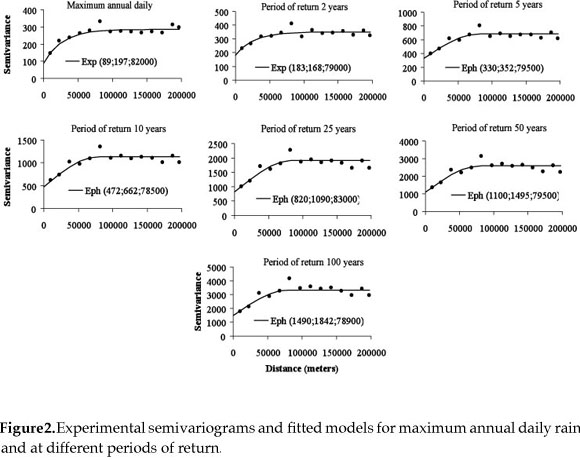
Figure 2 and table 2 present semivariograms of maximum annual daily average rain and at different return periods, as well as its parameters and SDI classification, respectively. The exponential model was better fitted to experimental semivariograms of maximum annual daily rain and at the 2-years return period, while the spherical model were better fitted to the other return period.
The range of the models were relatively similar, minimum of 78500 and maximum of 83000 meters, and imply that within these radii, the data are spatially correlated. Besides, for example, in the case of the 25-year return period, estimates of maximum annual daily rain can be made for places without meteorological stations located as far as 83000 meters from the nearest pluviometric station.
The nugget effect of the semivariograms presents a systematic behavior, increasing proportionally to the period of return. The higher values of nugget effect in higher return periods can be explained by the introduction of higher extreme events in the data set. According to ISAAKS and SRIVASTAVA (1989), the increase of nugget effect (the random portion of semivariance) also increases the error of kriging interpolation. So, the kriging variance of maximum daily rain at higher return period is expected to be higher, although the SDI results present similar and moderate values.
Maps of maximum daily rain are presented in figure 3. There is a tendency of elevation in the height of rain precipitation from countryside to the coastal region, and from the North to the South of Rio de Janeiro State. Due to this tendency, Parati and Angra dos Reis municipality, located along the coast of the southern region, presented the higherst values of rain precipitation. This tendency can be explained by the orographic effect or windward, caused by the orientation of the Serra do Mar range along the Brazilian coast line. According to SMITH and BARSTAD (2004), places with orographic effect present higher humidity in the air mass, and consequently, higher probability to produce rain with higher intensity.

Analyzing the maps (Figure 3a) it is possible to notice that the 75 mm day-1 rain occur at most regions of the Rio de Janeiro State, embracing areas of higher elevation. The isohyets vary from 60 mm day1, mainly at North and Northeast region and between the border line of Metropolitan and Fluminense Central region (more specifically between Paraiba do Sul and São José Vale do Rio Preto municipality), to 135 mm day-1 in the South region (at the border line between Paraty and Angra dos Reis municipality). High rain precipitation (105 mm day-1) can also be found in the Metropolitan region, at Magé and part of Guapimirim municipality, as well as, the most part of Coastal Plain region. Another place that can be stressed, at the Coastal Plain region, is at the border line between Silva Jardim and Nova Friburgo municipality, with 120 mm day-1 rain precipitation.
Analyzing the maps together, it's possible to distinguish two regions, divided by the Serra do Mar range. In the first one, from the Serra do Mar range to the countryside, the spatial variability of maximum annual daily rain does not change as much as the second one, from the Serra do Mar to the coast. In the first region, excepting a small area at the border line between the South Fluminense and Metropolitan region (Barra do Pirai, Mendes and Vassouras municipality), it is possible to notice that in the spatial variability of maximum annual daily rain is not only lower than the second one, but also does not change with the increasing the return period, mainly at 25 years (Figure 3e).
This effect, at the first region, is evident when comparing the change in the map area of spatial variability of maximum annual daily rain at different periods of return. It is possible to notice a great variation only in the magnitude of the events. This characteristic probably indicates a stability of spatial variability in this region, and is in agreement with the results presented by VIEIRA et al. (1991). These authors, working with maximum daily rain at São Paulo State, also found that the isohyet maps were not so sensitive to changes in the return periods.
On the other hand, in the second region, the changes in the return period imply in higher differences both in the class intervals of the map and in the magnitude of the rain. This results indicate that an arbitrary selection of a specific rain event in one region or the use of one value belonging to other region, during a project planning, is an improper procedure.
The maps of kriging variance are presented in figure 4. The lighter area of the maps represent the region in which the error is lower and agree with the regions in which a higher frequency of pluviometric stations is found. The darker areas represent the opposite situation. This relation explains why the North, Northwest and the Coastal Plain regions of Rio de Janeiro State present the higher error associated with kriging interpolation and is in agreement with the results found by MONTEBELLER et al. (2007). In these regions, which have less pluviometric stations, it is recommended to install new pluviometric stations.
Another characteristic of the kriging variance is its increase according to the elevation of the return period. This behavior, as already mentioned above (Figure 2), and according to ISAAKS and SRIVASTAVA (1989), is caused, by the higher values of nugget effect, which were found in the semivariances of the higher return periods.
4. CONCLUSIONS
1. The maximum annual daily average rain, as well as all the return periods present spatial dependence, implying that geostatistical interpolation is appropriate to generate spatial variability maps of these variables at the Rio de Janeiro State.
2. The values of maximum annual daily average rain in all the return periods increase from north to south and from the countryside to the coast. Besides, in the region between the Serra do Mar range and the coast, an increase in the magnitude and in the spatial variability of the values is noticed. This behavior is probably caused by the orographic effect.
3. The interpolated maps were more erratic for higher return periods and at the North, Northwest and Coastal Plain regions, in which the installation of new pluviometric stations is recommended.
Received for publication in September 9, 2008 and accepted in January 21, 2010.
- BEIJO, L.A.; MUNIZ, J.A.; CASTRO NETO, P. Tempo de retorno das precipitações máximas em Lavras (MG) pela distribuição de valores extremos do tipo I. Ciência e Agrotecnologia, v. 29, p. 657-667, 2005.
- BLUE MARBLE GEOGRAPHICS. GEOCALC - The Geographic Calculation. Version 3.0. 1992-94. http://www.bluemarblegeo.com/
- BURGESS, T.M.; WEBSTER, R. Optimal interpolation and isarithmic mapping of soil properties. I. The semivariogram and punctual kriging. Journal Soil Science v.31, p.315, 1980.
- CAMBARDELLA, C.A.; MOORMAN, T.B.; NOVAK, J.M.; PARKIN, T.B.; KARLEN, D.L.; TURCO, R.F.; KONOPKA, A.E. Field-scale variability of soil properties in Central Iowa Soils. Soil Science Society of America Journal, v.58, p.1501-1511, 1994.
- CRUCIANI, D.E. Dimensionamento de sistemas de drenagem superficial e terraços com base nas características hidrológicas locais. In: SIMPÓSIO SOBRE TERRACEAMENTO AGRÍCOLA, 1989, Campinas. Anais... Campinas: Fundação Cargill, 1989. 266p.
- ELTZ, F.L.; REICHERT, J.M.; CASSOL, E.A. Período de retorno de chuvas em Santa Maria, RS. Revista Brasileira de Ciência do Solo, v.16, p.265-269, 1992.
- GOLDEN SOFTWARE INC. Surfer version 8.0. Surface mapping system. Copyright 1993 - Colorado, 2002.
- GUMBEL, E.J. Statistics of extremes New York: Columbia University, 1958. 375p.
- ISAAKS, E.H.; SRIVASTAVA, R.M. An introduction to applied geoestatistics New York, Oxford University Press, 1989. 561p.
- MONTEBELLER, C.A.; CEDDIA, M.B.; CARVALHO, D.F.; VIEIRA, S.R.; FRANCO, E.M. Variabilidade espacial do potencial erosivo das chuvas no Estado do Rio de Janeiro. Engenharia Agrícola, v.27 p.426-435, 2007.
- SMITH, R.B.; BARSTAD, I. A linear theory of orographic precipitation. Journal Atmospherics Sciences v.61 p.1377-1391. 2004.
- VIEIRA, S.R.; LOMBARDI NETO, F.; BURROWS, I.T. Mapeamento da chuva diária máxima provável para o estado de São Paulo. Revista Brasileira de Ciência do Solo, v.15, p.93-98, 1991.
- VIEIRA, S.R. Geoestatística em estudos de variabilidade espacial do solo. In: NOVAIS, R.F.; ALVAREZ V.; V.H. and SCHAEFER, C.E.G.R. (Ed.). Tópicos em ciência do solo. Viçosa, Sociedade Brasileira de Ciência do Solo, 2000. p.1-54
- VIEIRA, S.R.; HATFIELD, J.L.; NIELSEN, D.R.; BIGGAR, J.W. Geoestatistical theory and application to variability of some agronomical properties. Hilgardia, v.51, p.1-75, 1983.
- VIEIRA, S.R.; LOMBARDI NETO, F. Variabilidade espacial do potencial de erosão das chuvas do Estado de São Paulo. Bragantia, v.54, p.405-12, 1995.
- WARRICK, A.W.; NIELSEN, D.R. Spatial variability of soil physical properties in the field. In: HILLEL, D., (Ed.). Applications of soil physics. New York: Academic Press, 1980. p.319-344. Golden Software Inc.
- WEBSTER, R. Statistics to support soil research and their presentation. European Journal of Soil Science, v.52, p.331-340. 2001.
- ZAMBOTI, J.L. Mapas pluviométricos médios mensais no verão para o Estado do Paraná, utilizando métodos geoestatísticos. 2001. 117p. Tese (Doutorado em Agronomia) - Universidade Estadual Paulista "Júlio de Mesquita Filho", Faculdade de Ciências Agronômicas, Botucatu.
- ZIMBACK, C.R.L. Análise espacial de atributos químicos de solo para fins de mapeamento da fertilidade do solo. 2001. 114p. Tese (Livre Docência) - Universidade Estadual Paulista "Júlio de Mesquita Filho", Faculdade de Ciências Agronômicas, Botucatu.
Publication Dates
-
Publication in this collection
14 Feb 2011 -
Date of issue
2010
History
-
Received
09 Sept 2008 -
Accepted
21 Oct 2010