Abstracts
This paper examines the effects of trade liberalization on productivity growth in Brazil. In contrast with the previous literature, we examine whether this relationship is driven by product or input market effects, by including both output and input tariffs in firm-level productivity regressions and allowing for imperfect competition in the product market. The results show that the reductions of input tariffs were more important to explain the productivity growth that took place during trade liberalization in Brazil. Moreover, we find that the reduction in input tariffs led to a rise in mark-ups, while the reduction in output tariffs did the opposite.
Productivity; Trade Liberalization; Technology
Este artigo examina os efeitos da liberalização comercial sobre o crescimento da produtividade no Brasil. Em contraste com a literatura anterior, testamos se essa relação é derivada do mercado de produto ou de insumos, incluindo tanto as tarifas de produto e com as de insumos em regressões de produtividade ao nível da firma. Os resultados mostram que o mercado de insumos é mais importante que o efeito da concorrência para explicar o crescimento da produtividade no Brasil. Verificamos também que a redução das tarifas de insumo aumenta as margens de lucro, enquanto a redução de tarifas de produto tem o efeito oposto.
The effects of trade liberalization on productivity growth in Brazil: competition or technology?* * We thank Costas Meghir, Steve Redding, John Van Reenen and seminar participants at the Brazilian Econometric Society meetings and the Institute for Fiscal Studies for useful comments. We thank the Brazilian Ministry of Finance for financial support, IBGE for allowing us to use the PIA data and Honorio Kume for providing us with the tariffs data.
Marcos B. LisboaI; Naercio A. Menezes FilhoII; Adriana SchorIII
IBanco Itaú Unibanco. E-mail: marcos.lisboa@itau-unibanco.com.br
IIInsper Instituto de Ensino e Pesquisa e FEA-USP. E-mail: naercioamf@isp.edu.br
IIIIRI - USP. E-mail: aschor@usp.br
ABSTRACT
This paper examines the effects of trade liberalization on productivity growth in Brazil. In contrast with the previous literature, we examine whether this relationship is driven by product or input market effects, by including both output and input tariffs in firm-level productivity regressions and allowing for imperfect competition in the product market. The results show that the reductions of input tariffs were more important to explain the productivity growth that took place during trade liberalization in Brazil. Moreover, we find that the reduction in input tariffs led to a rise in mark-ups, while the reduction in output tariffs did the opposite.
Keywords: Productivity; Trade Liberalization; Technology.
JEL Code: D240; F12.
RESUMO
Este artigo examina os efeitos da liberalização comercial sobre o crescimento da produtividade no Brasil. Em contraste com a literatura anterior, testamos se essa relação é derivada do mercado de produto ou de insumos, incluindo tanto as tarifas de produto e com as de insumos em regressões de produtividade ao nível da firma. Os resultados mostram que o mercado de insumos é mais importante que o efeito da concorrência para explicar o crescimento da produtividade no Brasil. Verificamos também que a redução das tarifas de insumo aumenta as margens de lucro, enquanto a redução de tarifas de produto tem o efeito oposto.
1. INTRODUCTION
Despite the fact that the relationship between globalization and growth is still surrounded by controversy, several microeconomic studies have recently uncovered a positive relationship between trade liberalization in several developing countries and subsequent productivity growth.1 1 See Fernandes (2002), Pavcnik (2002) and the survey in Tybout (2002). In particular, evidence from the trade liberalization episode that took place in Brazil in the late 1980s and early 1990s also has confirmed this relationship.2 2 See Hay (2001), Ferreira and Rossi (2003) and Muendler (2002), for example. All of these studies, however, emphasized the rise in competition on the product market side, the "competitive push", as the main force driving productivity growth. In some studies the increase in efficiency brought about by the price fall has been described mainly as occurring within-firms, while in others through the demise of the least productive firms (selection).
The main aim of this paper is to propose and test an alternative channel through which trade liberalization can affect productivity. The opening process in the vast majority of Latin American countries, and in particular in the Brazilian case, changed not only the import tariffs on final consumer goods but also the those on goods that are primarily used as intermediate and capital inputs. This means that the progressive opening of the Brazilian economy brought about changes in the quality/price mix of the inputs that Brazilian firms use. This in turn can affect their total factor productivity in two ways.
The first mechanism is the "embodied technology effect", whereby the decline in input tariffs allows the national producers to have access to more technologically advanced equipment and components from abroad, which were previously prohibited or too expensive because of high tariffs. This allows the firms to change their production technology and therefore to increase their TFP. For example, Sakurai et al (1997) find that smaller countries in the OECD depend on imports for more than 50% of their acquired technology, that the share of acquired technology through imports has increased over time for all OECD countries and that this has had an important impact on productivity growth.
Moreover, input duty reductions can have an indirect effect on productivity as well. The model developed in Aghion et al. (2003), for example, predicts that the threat of entry will increase innovation and productivity among the more advanced firms in the intermediate sector that produce inputs for the final sector. According to this model, a tariff reduction in the input sector will lead to higher productivity in the intermediate sector, as a reflection on the competitive effect. But it will also improve the quality of the intermediate inputs that are used in producing the final good.
Despite the importance of these arguments, Tybout (2003) states that "very little firm-level empirical work has been done on the popular notion that increases in the menu of available inputs improve productivity" (p.18).3 3 Schor (2004) is a notable exception, but uses a different methodology from the one adopted here. In this paper we will test which effect is more important to productivity growth: the product market competition or the access to more advanced (or cheaper) inputs.4 4 Tariff reduction in inputs can also affect the local import-competing firms through changes in their pricing behavior, which could also benefit domestic firms that use these inputs. To do this, we will use data that are ideal to perform this task, that is, measures of output and input tariffs, which vary differently across sectors and over time in the period of Brazilian trade liberalization.
Besides improving the economy's overall efficiency, trade liberalization has long been thought to impact competition in the product market, bringing welfare gains by reducing the market power of domestic monopolies and oligopolies.5 5 See Helpman and Krugman (1989) for example. In contrast to the most recent literature cited above, but following a slightly older line of thought, we will also investigate the impact of trade liberalization on product market competition. In order to examine this issue, we employ a methodology initiated by Hall (1988) and followed by Harrison (1994), Domowitz et al. (1988) and others that allows for market power in the product market.
It is very important to allow for imperfect competition in this setting, since shifts in trade policy may alter the competitive environment. Failure to do this may lead us to confound productivity changes with mark-up changes. We go further than the previous papers, however, by using cross-industry as well as the time series variation in the trade indicators, which allows to condition out other policies changes that may be affecting the domestic firms in the same period. Finally, we will examine the effects of both input and output tariffs on mark-ups, since the efficiency gains from trade liberalization may be unevenly distributed across the firms in the industry, which may generate changes in the distribution of market power among them.
Our main result is that the reduction in input tariffs was the main factor responsible for the productivity growth of Brazilian firms in the sample period. When using only output tariffs, like all the previous studies in the literature, we do find the same productivity-enhancing effects of nominal tariffs. When we include both input and output tariffs, however, the impact of output tariffs becomes statistically insignificant, which suggests that the effect of output tariffs emphasized in other studies may in fact be the result of spurious correlation between output and input tariffs.
The paper is organized as follows. In the next section we present the extension of Hall (1988) and Harrison (1994) that we are going to use in this paper. Section 2 briefly describes the process of trade liberalization that took place in Brazil and Section 3 then describes the data that will be used in the empirical section. Section 4 presents the estimation results and the robustness tests, while Section 5 concludes.
2. THE MODEL
Our model extends Harrison (1994), which grew out of the work of Hall (1988) and was also used by Domowitz et al.(1988). The production for firm i in industry j at time t can be defined as:

where output Y is produced with labor (L), capital (K) and materials (M) through the production function G(.). A is an industry-specific index of Hicks-neutral technical progress and f is a firm-specific technology parameter.
By totally differentiating (1), and dividing through by Y, we obtain:

In his seminal article, Solow (1957) assumed perfect competition, so that the factor prices were equal to the value of their marginal product. Hall (1988), however, allowed for imperfect competition in the product market so that, if we assume Cournot behavior on the part of firms for simplicity, we have:

where s if the firm's market share and η is the industry price-elasticity of demand. Therefore, the F.O.C. for a profit maximizing firm will imply that:
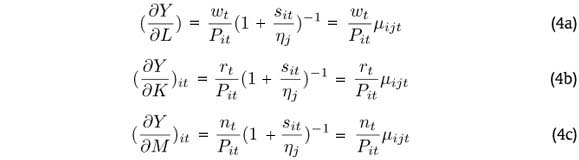
where µ is the firms' mark-up. Substituting (4-6) into (2) and rearranging, we get:

where αl ,αk ,αm are the labor, capital and materials share of output, respectively. Assume the production function is of the generalized Cobb-Douglas type:

then, αl + αk + αm = β, with β( > , = , < )1 if the technology has increasing, constant or decreasing returns to scale, respectively. Defining:

we obtain:

As Harrison (1994) shows, the bias of ignoring imperfect competition can be better understood if we assume constant returns, ignore the firm-specific effects and rewrite (7) as:

Therefore, if there is imperfect competition (µ > 1) and if the labor and material inputs are rising, then the "observed" productivity measure  will be an upward biased estimate of the true productivity measure
  . Moreover, if trade liberalization provokes a decline in the mark-up, then productivity gains are underestimated.
Harrison (1994) assumes that market shares do not vary across firms within the same sectors. But since the firms' market shares are expected to change substantially over time, especially in periods of trade liberalization, we allow the mark-up µ to have an industry θ and a firm-level component, which will be proxied by the firm's market share (s):µijt = θ0jt + θ1sit.6 6 This would be the case, for example, if the mark-up was a function of industry-level demand elasticity and firm-level market-share, as a linear approximation of the Cournot model described above. Therefore:

Most studies in the literature examined the impact of trade liberalization on productivity growth by splitting the sample into periods before and after trade liberalization.7 7 See Harrison (1994), Levinsohn (1993), Krishna and Mitra (1998) and Aghion et al. (2003). As we have data on tariffs, we do not need to break the sample, since we are able to investigate the direct impact of trade liberalization, through the tariff reductions. We assume that industry-specific productivity growth can be decomposed into a constant term plus input (Tin) and output (Tou) tariffs:

Since tariffs also affect mark-ups, they are assumed to have the same structure:8 8 This is an ad hoc way of examining the impact of tariffs on mark-up, but to add a structural model that explains the impact of tariffs on conduct and access to technology would greatly complicate the model.

Finally, the firm-specific productivity is decomposed into a firm-specific fixed effect
i, time dummies (ωt, to control for other macroeconomic policy changes) and a random disturbance εit :

The equation to be taken to data, in order to test our hypothesis, will therefore be:

where Xit = [αldl + αmdm] it, that is, the sum of labor and materials (in differences of logs), weighted by their share in output, 0 = λ0 is the constant term, 1 = γ0 is the average industry-level mark-up (that does not depend on tariffs), 2 = θ1 is the average firm-level mark-up, 3 = γ2 is the effect of input tariffs on mark-ups, 4 = γ2 if the effect of output tariffs on the mark-up, 5 = β-1 is the coefficient on capital (that capture the returns to scale) 6 = λ1 is the impact of input tariffs on productivity, 7 = λ2 is the impact of output tariffs on productivity, i are the firm-specific fixed effects, ωt are the time dummies and εit is the random error.
3. DATA DESCRIPTION
The data we use in this paper come from the Brazilian Annual Industrial Surveys (PIA), carried out by the Brazilian census bureau (IBGE). A firm qualifies for the PIA if at least half of its revenues stem from manufacturing activity and if it is formally registered with the Brazilian tax authorities. The PIA sample of firms was constructed from three layers. A non-random sample of the largest Brazilian manufacturers, plus a random sample of the medium firms and a non-random selection of newly founded firms. After cleaning the data,9 9 We dropped outliers (observations in the 1% range of the highest and lowest values for labor/output, capital/output and materials/output) and firms with less than two continuous observations. A change in the questionnaire in 1996 meant that the balance sheet data were not reported any more, so that only firms sampled in 1995 continued in our sample after this year. our final sample had 2,072 firms operating between 1988 and 1998 in 30 manufacturing sectors (equivalent to 2-digit SIC), with a total of 17,736 observations. Table A-1 presents the list of sectors and the number of firms in each sector.
The economic variables we use are sales and changes in final goods stocks, number of employees, costs of materials, salaries and capital stock.10 10 Sales were deflated using a sector-specific price index, whereas the deflator for materials was constructed using the input-output matrix (see the input tariffs construction below). Unfortunately, the capital stock information was only available until 1995, so that the capital series after that was constructed using a perpetual investment method. Table A-2 displays summary statistics of these variables.
The information on tariffs come from Kume et al. (2003) . Until the end of the 1980s, Brazilian trade policy meant very high nominal tariffs and also other non-tariff barriers. Nominal tariffs were in general redundant, as the price wedge between domestic and international prices tended to be lower than that suggested by tariffs. Imports were restricted mainly by non-tariff barriers, such as lists of prohibited goods, difficult access to government import authorization and limits on imports for each firm. On the other hand, there were several exception rules that reduced both the tariff and non-tariff barriers to import some specific goods.
In 1988 there was the first attempt to rationalize trade policy in such a way that the tariffs would express the degree of trade protection already in place.11 11 Kume et al. (2003) describe the trade liberalization process in Brazil. Most of the non-tariff barriers were abolished (elimination of some taxes on imported goods and some of the special regimes several industries faced) and nominal tariffs were reduced slightly. In 1990 the newly elected government announced a new trade policy that would revamp the old regime even more. At first, all but a few non-tariff barriers were eliminated. Trade policy thereafter would rely mostly on tariffs and on the exchange rate management (although the exchange rate regime was much more flexible than before). Secondly, a four-year schedule of tariff reductions was announced. After these four years, the tariff range would be between 0% and 40%. The government largely followed through in its announced promises and average tariff declined from over 50% in 1989 to 14% in 1994.
Tariffs are available at the product level, so in order to construct the output tariffs we matched each product to the equivalent two-digit sector definition. To construct the input tariff series we used the information of the input-output tables for various years (i.e. each industrial sector's purchases, per unit of output, of intermediate and capital goods from other sectors) to construct weights and compute a weighted average of the tariffs prevailing in each of these sectors over time.
Figures 1 and 2 present the distribution of the output and input tariffs, respectively, across sectors in 1988, 1990 and 1994. One can note in Figure 1 that in 1988 the tariff dispersion was quite high, with the most protected industries being automobiles (12), rubber (16), pharmaceuticals (20), other foods (31) and especially clothing (23), which had a tariff rate of 90%. Between 1988 and 1990 there was a small across-the-board tariff reduction, on the order of 10%. Between 1990 and 1994, the tariff reductions were massive, so that by 1994 most sectors had tariff rates fluctuating between 10 and 20%. The tariffs in the clothing sector, for example, were reduced from 70% to about 20% in this period.
The situation was quite similar regarding input tariffs, but they were set at a lower level than the output tariffs to start with, with the average tariff equal to 49% in 1988, and only in a few sectors were tariffs higher than 50%. Between 1988 and 1990, tariffs were reduced by about 18 percentage points in most sectors, whereas in 1994, most tariffs were in the range between 10% and 15%.12 12 It should be noted that if the products and inputs are similar in each sector, the figures should also look similar.
4. RESULTS
Before presenting the main results, it is worth commenting on the political economy of tariff reduction. From the policy point of view, the choice regarding which industry should be more protected and which needs more competition could be not random. If this were the case, tariffs could be correlated with productivity performance before (and perhaps during) the trade liberalization period, so that E[εit / ,
, ] ≠ 0 in (13). But, the equation to be estimated contains firm-specific fixed effects, so that if the political economy of trade protection did not change substantially over time, as Figures 1 and 2 suggest it did not, then these spurious correlations will be controlled for.
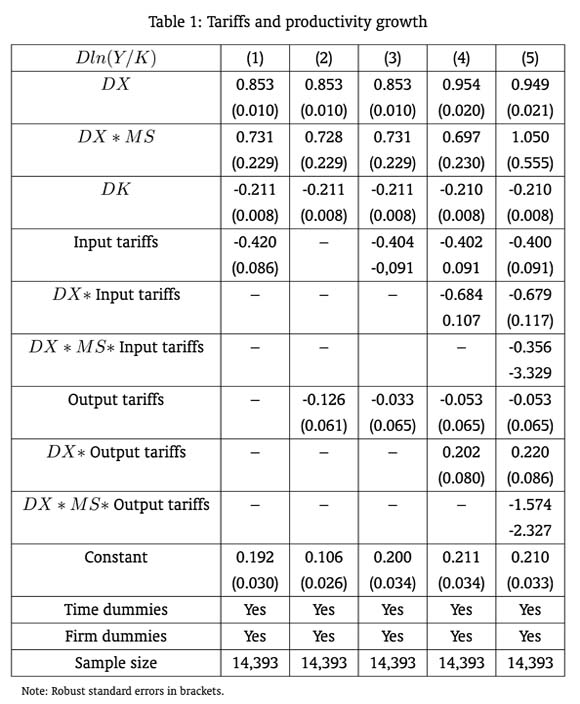
Table 1 contains the main results of this paper. Column (1) presents the results of a simple specification that includes input tariffs and the variables that come from the theoretical model. The coefficient on market share is quite strong and significant however, showing that the markups do depend on the size of the firms so that larger firms tend to have higher profit margins. The coefficient of the capital growth variable was estimated to be negative, which implies that firms operate on average with decreasing returns to scale, a result also found in Harrison (1994). More importantly, the coefficient on input tariffs attracted a precisely estimated negative coefficient, meaning that a decline in input tariffs is associated with an increase in productivity growth, as expected according to the theory.
In column (2) we included output tariffs in the specification, instead of the input tariffs, and they al so attracted a negative and statistically significant coefficient, meaning that, as with the previous literature, a decline in output tariffs tend to raise productivity growth. Column (3), however, where both input and output tariffs are included jointly in the equation, shows that while the coefficient on input tariffs remains statistically significant, the coefficient of the output tariffs declines by a factor of four and becomes insignificant. This means that the input tariff effect dominates the output tariff one and it suggests that the effect of trade liberalization on productivity growth is more likely to be the result of input market considerations than due to more competition in the product market.13 13 It must be noted the time-series variation of input tariffs is larger than in the output tariffs, since the former varies across sectors, while the later does not.
Column (4) examines the impact of trade liberalization on mark-ups by including interactions between both tariffs and the change in costs (DX). We find that while the coefficient on the interaction between input tariffs and DX is negative, the one on the interaction between output tariffs and DX is positive. This means that, while a decline in input tariffs tends to raise mark-ups, the opposite occurs with a decline in output tariffs, which tends to decrease them, which is also accords well with the theory. It is important to note that the inclusion of these interactions in the regression does not modify the coefficients on the linear tariffs terms.
Finally, in column (5) we also included the interaction between the market shares, DX and the tariffs to examine whether tariffs have a differentiated impact on the mark-ups of the larger firms in the industry. The coefficients of these interactions turned out to be statistically insignificant, which shows that this differentiated impact does not seem to exist, so that tariffs seem to affect the mark-ups of firms independently of their size. None of our main results were altered nonetheless.
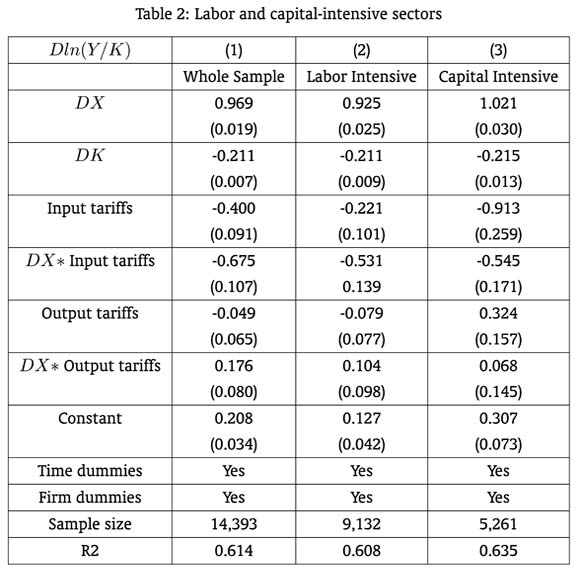
In order to shed more light on the reasons behind the input tariffs effect on productivity growth, in Table 2 we split the sample according to whether the firms operated in capital/technology-intensive sectors on one side or natural resources/labor-intensive sectors on another (see definitions in Table A1). We use a simpler specification without the market share variable to focus on the main results and column (1) presents the results of this specification using the whole sample as a benchmark, which basically confirms the results presented previously.14 14 Note the higher estimated markup, however, when the market share variable is not included. Comparing columns (2) and (3) we notice that the input tariffs coefficient estimated using the capital-intensive sub-sample is more than four times higher than the one estimated using the labor-intensive one. This result gives us some indication that the factor behind the input tariffs effect is related to technology, although competition in the input market cannot be ruled out. It is also interesting to note that the output tariffs seem to have no impact on productivity in the labor-intensive sectors, while it tends to be positively associated with it in the capital-intensive ones.
5. CONCLUSIONS
In this paper, we examined the effects of trade liberalization on productivity growth in Brazil. In contrast to the previous literature, though, we tested whether the positive relationship between openness and growth is the result of more competition in the product market or related to input factor considerations, like the access to technological advanced (or cheaper) capital inputs. Moreover, since trade liberalization changes mark-ups as well, we allowed for imperfect competition in the product market and relaxed the hypothesis of constant returns to scale.
The results show that the input market considerations dominate the competitive effect as an explanation for the productivity growth that took place during trade liberalization in Brazil. Moreover, a reduction in input tariffs seems to cause a rise in mark-ups, while a reduction in output tariffs does the opposite. Further experiments showed that the input tariffs effect is much more pronounced in the technology and capital-intensive sectors than in the natural resources and labor-intensive ones.
We believe this result has important implications for public policy. If the same effect is also found in other trade liberalization episodes in Latin America, it means that the impacts of a reduction in tariffs will depend on the magnitude of tariff reduction across different products. If the reduction is concentrated on products that are mainly used as inputs, this may have import productivity growth effects, and may in fact increase mark-ups due to the use of more efficient inputs. On the other hand, if openness is concentrated in the final goods sectors, we expect a reduction in the profit margins but the effects on productivity growth are uncertain. Finally, this can also have important effects in terms of demand for skilled labor.
BIBLIOGRAPHY
A. APPENDIX
- Aghion, P., Burgess, R., Redding, S., & Zilibotti, F. (2003). The unequal effects of trade liberalization: Theory and evidence from India. LSE, mimeo.
- Domowitz, I., Hubbard, G., & Petersen, B. (1988). Market structure and cyclical fluctuations in U.S. manufacturing. Review of Economics and Statistics, 70:5566.
- Fernandes, A. (2002). Trade policy, trade volumes and plant-level productivity in Colombian manufacturing industries. Yale University, mimeo.
- Ferreira, P. & Rossi, J. (2003). New evidence from Brazil on trade liberalization and productivity growth. International Economic Review, 44:13831407.
- Hall, R. (1988). The relationship between price and marginal cost in U.S. industry. Journal of Political Economy, 96:92147.
- Harrison, A. (1994). Productivity, imperfect competition and trade reform. Journal of International Economics, 36:5473.
- Hay, D. (2001). The post-1990 Brazilian trade liberalization and the performance of large manufacturing firms: Productivity, market share and profits. The Economic Journal, 111:6241.
- Helpman, E. & Krugman, P. (1989). Trade Policy and Market Structure. MIT Press, Cambridge.
- Krishna, P. & Mitra, D. (1998). Trade liberalization, market discipline and productivity growth: New evidence from India. Journal of Development Economics, 56:447462.
- Kume, H., Piani, G., & Souza, C. (2003). A política Brasileira de importação no período 198798: Descrição e avaliação. IPEA, mimeo.
- Levinsohn, J. (1993). Testing the imports-as market-discipline hypothesis. Journal of International Economics, 35:122.
- Muendler, M. (2002). Trade, technology and productivity: A study of Brazilian manufacturers, 198698. UCSD, mimeo.
- Pavcnik, N. (2002). Trade liberalization, exit and productivity improvements: Evidence from Chilean plants. Review of Economic Studies, 69:24576.
- Schor, A. (2004). Heterogeneous productivity response to tariff reduction: Evidence from Brazilian manufacturing firms. Journal of Development Economics, 75:373396.
- Solow, R. (1957). Technical change and the aggregate production function. Review of Economics and Statistics, 39:31220.
- Tybout, J. (2002). Plant and firm level evidence on new trade theories. In Choi, E. K. & Harrigan, J., editors, Handbook of International Trade Blackwell.
- Tybout, J. (2003). Why plant-level productivity studies are often misleading and an alternative approach to inference. NBER Working Paper, 9617.
Publication Dates
-
Publication in this collection
10 Nov 2010 -
Date of issue
Sept 2010