
ABSTRACT
Knowledge of the nutritional efficiency of species can help revegetation of forest areas, guiding the use of species that best adapt to environmental humidity, altitude and diversity. The objective of this study was to evaluate the nutrient utilization efficiency of N, P, K, Ca and Mg of dominant species in tropical dry forest and rainforest environments. The work was carried out in two areas, both in Pernambuco state, characterized as: Tropical Dry Forest of Caatinga and Tropical Rainforest of Atlantic Forest. A floristic and phytosociological survey was carried out. Species with highest density were evaluated, four from the dry forest and three from the rainforest. For each species, leaves of five healthy individuals of similar size were sampled and nutrient contents were determined. Leaf biomass was estimated by allometric equations. Rainforest species were more efficient in the use of N and K, and dry forest species in the use of P and K. In the dry forest environment, the species Pilocarpus spicatus and Guapira oposita stored more nutrients, and in the rainforest, the species Dialuim guianese was more efficient. These species are essential for the balance of ecosystems and the continuous and sustainable cycling of nutrients.
Keywords:
nutrients stock; caatinga; atlantic forest; nutrient use
INTRODUCTION
Tropical forest environments are globally known as high biodiversity sites because they are subject to climatic conditions that favor the development and perpetuation of a large number of species (Mittermeier et al., 2011Mittermeier RA, Turner WR, Larsen FW, Brooks TM & Gascon C (2011) Global biodiversity conservation: the critical role of hotspots. In: Zachos F & Habel J (Eds.) Biodiversity hotspots Berlin, Springer. p.3-22.). The tropical climate, especially due to temperature and humidity, presents more favorable conditions for the establishment and development of forest species, but also limits their occurrences and thus contributes to the predominant forest physiognomic identity.
Among tropical forests of Northeast Brazil, two distinct formations with composition and structure related to environmental conditions can be highlighted (Myers et al., 2000Myers N, Mittermeier RA, Mittermeier CG, Fonseca GA & Kent J (2000) Biodiversity hotspots for conservation priorities. Nature, 403:853-858.; Cavalcanti et al., 2009Cavalcanti ADDC, Rodal MJN, Sampaio EVSB & Costa KCC (2009) Mudanças florísticas e estruturais, após cinco anos, em uma comunidade de Caatinga no estado de Pernambuco, Brasil.Acta Botanica Brasilica, 23:1210-1212.). The dry forest, represented in Brazil by the Caatinga biome, which is inserted in the Brazilian semi-arid region, presents annual precipitations of up to 700 mm, with one or two seasons of drought during the year, under temperature regimes ranging from 17 °C to 35 °C (Reboita et al., 2010Reboita MS, Gan MA, Rocha RP & Ambrizzi T (2010) Regimes de precipitação na América do Sul: uma revisão bibliográfica. Revista Brasileira de Meteorologia , 25:185-204.; Silva et al., 2010Silva PCG, Moura MSB, Kiill LHP, Brito LDL, Pereira LA, Sá IB, Correia RC, Teixeira AHC, Cunha TJF & Guimarães Filho C (2010) Caracterização do Semiárido brasileiro: fatores naturais e humanos. In: Sá IB & Silva PCG (Eds.) Semiárido brasileiro: pesquisa, desenvolvimento e inovação. Petrolina, Embrapa. p.18-48.). The rainforest of Atlantic Forest has precipitation varying between 1,000 to 2,200 mm annually, with temperatures of 19 °C to 26 °C in all its subdivisions. In the region of Pernambuco state, it presents precipitations up to 1,500 mm and temperatures around 25 °C (Dasilva & Pinto-da-Rocha, 2011DaSilva MB & Pinto-da-Rocha R (2011) História biogeográfica da Mata Atlântica: opiliões (Arachnida) como modelo para sua inferência. In: Carvalho CJB & EAB Almeida (Eds.) Biogeografia da América do Sul - Padrões & Processos. São Paulo, Roca. p.221-238.). These formations have differentiated leaf sizes and phenological patterns determined by the environmental conditions.
Both forest formations have high representativeness in the Brazilian territory (Mittermeier et al., 2011Mittermeier RA, Turner WR, Larsen FW, Brooks TM & Gascon C (2011) Global biodiversity conservation: the critical role of hotspots. In: Zachos F & Habel J (Eds.) Biodiversity hotspots Berlin, Springer. p.3-22.) and have been subjected to intense disturbances originated from anthropogenic actions. In the case of dry forest, the dependence of rural families on energy resources from vegetation has been the most degrading factor (Quesada et al., 2009Quesada M, Sanchez-Azofeifa GA, Alvarez-Añorve M, Stoner KE, Avila-Cabadilla L, Calvo-Alvarado J, Castillo A, Espírito-Santo MM, Fagundes M, Fernandes GW, Gamon J, Lopezaraiza-Mikel M, Lawrense D, Morellato LPC, Powers JS, Neves FS, Rosas-Guerrero V, Sayago R & Sanchez-Montoya G (2009) Succession and management of tropical dry forests in the Americas: Review and new perspectives. Forest Ecology and Management, 258:1014-1024.; Chidumayo & Gumbo, 2013Chidumayo EN & Gumbo DJJ (2013) The environmental impacts of charcoal production in tropical ecosystems of the world: a synthesis. Energy for Sustainable Development, 17:86-94.). In the rainforest, the environment was predominantly impacted by human pressure per dwelling, the installation of industrial poles and extensive sugarcane crops (Stehmann et al., 2009Stehmann JR, Forzza RC, Salino A, Sobral M, Costa DP & Kamino LHY (2009) Plantas da Floresta Atlântica. Rio de Janeiro, Instituto de Pesquisas Jardim Botânico do Rio de Janeiro. 516p.; Siminski & Fantini, 2010Siminski A & Fantini AC (2010) A Mata Atlântica cede lugar a outros usos da terra em Santa Catarina, Brasil.Biotemas, 23:51-59.).
However, despite degradations, these forests still have high levels of diversity and endemism. It is worth mentioning that few areas were protected in conservation units, making preservation of natural genetic resources even more important for the maintenance of this biodiversity (Burger & Delitti, 2008Burger DM & Delitti WBC (2008) Allometric models for estimating the phytomass of a secondary Atlantic Forest area of southeastern Brazil. Biota Neotropica, 8:131-136.; Cunha et al., 2013Cunha APM, Alvalá RC & Oliveira GS (2013) Impactos das mudanças de cobertura vegetal nos processos de superfície na região semiárida do Brasil. Revista Brasileira de Meteorologia, 28:139-152.; CGEE, 2016CGEE - Centro de Gestão e Estudos Estratégicos (2016) Desertificação, degradação da terra e secas no Brasil. Brasília, CGEE. 252p.). Considering the high number of ecosystem services provided by these forest formations to their environment such as regional temperature regulation, water bodies maintenance and nutrient cycling, studies related to these themes are fundamental for the maintenance and conservation of these forest formations.
However, in literature studies that aim to verify the nutritional performance of species in these two forest formations are incipient, especially regarding the role that each species exerts in its natural habitat. In this aspect, the contribution of leaf biomass is important to understand the nutritional relations of the species with the environment. In Caatinga forest, the phenomenon of deciduousness intensifies during the seasons of the year when the water deficit becomes more intense (Lima & Rodal, 2010Lima ALA & Rodal MJN (2010) Phenology and wood density of plants growing in the semi-arid region of northeastern Brazil. Journal of Arid Environments , 74:1363-1373.; Lima et al., 2012Lima ALA, Sampaio EVSB, Castro CC, Rodal MJN, Antonino ACD & Melo AL (2012) Do the phenology and functional stem attributes of woody species allow for the identification of functional groups in the semiarid region of Brazil? Trees, 26:1605-1616.). While in the Atlantic forest the proximity of the sea coast provides better humidity conditions, together with a better distributed rainfall regime, and they collaborate with the permanence of the leaves of a good part of the species during the dry season (Myers et al., 2000Myers N, Mittermeier RA, Mittermeier CG, Fonseca GA & Kent J (2000) Biodiversity hotspots for conservation priorities. Nature, 403:853-858.).
The efficiency of a species in terms of nutrient uptake relates the amount of biomass produced to the quantity of nutrients stored (Stahl et al., 2013Stahl J, Ernani PR, Gatiboni LC, Chaves DM & Neves CU (2013) Produção de massa seca e eficiência nutricional de clones de Eucalyptus dunnii e Eucalyptus benthamii em função da adição de doses de fósforo ao solo. Ciência Florestal , 23:287-295.; Albuquerque et al., 2018Albuquerque AS, Freire FJ, Barbosa MD, Marangon LC & Feliciano ALP (2018) Efficiency of biological utilization of micronutrients by forests species in hypoxerophytic Caatinga. Floresta e Ambiente, 25:01-10.). Knowing the nutritional efficiency of the species can help revegetation of forest areas, guiding the use of species that best adapt to environmental humidity, altitude and diversity, as is frequently reported in tropical forest areas (Santana & Souto, 2011Santana JAS & Souto JS (2011) Produção de serapilheira na Caatinga da região semi-árida do Rio Grande do Norte, Brasil. Idesia, 29:87-94.).
Our hypothesis is that the content, stock and nutritional efficiency should vary between species and between different forest environments. The dry forest species, with less diversity than rainforests, accumulate more nutrients, but are scarce due to the lower yields of leaf biomass, and are therefore less efficient. Another hypothesis is that in drier environments, nutritional efficiency is more individualized. Few species are responsible for the nutritional efficiency of N, others for P and still others for K. In environments of greater diversity, such as in rainforests, the responsibility for nutritional supply is realized by a larger group of species.
The objective of this study was to evaluate the nutrient utilization efficiency of N, P, K, Ca and Mg of dominant species in tropical dry forest and rainforest environments, considering their contents and nutritional stocks in leaf biomass.
MATERIAL AND METHODS
Study areas
The work was carried out in two areas with different typologies, both located in the state of Pernambuco, characterized as: Tropical Dry Forest of Caatinga located in the municipality of Araripina under the geographic coordinates 07°34'34 "S and 40°29'54" W; and Tropical Rainforest of Atlantic Forest, inserted in the territorial limits of the metropolitan area of Recife at 8º04'03''S and 34º55'00''W (Figure 1).
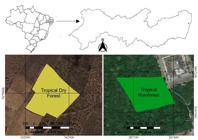
Geographical location of tropical dry forest and rainforest in the cities of Araripina and Recife in Pernambuco, Brazil.
For a better understanding of vegetation issues and their relationships with nutrient cycling, a soil characterization of the study areas was performed, where the chemical attributes were determined according to the methodological procedures described by Teixeira et al. (2017Teixeira PC, Donagemma GK, Fontana A & Teixeira WG (2017) Manual de métodos de análise de solos. Rio de Janeiro, Embrapa . 573p.). Deformed samples were collected in four experimental units with dimensions of 10 m x 25 m, where a subarea of 8 m x 20 m was considered a useful space for sampling. In each of the four experimental units, five simple samples were collected following a "x" pattern where the material was removed near the center and the vertices of the useful space and transferred to identified pails where they were homogenized. Samples with preserved structure were also collected for determination of soil density using a volumetric ring method at depths of 0-to-5 cm; 5-to-10 cm and 10-to-20 cm (Table 1).
For the study, species with the highest absolute density and with joint occurrence in at least four of the plots used for the phytosociological study were evaluated. Considering these conditions, it was possible to select four species for the dry forest and three species for the rainforest, among 10 dominant species of each area (Table 2).
Estimate of leaf biomass
Leaf biomass average was estimated for each species (kg individual-1) and area (kg ha-1). The equations used were proposed by Silva & Sampaio (2008Silva GC & Sampaio EVSB (2008) Biomassas de partes aéreas em plantas da Caatinga. Revista Árvore , 32:567-575.) for the dry forest and Chave et al. (2014Chave J, Réjou-Méchain M, Búrquez A, Chidumayo E, Colgan MS, Delitti WB & Henry M (2014) Improved allometric models to estimate the aboveground biomass of tropical trees. Global Change Biology, 20:3177-3190.) to the rainforest.
Quantification of foliar biomass per area in kg ha-1 of species was obtained by the sum of biomasses of individuals of each species. This measurement was carried out in 20 plots with dimensions of 10 m x 25 m (250 m2) totaling 5,000 m2, extrapolating the values to 10,000 m2 (Espig et al., 2008Espig SA, Freire FJ, Marangon LC, Ferreira RLC, Freire MBGS & Espig DB (2008) Composição e eficiência da utilização biológica de nutrientes em fragmento de Mata Atlântica em Pernambuco. Ciência Florestal, 18:307-314.) (Table 3).
Nutrient content, nutrient stock and nutritional efficiency of species
For each species, five healthy individuals of similar size were identified and georeferenced. Leaves of recent maturity were sampled in these individuals, collected in the middle third of the plant (crown) in the four cardinal points, forming a composite sample. The leaves were dried in a forced air circulation oven, minced in a Willey mill and stored for nutrient determination (N, P, K, Ca and Mg). Extraction of N and P was performed using sulfuric digestion. Determination of N occurred by distillation and titration according to the Kjeldahl method (Tedesco et al., 1995Tedesco MJ, Volkweiss SJ & Bohnen H (1995) Análises de solo, plantas e outros materiais. 2ª ed. Porto Alegre, UFRGS. 174p.). P was dosed by colorimetry (Braga & Defelipo, 1974Braga JM & Defelipo BV (1974) Determinação espectrofotométrica de fósforo em extrato de solo e material vegetal. Revista Ceres, 21:73-85.). For K, Ca and Mg, samples were digested in microwaves using wet digestion: 0.2 g of dry plant material, 5 mL of nitric acid and 5 ml of hydrogen peroxide were used. Digester was set to a maximum power of 1600 W, with a temperature of 160 °C for 30 minutes (elapsed time of digestion). K was measured by flame photometry and Ca and Mg by atomic absorption spectrophotometry (Teixeira et al., 2017Teixeira PC, Donagemma GK, Fontana A & Teixeira WG (2017) Manual de métodos de análise de solos. Rio de Janeiro, Embrapa . 573p.).
Nutrient contents were expressed in g kg -1. The stock was calculated by multiplying the nutrient content by leaf biomass of the species (kg ha-1). The nutritional efficiency was obtained by the ratio between leaf biomass and nutrient stock in and expressed in kg kg-1 (Barros et al., 1986Barros NF, Novais RF & Carmo DN (1986) Classificação nutricional de sítios florestais - Descrição de uma metodologia. Revista Árvore, 10:112-120.).
Statistical analysis
Data were tested for normality and homoscedasticity, assumptions required for analysis of variance (ANOVA), using Shapiro-Wilk (Shapiro & Wilk, 1965Shapiro SS & Wilk MB (1965) An analysis of variance test for normality. Biometrika, 52:591-611.) and Levene (Brown & Forsytre, 1974Brown MB & Forsytre AB (1974) Robust test for equality of variances. Journal of the American Statistical Association, 69:364-367.) tests, respectively, both at a probability level of 5%.
Subsequently, an ANOVA was performed considering the F test at 5% probability level. When significance was observed between the effects, the means were analyzed by the Scott-Knott test at a probability of 5%, using the SAEG statistical package (Euclydes, 2007Euclydes RF (2007) SAEG - Sistema para Análises Estatísticas. Versão 9.1. Viçosa, Fundação Arthur Bernardes. CD-ROM.).
RESULTS AND DISCUSSION
Nutritional characteristics of tropical dry forest species
Species of the tropical dry forest presented foliar nutritional contents in the following decreasing order: N > K > Ca > Mg > P (Figure 2A, B, C, D and E). Alves et al. (2017Alves AR, Ferreira RLC, Silva JAA, Dubeux Júnior JCB & Salami G (2017) Nutrientes na biomassa aérea e na serapilheira em áreas de caatinga em Floresta, PE. Pesquisa Florestal Brasileira, 37:413-420.) observed similar behavior, only with Ca being more absorbed than Mg.

Content (A, B, C, D and E), stock (F, G, H, I and J) and nutritional efficiency (K, L, M, N and O) of N, P, K, Ca and Mg in species of tropical dry forest in Pernambuco, Brazil. Averages represented by the same letter among species do not differ by the Skott-Knott test at 5% probability.
Pilocarpus spicatus was the species that presented the highest leaf content of P, showing a content around 30% higher than the average of the other species, besides having also high content of K. However, it presented low N content. Guapira oposita presented the highest content of N, showing a content around 33% higher than the average of the other species, but showed little content of K. Species did not differ in Ca content. Croton limae showed less Mg than the other species (Figure 2A, B, C, D and E).
High N contents in species may be due to decomposition of organic matter, which intensifies in the wet period in dry forest environment (Silva et al., 2018Silva AMO, Freire FJ, Barbosa MD, Ferreira RLC, Freire MBGS, Alves Junior FT, Freire CS & Silva ACF (2018) Compartmentalization and efficiency biological of nitrogen utilization in dry tropical forest. Revista Brasileira de Ciências Agrárias, 13:e5519.). It is also worth mentioning that this forest is located in the Araripe plateau, where the rainfall regime is higher than in lowland areas. Freitas et al. (2010Freitas ADS, Sampaio EVSB, Santos CERS & Fernandes AR (2010) Biological nitrogen fixation in tree legumes of the Brazilian semi-arid Caatinga. Journal of Arid Environments, 74:344-349.) reported that rainfall intensifies decomposition of organic matter, increasing the availability of N.
The contents of N and P showed that only one species was responsible for the highest contents of these nutrients: Guapira oposita for N and Pilocarpus spicatus for P (Figure 2A and B). For K, Ca and Mg the species were grouped and more than one species was responsible for the high contents of these nutrients (Figure 2C, D and E). The species' strategies for nutrient uptake may be different depending on site characteristics (Espig et al., 2008Espig SA, Freire FJ, Marangon LC, Ferreira RLC, Freire MBGS & Espig DB (2008) Composição e eficiência da utilização biológica de nutrientes em fragmento de Mata Atlântica em Pernambuco. Ciência Florestal, 18:307-314.), in addition to their specific genetic abilities (Jewell et al., 2016Jewell MD, Shipley B, Low-Décarie E, Tobner CM, Paquette A, Messier C & Reich PB (2016) Partitioning the effect of composition and diversity of tree communities on leaf litter decomposition and soil respiration. Oikos, 126:01-13.). Therefore, it is suggested that these species have similar functional strategies for K, Ca and Mg absorption, considering the low levels of these nutrients in the soil (Table 1), a common feature in tropical soils with low natural fertility (Santana & Souto, 2011Santana JAS & Souto JS (2011) Produção de serapilheira na Caatinga da região semi-árida do Rio Grande do Norte, Brasil. Idesia, 29:87-94.). This did not occur with the contents of P and K, where only one species stood out for P and another for K.
The P and K contents of the species in this study are lower than the proposed by Faquin (2002Faquin V (2002) Diagnose do estado nutricional das plantas. Lavras, UFLA/FAEPE. 77p.) for forest essences. Santos et al. (2015Santos RL, Freire FJ, Rocha AT, Silva JAA, Tavares JA, Ferreira EGBS & Oliveira ECA (2015) Elephant grass (Pennisetum purpureum Schum.) biomass production as promising alternative source of energy in Brazil’s semiarid area using gypsum. Australian Journal of Crop Science, 9:1082-1088.) evaluated dry forest soil and found little availability of P, evidenced by low contents of P in species. The species presented adequate contents to those suggested by Faquin (2002Faquin V (2002) Diagnose do estado nutricional das plantas. Lavras, UFLA/FAEPE. 77p.) for nutrients Ca and Mg, demonstrating ability to absorb these nutrients.
Pilocarpus spicatus and Guapira oposita presented the largest stocks of nutrients, being responsible for 26 and 42% of the N stock; 36 and 32% of P stock and 41 and 17% of K stock; 40 and 30% of Ca stock and 36 and 33% Mg stock, respectively (Figure 2F, G, H, I and J). This effect was influenced by the high leaf biomass of these species when compared to the other species (Table 3). Other studies in similar forests showed this same behavior (Alves et al., 2017Alves AR, Ferreira RLC, Silva JAA, Dubeux Júnior JCB & Salami G (2017) Nutrientes na biomassa aérea e na serapilheira em áreas de caatinga em Floresta, PE. Pesquisa Florestal Brasileira, 37:413-420.).
Given the expressiveness of nutritional stocks of N, P, K, Ca and Mg of Pilocarpus spicatus and Guapira oposita, it can be inferred that these species are essential for the nutritional balance of this ecosystem. Therefore, any anthropic impacts that may lead to the suppression of these species may pose risks to the entire community of the forest fragment. In addition, species with such characteristics in a tropical dry forest environment can serve as basis for restoration strategies and sustainable forest management plans, which rarely consider the nutritional sustainability of environments in which they are proposing intervention. Considering that they were efficient in the absorption of nutrients, even in adverse conditions (soil naturally poor), being able to contribute with a vegetal material of better nutritional quality when there is foliar abscission.
The nutritional efficiency of the species followed the following decreasing order: P > Mg > K > Ca > N (Figure 2K, L, M, N and O). Guapira oposita was more efficient in the use of K (Figure 2M), demonstrating the relevance of this species to the nutritional sustainability of the forest, and Croton limae was more efficient in the use of Mg (Figure 2O). The species differed little in the use of N, P and Ca (Figure K, L and N). The responsibility for nutritional efficiency was of more than one species. The population should not exhibit evidence of monodominance.
Species that presented lower nutritional contents (Figure 2A, B, C, D and E)) were more efficient in using these nutrients (Figure 2K, L, M, N and O). Content and efficiency present an inverse relationship with the forest type, as verified in studies by Alves et al. (2017Alves AR, Ferreira RLC, Silva JAA, Dubeux Júnior JCB & Salami G (2017) Nutrientes na biomassa aérea e na serapilheira em áreas de caatinga em Floresta, PE. Pesquisa Florestal Brasileira, 37:413-420.), for the dry forest environment, and Espig et al. (2008Espig SA, Freire FJ, Marangon LC, Ferreira RLC, Freire MBGS & Espig DB (2008) Composição e eficiência da utilização biológica de nutrientes em fragmento de Mata Atlântica em Pernambuco. Ciência Florestal, 18:307-314.), for rainforest. Environments with low nutritional availability usually have species with high efficiency of nutrient utilization (Lima et al., 2018Lima RBA, Freire FJ, Marangon LC, Feliciano ALP, Silva RKS, Freire MBGS & Freire CS (2018) Nutritional efficiency of plants as an indicator of forest species for the restoration of forests, Brazil. Scientia Florestalis, 46:415-426.), providing better utilization of soil natural resources.
Nutritional characteristics of tropical rainforest species
The species presented the following decreasing order of nutritional contents: N > K > Ca > Mg > P, similar to that found by Espig et al. (2008Espig SA, Freire FJ, Marangon LC, Ferreira RLC, Freire MBGS & Espig DB (2008) Composição e eficiência da utilização biológica de nutrientes em fragmento de Mata Atlântica em Pernambuco. Ciência Florestal, 18:307-314.), when evaluated the nutrient content in ten species of greater value of importance in the same fragment.
Species presented similar contents of N and P in the tropical rainforest (Figure 3A and B). The high demand of N plants (Kurppa et al., 2010Kurppa M, Leblanc HA & Nygren P (2010) Detection of nitrogen transfer from N2-fixing shade trees to cacao saplings in 15N labelled soil: ecological and experimental considerations. Agroforestry systems, 80:223-239.), as well as the low availability of P in tropical soils (Table 1) may justify this behavior. In this case, there was not a single species responsible for the highest contents of these nutrients. The contents of K and Mg of the Brosimum guianense reaching 49 and 46% of the total contents found, respectively (Figure 3C and E).
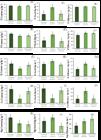
Content (A, B, C, D and E), stock (F, G, H, I and J) and nutritional efficiency (K, L, M, N and O) of N, P, K, Ca and Mg in species of tropical rainforest in Pernambuco, Brazil. Averages represented by the same letter among species do not differ by the Skott-Knott test at 5% probability.
According to Espig et al. (2008Espig SA, Freire FJ, Marangon LC, Ferreira RLC, Freire MBGS & Espig DB (2008) Composição e eficiência da utilização biológica de nutrientes em fragmento de Mata Atlântica em Pernambuco. Ciência Florestal, 18:307-314.), the diversity of species and their diverse nutritional contents provide nutritional sustainability for ecosystems. Species that have higher levels of nutrient storage can help in the demand of those species that are poorly nutritionally efficient, minimizing losses and contributing to the perpetuation of the ecosystem services provided by the forest.
With the exception of Ca, Dialium guianense was the species that most stored nutrients, representing 51, 49, 39 and 45% of N, P, K and Mg, respectively, of the amount stored by the species (Figure 3F, G, H I and J). Leaf biomass of this species was the factor that contributed the most to this result, showing the highest values per individual and per environment (Table 3).
Biomass influences nutritional stocks because it has a direct relationship with nutrients content. In this study, the biomass estimate of Dialuim guianense was higher when compared to the estimated by Espig et al. (2008Espig SA, Freire FJ, Marangon LC, Ferreira RLC, Freire MBGS & Espig DB (2008) Composição e eficiência da utilização biológica de nutrientes em fragmento de Mata Atlântica em Pernambuco. Ciência Florestal, 18:307-314.). Biomass estimation using the equation proposed by Chave et al. (2014Chave J, Réjou-Méchain M, Búrquez A, Chidumayo E, Colgan MS, Delitti WB & Henry M (2014) Improved allometric models to estimate the aboveground biomass of tropical trees. Global Change Biology, 20:3177-3190.) is more judicious than the one by Golley et al. (1978Golley FB, Mcginnis JT & Clements RG (1978) Ciclagem de minerais em um ecossistema de floresta tropical úmida. São Paulo, EPU-EDUSP. 256p.), used in the study by Espig et al. (2008Espig SA, Freire FJ, Marangon LC, Ferreira RLC, Freire MBGS & Espig DB (2008) Composição e eficiência da utilização biológica de nutrientes em fragmento de Mata Atlântica em Pernambuco. Ciência Florestal, 18:307-314.), since it includes more variables in this estimate such as height and basic wood density.
The nutritional utilization efficiency of tropical rainforest species presented differences for K and Ca, with Dialuim guianense showing the best utilization efficiencies for these nutrients (Figure 3K, L, M, N and O). For this reason, Dialuim guianense is presented as the most relevant in nutritional dynamics of this area. Certainly, their nutritional characteristics contribute significantly to the nutritional sustainability of this forest ecosystem, considering their performance linked to its biomass amounts.
Nutritional characteristics of tropical dry and rainforests
Nutritional contents of N and Mg of species in the tropical dry forest were higher than the nutrient contents of the tropical rainforest (Figure 4A and E). However, the P and K contents of species were higher in the rainforest (Figure 4B and C). The Ca content of species was similar in both forests (Figure 4D). The two forests presented the same decreasing order for the nutritional contents in their species: N > K > Ca > Mg > P.

Content (A, B, C, D and E), stock (F, G, H, I and J) and nutritional efficiency (K, L, M, N and O) of N, P, K, Ca and Mg in species of tropical rainforest in Pernambuco, Brazil. Averages represented by the same letter among species do not differ by the Skott-Knott test at 5% probability.
The combined biomasses of tropical rainforest species were around three times higher than the sum of biomasses of tropical dry forest species (Table 3), contributing directly to the higher nutritional stock in that forest (Figure 4F, G, H, I and J), noting that in rainforests there is a greater stock of nutrients stored in its aerial biomass (Lima et al., 2018Lima RBA, Freire FJ, Marangon LC, Feliciano ALP, Silva RKS, Freire MBGS & Freire CS (2018) Nutritional efficiency of plants as an indicator of forest species for the restoration of forests, Brazil. Scientia Florestalis, 46:415-426.). It is noteworthy that in the rainforest we evaluated three species, while in the dry forest we performed evaluations in four species, which corroborates with the differentiation between the foliar biomasses in the two environments when compared. It is necessary to consider that environmental conditions are determinant in both biomass production and nutrient stock.
Tropical dry forest species were more efficient for P and K and less efficient in nutritional utilization of N and Mg than tropical rainforest (Figure 4K, L, M and O). The Ca presented similar results for the two environments (Figure 4N). Although both forests have low soil nutrient contents, especially for P (Table 1). The acidity and nutrient leaching caused by more frequent rainfall in rainforest can justify this lower efficiency. Additionally, in the rainforest, Al contents in the soil were higher (Table 1). It should be emphasized that studies aiming to explain nutritional dynamics between distinct forest environments are rare and important.
The rainforest species presented P and K luxury consumption, even though there were favorable conditions for P fixation and K leaching in this environment. Turner et al. (2018Turner BL, Brenes-Arguedas T & Condit R (2018) Pervasive phosphorus limitation of tree species but not communities in tropical forests. Nature, 555:367-370.) showed that the pervasive species-specific phosphorus limitation does not translate into a community-wide response, because some species grow rapidly on infertile soils despite extremely low phosphorus availability. However, in dry forest species, these same nutrients are the most limiting, showing that only P content in tropical forests should not be primarily responsible for biomass production in these forests. Other indicators are needed, such as increased water availability.
CONCLUSIONS
The species of the rainforest presenting higher efficiency of N and Mg utilization, and dry forest species in the use of P and K. In the dry forest environment, the species Pilocarpus spicatus and Guapira oposita stored larger amounts of nutrients in their biomass. In the rainforest, Dialuim guianese proved to be relevant in the nutritional efficiency of all nutrients. Therefore, these species are essential for the balance of ecosystems and the cycling of nutrients not only due to nutrient utilization, but also because they are dominant in these formations.
ACKNOWLEDGEMENTS
The authors thank the Instituto Agronômico de Pernambuco and the Comando Militar do Nordeste for the study site and CAPES, CNPq and FACEPE for financial support.
REFERENCES
- Albuquerque AS, Freire FJ, Barbosa MD, Marangon LC & Feliciano ALP (2018) Efficiency of biological utilization of micronutrients by forests species in hypoxerophytic Caatinga. Floresta e Ambiente, 25:01-10.
- Alvares CA, Stape JL, Sentelhas PC, Gonçalves JLM & Sparovek G (2013) Köppen’s climate classification map for Brazil. Meteorologische Zeitschrift, 22:711-728.
- Alves AR, Ferreira RLC, Silva JAA, Dubeux Júnior JCB & Salami G (2017) Nutrientes na biomassa aérea e na serapilheira em áreas de caatinga em Floresta, PE. Pesquisa Florestal Brasileira, 37:413-420.
- Barros NF, Novais RF & Carmo DN (1986) Classificação nutricional de sítios florestais - Descrição de uma metodologia. Revista Árvore, 10:112-120.
- Braga JM & Defelipo BV (1974) Determinação espectrofotométrica de fósforo em extrato de solo e material vegetal. Revista Ceres, 21:73-85.
- Brown MB & Forsytre AB (1974) Robust test for equality of variances. Journal of the American Statistical Association, 69:364-367.
- Burger DM & Delitti WBC (2008) Allometric models for estimating the phytomass of a secondary Atlantic Forest area of southeastern Brazil. Biota Neotropica, 8:131-136.
- Cavalcanti ADDC, Rodal MJN, Sampaio EVSB & Costa KCC (2009) Mudanças florísticas e estruturais, após cinco anos, em uma comunidade de Caatinga no estado de Pernambuco, Brasil.Acta Botanica Brasilica, 23:1210-1212.
- CGEE - Centro de Gestão e Estudos Estratégicos (2016) Desertificação, degradação da terra e secas no Brasil. Brasília, CGEE. 252p.
- Chave J, Coomes DA, Jansen S, Lewis SL, Swenson NG & Zanne AE (2009) Towards a worldwide wood economics spectrum. Ecology Letters, 12:351-366.
- Chave J, Réjou-Méchain M, Búrquez A, Chidumayo E, Colgan MS, Delitti WB & Henry M (2014) Improved allometric models to estimate the aboveground biomass of tropical trees. Global Change Biology, 20:3177-3190.
- Chidumayo EN & Gumbo DJJ (2013) The environmental impacts of charcoal production in tropical ecosystems of the world: a synthesis. Energy for Sustainable Development, 17:86-94.
- Cunha APM, Alvalá RC & Oliveira GS (2013) Impactos das mudanças de cobertura vegetal nos processos de superfície na região semiárida do Brasil. Revista Brasileira de Meteorologia, 28:139-152.
- DaSilva MB & Pinto-da-Rocha R (2011) História biogeográfica da Mata Atlântica: opiliões (Arachnida) como modelo para sua inferência. In: Carvalho CJB & EAB Almeida (Eds.) Biogeografia da América do Sul - Padrões & Processos. São Paulo, Roca. p.221-238.
- Espig SA, Freire FJ, Marangon LC, Ferreira RLC, Freire MBGS & Espig DB (2008) Composição e eficiência da utilização biológica de nutrientes em fragmento de Mata Atlântica em Pernambuco. Ciência Florestal, 18:307-314.
- Euclydes RF (2007) SAEG - Sistema para Análises Estatísticas. Versão 9.1. Viçosa, Fundação Arthur Bernardes. CD-ROM.
- Faquin V (2002) Diagnose do estado nutricional das plantas. Lavras, UFLA/FAEPE. 77p.
- Freitas ADS, Sampaio EVSB, Santos CERS & Fernandes AR (2010) Biological nitrogen fixation in tree legumes of the Brazilian semi-arid Caatinga. Journal of Arid Environments, 74:344-349.
- Golley FB, Mcginnis JT & Clements RG (1978) Ciclagem de minerais em um ecossistema de floresta tropical úmida. São Paulo, EPU-EDUSP. 256p.
- IBGE - Instituto Brasileiro de Geografia e Estatística (2012) Manual técnico da vegetação brasileira. Rio de Janeiro, IBGE. 275p.
- Jewell MD, Shipley B, Low-Décarie E, Tobner CM, Paquette A, Messier C & Reich PB (2016) Partitioning the effect of composition and diversity of tree communities on leaf litter decomposition and soil respiration. Oikos, 126:01-13.
- Kurppa M, Leblanc HA & Nygren P (2010) Detection of nitrogen transfer from N2-fixing shade trees to cacao saplings in 15N labelled soil: ecological and experimental considerations. Agroforestry systems, 80:223-239.
- Lima ALA & Rodal MJN (2010) Phenology and wood density of plants growing in the semi-arid region of northeastern Brazil. Journal of Arid Environments , 74:1363-1373.
- Lima ALA, Sampaio EVSB, Castro CC, Rodal MJN, Antonino ACD & Melo AL (2012) Do the phenology and functional stem attributes of woody species allow for the identification of functional groups in the semiarid region of Brazil? Trees, 26:1605-1616.
- Lima RBA, Freire FJ, Marangon LC, Feliciano ALP, Silva RKS, Freire MBGS & Freire CS (2018) Nutritional efficiency of plants as an indicator of forest species for the restoration of forests, Brazil. Scientia Florestalis, 46:415-426.
- Mittermeier RA, Turner WR, Larsen FW, Brooks TM & Gascon C (2011) Global biodiversity conservation: the critical role of hotspots. In: Zachos F & Habel J (Eds.) Biodiversity hotspots Berlin, Springer. p.3-22.
- Mueller-Dombois D & Ellenberg H (1974) Aims and methods of vegetation ecology. New York, John Wiley & Sons. 547p.
- Myers N, Mittermeier RA, Mittermeier CG, Fonseca GA & Kent J (2000) Biodiversity hotspots for conservation priorities. Nature, 403:853-858.
- Quesada M, Sanchez-Azofeifa GA, Alvarez-Añorve M, Stoner KE, Avila-Cabadilla L, Calvo-Alvarado J, Castillo A, Espírito-Santo MM, Fagundes M, Fernandes GW, Gamon J, Lopezaraiza-Mikel M, Lawrense D, Morellato LPC, Powers JS, Neves FS, Rosas-Guerrero V, Sayago R & Sanchez-Montoya G (2009) Succession and management of tropical dry forests in the Americas: Review and new perspectives. Forest Ecology and Management, 258:1014-1024.
- Reboita MS, Gan MA, Rocha RP & Ambrizzi T (2010) Regimes de precipitação na América do Sul: uma revisão bibliográfica. Revista Brasileira de Meteorologia , 25:185-204.
- Santana JAS & Souto JS (2011) Produção de serapilheira na Caatinga da região semi-árida do Rio Grande do Norte, Brasil. Idesia, 29:87-94.
- Santos HG, Jacomine PKT, Anjos LHC, Oliveira VA, Lumbreras JF, Coelho MR, Almeida JA, Cunha TJF & Oliveira JB (2013) Sistema Brasileiro de Classificação de Solos. Rio de Janeiro, Embrapa. 353p.
- Santos RL, Freire FJ, Rocha AT, Silva JAA, Tavares JA, Ferreira EGBS & Oliveira ECA (2015) Elephant grass (Pennisetum purpureum Schum.) biomass production as promising alternative source of energy in Brazil’s semiarid area using gypsum. Australian Journal of Crop Science, 9:1082-1088.
- Shapiro SS & Wilk MB (1965) An analysis of variance test for normality. Biometrika, 52:591-611.
- Silva AMO, Freire FJ, Barbosa MD, Ferreira RLC, Freire MBGS, Alves Junior FT, Freire CS & Silva ACF (2018) Compartmentalization and efficiency biological of nitrogen utilization in dry tropical forest. Revista Brasileira de Ciências Agrárias, 13:e5519.
- Silva GC & Sampaio EVSB (2008) Biomassas de partes aéreas em plantas da Caatinga. Revista Árvore , 32:567-575.
- Silva PCG, Moura MSB, Kiill LHP, Brito LDL, Pereira LA, Sá IB, Correia RC, Teixeira AHC, Cunha TJF & Guimarães Filho C (2010) Caracterização do Semiárido brasileiro: fatores naturais e humanos. In: Sá IB & Silva PCG (Eds.) Semiárido brasileiro: pesquisa, desenvolvimento e inovação. Petrolina, Embrapa. p.18-48.
- Siminski A & Fantini AC (2010) A Mata Atlântica cede lugar a outros usos da terra em Santa Catarina, Brasil.Biotemas, 23:51-59.
- Soil Survey Staff (2014) Keys to Soil Taxonomy. Washington, Natural Resources Conservation Service. 372p.
- Stahl J, Ernani PR, Gatiboni LC, Chaves DM & Neves CU (2013) Produção de massa seca e eficiência nutricional de clones de Eucalyptus dunnii e Eucalyptus benthamii em função da adição de doses de fósforo ao solo. Ciência Florestal , 23:287-295.
- Stehmann JR, Forzza RC, Salino A, Sobral M, Costa DP & Kamino LHY (2009) Plantas da Floresta Atlântica. Rio de Janeiro, Instituto de Pesquisas Jardim Botânico do Rio de Janeiro. 516p.
- Tedesco MJ, Volkweiss SJ & Bohnen H (1995) Análises de solo, plantas e outros materiais. 2ª ed. Porto Alegre, UFRGS. 174p.
- Teixeira PC, Donagemma GK, Fontana A & Teixeira WG (2017) Manual de métodos de análise de solos. Rio de Janeiro, Embrapa . 573p.
- Turner BL, Brenes-Arguedas T & Condit R (2018) Pervasive phosphorus limitation of tree species but not communities in tropical forests. Nature, 555:367-370.
-
This work is part of first author’s Masters Dissertation with financial supporting of CAPES, CNPQ and FACEPE.
Publication Dates
-
Publication in this collection
02 Mar 2020 -
Date of issue
Jan-Feb 2020
History
-
Received
23 Mar 2019 -
Accepted
11 Sept 2019


