Abstracts
OBJECTIVE: To develop performance indicators for outsourcing clinical laboratory services, based on information systems and public administrative records. METHODS: In the municipality of Rio de Janeiro, Southern Brazil, the public health laboratory network comprised 33 laboratories with automated equipment (but no integrated information system), 90 primary care units (where sample collection was performed) and 983 employees. Information records were obtained from the administrative records of the Budget Information System for Public Health and the Outpatient and Hospital Information System of the Unified Health System. Performance indicators (production, productivity, usage and costs) were generated from data collected routinely from 2006 to 2008. The variations in production, costs and unit prices for tests were analyzed by Laspeyres and Paasche indices, which specifically measure laboratory activity, and by the Consumer Price Index from the Brazilian Institute of Geography and Statistics. RESULTS: A total of 10,359,111 tests were performed in 2008 (10.6% increase over 2006), and the test/employee ratio grew by 8.6%. The costs of supplies, wages and providers increased by 2.3%, 45.4% and 18.3%, respectively. The laboratory tests per visit and hospitalizations increased by 10% and 20%, respectively. The direct costs totaled R$ 63.2 million in 2008, representing an increase of 22.2% in current values during the period analyzed. The direct costs deflated by the Brazilian National Consumer Price Index (9.5% for the period) showed an 11.6% increase in production volumes. The activity-specific volume index, which considers changes in the mix of tests, showed increases of 18.5% in the test price and 3.1% in the production volume. CONCLUSIONS: The performance indicators, particularly the specific indices for volume and price of activity, constitute a baseline of performance potential for monitoring private laboratories and contractors. The economic performance indicators demonstrated the need for network information system integration prior to an outsourcing decision.
Indicators of Health Services; Laboratories, organization & administration; Automation, Laboratory; Outsourced Services; Clinical Laboratory Information Systems, utilization; Costs and Cost Analysis; Decision Making
OBJETIVO: Elaborar indicadores de desempenho e terceirização em rede de laboratórios clínicos, baseados em sistemas de informações e registros administrativos públicos. MÉTODOS: A rede tinha 33 laboratórios com equipamentos automatizados, mas sem informatização, 90 postos de coleta e 983 funcionários, no município de Rio de Janeiro, RJ. As informações foram obtidas de registros administrativos do Sistema de Informações de Orçamentos Públicos para a Saúde e do Sistema de Informações Ambulatoriais e Hospitalares do Sistema Único de Saúde. Os indicadores (produção, produtividade, utilização e custos) foram elaborados com dados colhidos como rotina de 2006 a 2008. As variações da produção, custos e preços unitários dos testes no período foram analisadas por índices de Laspeyres e de Paasche, específicos para medir a atividade dos laboratórios, e pelo Índice de Preços ao Consumidor Amplo do Instituto Brasileiro de Geografia e Estatística. RESULTADOS: A produção foi de 10.359.111 testes em 2008 (aumento de 10,6% em relação a 2006) e a relação testes/funcionário cresceu 8,6%. As despesas com insumos, salários e prestador conveniado aumentaram, respectivamente 2,3%, 45,4% e 18,3%. Os testes laboratoriais por consulta e internação cresceram 10% e 20%. Os custos diretos totalizaram R$ 63,2 milhões em 2008, com aumento de 22,2% em valores correntes no período. Os custos diretos deflacionados pelo Índice de Preços ao Consumidor Amplo (9,5% para o período) mostram aumento do volume da produção de 11,6%. O índice de volume específico para a atividade, que considera as variações do mix de testes, mostrou aumento de 18,5% no preço unitário do teste e de 3,1% no volume da produção. CONCLUSÕES: Os indicadores, em especial os índices específicos de volume e preços da atividade, constituem uma linha de base de desempenho potencial para acompanhar laboratórios próprios e terceirizados. Os indicadores de desempenho econômicos elaborados mostram a necessidade de informatização da rede, antecedendo a decisão de terceirização.
Indicadores de Serviços; Laboratórios, organização & administração; Automação Laboratorial; Serviços Terceirizados; Sistemas de Informação em Laboratório Clínico, utilização; Custos e Análise de Custo; Tomada de Decisões Gerenciais
OBJETIVO: Elaborar indicadores de desempeño y tercerización en red de laboratorios clínicos, basados en sistemas de informaciones y registros administrativos públicos. MÉTODOS: La red tenía 33 laboratorios con equipos automatizados pero sin informatización, 90 puestos de colecta y 983 funcionarios, en el municipio de Rio de Janeiro, Sureste de Brasil. Se obtuvo las informaciones de registros administrativos del Sistema de Informaciones de Presupuestos Públicos para la Salud y del Sistema de Informaciones de Ambulatorios y Hospitales del Sistema Único de Salud. Los indicadores, de 2006 a 2008, se refieren a la producción, productividad, utilización y costos, elaborados con datos colectados como rutina. Las variaciones de la producción, costos y precios unitarios de las pruebas en el período se analizaron por índices de Laspeyres y de Paasche, específicos para medir la actividad de los laboratorios y por el Índice de Precios al Consumidor Amplio del Instituto Brasileño de Geografía y Estadística. RESULTADOS: La producción fue de 10.359.111 pruebas en 2008 (aumentó en 10,6% con relación a 2006) y la relación pruebas/funcionario creció 8,6%. Los gastos con insumos, salarios y prestamista por convenio aumentaron, respectivamente 2,3%, 45,4% y 18,3%. Las pruebas laboratoriales por consulta e internación crecieron 10% y 20%. Los costos directos totalizaron R$ 63,2 millones en 2008, con aumento de 22,2% en valores actualizados en el período. Los costos directos disminuidos por el dice de Precios al Consumidor Amplio (9,5% para el período) muestran aumento del volumen de la producción de 11,6%. El índice de volumen específico para la actividad, que considera las variaciones de la mezcla de pruebas, mostró aumento de 18,5% en el precio unitario de la prueba y de 3,1% en el volumen de la producción. CONCLUSIONES: Los indicadores, en especial los índices específicos de volumen y precios de la actividad, constituyen una línea de base de desempeño potencial para acompañar laboratorios propios y tercerizados. Los indicadores económicos de desempeño elaborados muestran la necesidad de informatización de la red, antecediendo la decisión de tercerización.
Indicadores de Servicios; Laboratorios, organización & administración; Automatización de Laboratorios; Servicios Externos; Sistemas de Información en Laboratorio Clínico, utilización; Costos y Análisis de Costo; Toma de Decisiones en la Organización
ORIGINAL ARTICLES
Performance indicators and decision making for outsourcing public health laboratory services
Indicadores de desempeño y decisión sobre tercerización en red pública de laboratorios
Maria Angelica Borges dos SantosI; Ricardo Montes de MoraesII; Sonia Regina Lambert PassosIII
INúcleo de Tecnologia e Logística em Saúde. Escola Nacional de Saúde Pública Sergio Arouca. Fundação Oswaldo Cruz (Fiocruz). Rio de Janeiro, RJ, Brasil
IICoordenação de Contas Nacionais. Instituto Brasileiro de Geografia e Estatística. Rio de Janeiro, RJ, Brasil
IIILaboratório de Epidemiologia Clínica. Instituto de Pesquisa Clínica Evandro Chagas. Fiocruz. Rio de Janeiro, RJ, Brasil
Correspondence Correspondence: Maria Angelica Borges dos Santos Escola Nacional de Saúde Pública Sérgio Arouca Av. Brasil 4036 - Sala 902 Manguinhos 21040-210 Rio de Janeiro, RJ, Brasil E-mail: angelicabsantos@ensp.fiocruz.br
ABSTRACT
OBJECTIVE: To develop performance indicators for outsourcing clinical laboratory services, based on information systems and public administrative records.
METHODS: In the municipality of Rio de Janeiro, Southern Brazil, the public health laboratory network comprised 33 laboratories with automated equipment (but no integrated information system), 90 primary care units (where sample collection was performed) and 983 employees. Information records were obtained from the administrative records of the Budget Information System for Public Health and the Outpatient and Hospital Information System of the Unified Health System. Performance indicators (production, productivity, usage and costs) were generated from data collected routinely from 2006 to 2008. The variations in production, costs and unit prices for tests were analyzed by Laspeyres and Paasche indices, which specifically measure laboratory activity, and by the Consumer Price Index from the Brazilian Institute of Geography and Statistics.
RESULTS: A total of 10,359,111 tests were performed in 2008 (10.6% increase over 2006), and the test/employee ratio grew by 8.6%. The costs of supplies, wages and providers increased by 2.3%, 45.4% and 18.3%, respectively. The laboratory tests per visit and hospitalizations increased by 10% and 20%, respectively. The direct costs totaled R$ 63.2 million in 2008, representing an increase of 22.2% in current values during the period analyzed. The direct costs deflated by the Brazilian National Consumer Price Index (9.5% for the period) showed an 11.6% increase in production volumes. The activity-specific volume index, which considers changes in the mix of tests, showed increases of 18.5% in the test price and 3.1% in the production volume.
CONCLUSIONS: The performance indicators, particularly the specific indices for volume and price of activity, constitute a baseline of performance potential for monitoring private laboratories and contractors. The economic performance indicators demonstrated the need for network information system integration prior to an outsourcing decision.
Descriptors: Indicators of Health Services. Laboratories, organization & administration. Automation, Laboratory. Outsourced Services. Clinical Laboratory Information Systems, utilization. Costs and Cost Analysis. Decision Making, Organizational.
RESUMEN
OBJETIVO: Elaborar indicadores de desempeño y tercerización en red de laboratorios clínicos, basados en sistemas de informaciones y registros administrativos públicos.
MÉTODOS: La red tenía 33 laboratorios con equipos automatizados pero sin informatización, 90 puestos de colecta y 983 funcionarios, en el municipio de Rio de Janeiro, Sureste de Brasil. Se obtuvo las informaciones de registros administrativos del Sistema de Informaciones de Presupuestos Públicos para la Salud y del Sistema de Informaciones de Ambulatorios y Hospitales del Sistema Único de Salud. Los indicadores, de 2006 a 2008, se refieren a la producción, productividad, utilización y costos, elaborados con datos colectados como rutina. Las variaciones de la producción, costos y precios unitarios de las pruebas en el período se analizaron por índices de Laspeyres y de Paasche, específicos para medir la actividad de los laboratorios y por el Índice de Precios al Consumidor Amplio del Instituto Brasileño de Geografía y Estadística.
RESULTADOS: La producción fue de 10.359.111 pruebas en 2008 (aumentó en 10,6% con relación a 2006) y la relación pruebas/funcionario creció 8,6%. Los gastos con insumos, salarios y prestamista por convenio aumentaron, respectivamente 2,3%, 45,4% y 18,3%. Las pruebas laboratoriales por consulta e internación crecieron 10% y 20%. Los costos directos totalizaron R$ 63,2 millones en 2008, con aumento de 22,2% en valores actualizados en el período. Los costos directos disminuidos por el dice de Precios al Consumidor Amplio (9,5% para el período) muestran aumento del volumen de la producción de 11,6%. El índice de volumen específico para la actividad, que considera las variaciones de la mezcla de pruebas, mostró aumento de 18,5% en el precio unitario de la prueba y de 3,1% en el volumen de la producción.
CONCLUSIONES: Los indicadores, en especial los índices específicos de volumen y precios de la actividad, constituyen una línea de base de desempeño potencial para acompañar laboratorios propios y tercerizados. Los indicadores económicos de desempeño elaborados muestran la necesidad de informatización de la red, antecediendo la decisión de tercerización.
Descriptores: Indicadores de Servicios. Laboratorios, organización & administración. Automatización de Laboratorios. Servicios Externos. Sistemas de Información en Laboratorio Clínico, utilización. Costos y Análisis de Costo. Toma de Decisiones en la Organización.
INTRODUCTION
Clinical analysis, following a general trend in medical diagnostics, is increasingly gaining attention as an economic activity in the health care sector. The Sistema de Informações Ambulatoriais do Sistema Único de Saúde (SIA/SUS - Outpatient Information System of the Unified Health System) database shows that diagnostic procedures in clinical laboratories were responsible for R$ 1.8 billion in federal spending by SUS in 2009. More than R$ 1 billion were spent in public clinical laboratories. Due to the constant need for investment and technological upgrades, clinical diagnostic laboratories need to improve operations, monitor quality and efficiency,9 reduce costs and optimize production to ensure profitability in the private sector and sustainability in the public sector.4 The scale of test production is considered to be a prerequisite for economic viability. Thus, the market has seen increasing competition, corporate mergers and acquisitions,6 and pressure for outsourcing these services in the private sector and, more recently, in SUS.
Assessment of productivity, budget definitions, technological resources4 and decisions on outsourcing - whether to "make or buy" these services - increasingly require the use of performance indicators.21 Lack of information on costs, volume and quality jeopardizes administrative decisions and monitoring of contracts, thus increasing outsourcing costs.2
Although the use of performance indicators has been increasing in private laboratories,ª a Gonçalves R, Barros PP. Economies of scale and scope in the provision of diagnostic techniques and therapeutic services in Portuguese hospitals. Porto: Faculdade de Economia e Gestão da Universidade Católica Portuguesa; 2009. (Documentos de Trabalho em Economia, 4). only a few laboratories in Brazil regularly monitor economic and financial indicators.15 In public clinical laboratories, activities are monitored by the traditional methods of counting the number of tests performed,1 internal controls and external quality evaluation focused on laboratory analytical processes, which are best understood by professionals.
Data collection involved in the development of performance indicators demands organizational resources and is especially hard for public health laboratories, in which integrated information systems are rare. It is therefore desirable to develop approaches for creating economic-financial indicators using existing information, without requiring changes in the existing record information system.14
This study describes performance indicators5,19,21 designed to monitor the activities of a municipal clinical laboratory network that does not have an integrated information system; these indicators can also be useful in analyzing and monitoring proposals for outsourcing. The performance indicators use information available in municipal administrative records of the Sistema de Informações de Orçamentos Públicos para a Saúde (SIOPS - Budget Information System for Public Health), the SIA/SUS and the Hospital Sistema de Informações Hospitalares do SUS (SIH/SUS -Information System of the Unified Health System).
The availability of detailed information on the costs of staff, supplies and ancillary services (inputs) and information on volume produced, defined as the number and mix of tests (outputs), enables the elaboration of price and volume indices that are specific for each activity.22 These indices allow for economic and financial analyses that are more appropriate than analyses traditionally obtained by deflating costs using a total economy price index.
Volume and price indices are used to track changes in economic activities in the System of National Accounts, 22 and to monitor outsourced health care services in New Zealand2 and productivity in United Kingdom's National Health Services (NHS). NHS had specific indices for 2,061 health care activities between 2003 and 2004.5 The U.S. Bureau of Economic Analyses also studied the implementation of specific activity indices for health care.3
The use of performance indicators to assess Brazilian public health organizations is rare. There is a growing trend toward outsourcing clinical laboratory analysis in SUS unmatched by proposals for performance evaluation in both the public network and third-party laboratories. Thus, the objective of this study was to develop performance indicators for the laboratory network and to discuss the importance of using specific indices in addition to the implications of outsourcing and other management strategies.
METHODS
The present study is a service evaluation for management and decision making.16 The Rio de Janeiro network of clinical laboratories assessed is one of the largest public networks of clinical analysis laboratories and the second largest public producer of clinical pathology tests in southeastern Brazil. It comprises 33 laboratories (21 hospitals and 12 outpatient clinics) and 90 primary care units for sample collection, which account for half of the outpatient clinical pathology tests of the SUS in the municipality. The network offers 170 different laboratory tests in 8 major specialties (hematology, biochemistry, microbiology, immunology, hormones, tumor markers, urine and blood gases) and has automated analytical equipment that is compatible with the size of each laboratory; however, there is no integrated laboratory information system.
The following indicators were generated for the period between 2006 and 2008: (a) production indicators, which express the qualitative and quantitative characteristics of the products generated (outputs); (b) labor productivity indicators, which express the efficiency of labor activity;21 (c) utilization indicators, which express trends in the use of products; (d) cost and price indicators, which capture the mobilization of financial resources to enable productive activity (inputs); and (e) indices that reflect the volume and prices specific for this laboratory network activity. The definitions, calculation methods and data sources are described below.
Production indicators
Tests produced - total. The total number of tests among hospitalized patients; both emergency and outpatient services. The data were obtained from reports on the number of tests, per type of test, sent by the laboratories in the network to the central agency.
Tests produced - outpatient. Number of "Procedures presented" to group 11 (Clinical Pathology) in SIA/SUS by local health units. Losses, routine equipment calibration tests and test repetitions were not computed.
Tests produced - hospital. The difference between the total number of tests and the number of outpatient tests produced.
Productivity indicators
Clinical Analysis Staff: The total number of staff directly employed in the clinical laboratories. The information was obtained from the Human Resources Department of the Municipal Secretary of Health (SMS).
Test per employee/year: The ratio of the total number of tests and the number of staff working in the laboratory network.
Test/paid work hour: The test per employee/year indicator divided by the average number of annual paid work hours per employee (1,644 hours/year).
Utilization indicators
Tests/visits ratio: Indicates trends in the demand for laboratory tests in the visits conducted by the health care units. The ratio is obtained by calculating the "total number of procedures" (tests) presented annually in group 11 (Clinical Pathology) divided by the total number of visits conducted by the municipal health care units. The number of visits was obtained from the total number of procedures presented in Group 2 (Basic Medical Procedures) plus the number of procedures selected during the visit (0701202-0703101) in Group 7 (Specialized Procedures of Medical Professionals and other Technical Professionals) of SIA/SUS.
Tests/SUS admission ratio: Indicates the use of tests during hospitalization. This ratio is obtained by subtracting the number of outpatient tests from the total number of tests, for each year analyzed. The total number of annual admissions in the municipal health care units was obtained in SIH/SUS.
Cost indicators
Staff Costs: Salary and benefits for all employees in the clinical laboratories network of the SMS, represented by the ratio between the annual "Actual expenditures" of the "Direct administration-health" for "Personnel and benefits. Direct application" of the SIOPS and the total number of SMS staff, multiplied by the number of staff in Clinical Analysis for the reference years (data provided by the SMS Human Resource Department). "Actual expenditures" comprise debts recognized by the public administration following the delivery of a service or supply of goods.
Supplies costs: Equipment leases and kits for testing. Obtained as the "Total amount paid" for "Materials and biological and laboratory products," collected in the expenditures tracking system of the municipality for 2006, and as "Actual expenditures" obtained from the "Direct administration-health" for "Laboratory materials" in the SIOPS for 2007.
Provider contractor expense: Amount paid to the provider to perform tests that are not offered by the clinical laboratory network. Corresponds to the "Amount Paid" to the provider, recorded in SIA/SUS and collected on the website of the State Department of Health
Direct cost: The sum of personnel, supplies and contracted provider expenditures.
Unit price of the test in current values: The direct cost divided by the total number of tests. This price does not consider variations in the mix of tests.
SUS value per test: The average amount paid by the federal SUS per test performed. The total amount paid is divided by the number of tests shown for Group 11 (Clinical Pathology) of the SIA/SUS (until 2007).
Composite indices for activities
Volume index
Changes in volume allow for the monitoring of production growth, considering the changes in the number and specialty of tests performed (mix of tests).
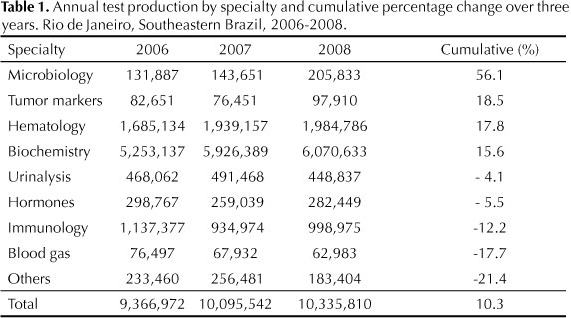
Volume indices were calculated as Laspeyres indices22 from the production data disaggregated by specialty (Table 1) and the percentage share of each specialty in the production costs (Table 2) for the years studied. Costs for staff and third party services (contracted provider), which comprise the other portions of the total direct cost, were assumed to have similar cost distributions among the specialties as were supplies costs.5
The Laspeyres index is a weighted arithmetic mean, in this case, by the specialties of the tests, using as weights the prices (costs) for prior periods. The volume change (Lq) in year t shows the growth from year t-1 to year t and uses prices (p) in year t-1 as weights.

Price indices capture changes in prices (costs) that do not arise from change in volume. These prices were calculated as Paasche indices.5, 22 The price index (Pp) in year t is calculated as the ratio between the change in value, which in this study is equivalent to the cost, and volume change.

The analyses performed included:
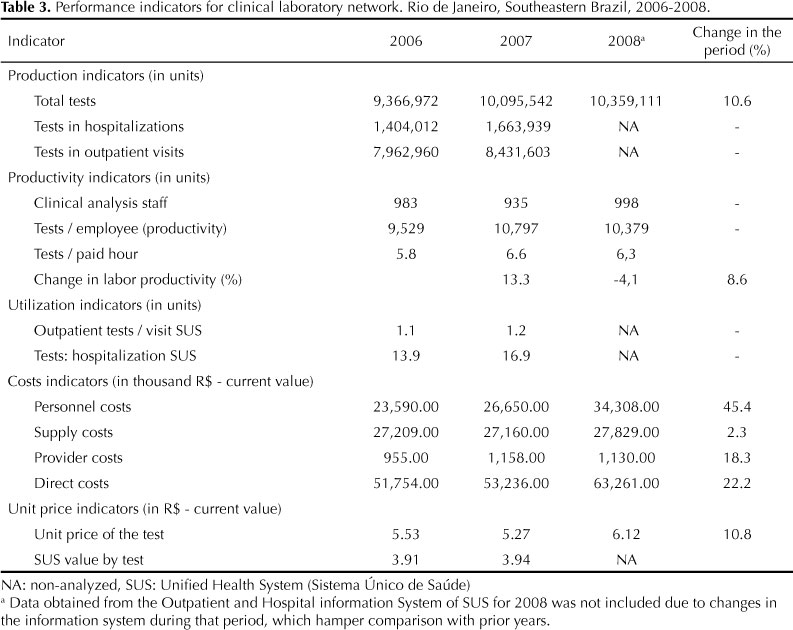
(a) Changes in labor productivity and participation of three expense items - personnel, supplies and provider - in total costs between 2006 and 2008 (Table 3).
(b) Production costs and test unit prices in 2006 and accumulated changes for the period between 2006 and 2008, deflated by the consumer price index reported by the Brazilian Institute of Geography and Statistics (IPCA/IBGE) and by the price index specific for each activity calculated in the study (Table 4).
RESULTS
The number of tests performed increased by 10.6% between 2006 and 2008. The largest variations in the number of tests performed among specialties occurred in microbiology, hematology and tumor markers. The smallest variations occurred in the specialties of gas analysis, immunology and others (Table 1).
Immunology tests accounted for more than a third of the supplies costs, even though on average, the number of immunology tests represents one-tenth of the total number of tests performed during the period analyzed. Biochemistry, representing less than 60% of the total number of tests performed (Table 1), accounted for 14% to 16% of the total supplies costs (Table 2). This percentage determines the different weights of these specialties in the volume (mix) of tests.
Table 3 shows the 22.2% increase in the total cost of the clinical laboratory services network in current values between 2006 and 2008. Although the number of tests increased by 7.8% in 2007 compared with 2006 (Table 4), the number of tests performed in specialties with greater weight in terms of costs (immunology, hormones, blood gas analysis and tumor markers) decreased and this is reflected in the negative volume variation (-2.3%) (quantity weighted by the cost participation of different types of tests) for that year (Table 4).
Utilization indicators show a 10% increase in the number of tests requested by outpatient units per visit as well as a slightly over 20% increase in the number of tests per admission between 2006 and 2007. A comparison with the 2008 data was not possible due to changes in the Datasus coding procedures. The test unit cost in current values was 41.4% (2006) and was 33.8% (in 2007) higher than the SUS value for the years studied (Table 3).
There was an increase in the test/employee per year ratio (productivity) between 2006 and 2007, followed by a decrease in 2008. Nevertheless, an increase of 8.6% in labor productivity was observed between 2006 and 2008. The maximum annual labor productivity during the period analyzed was 10,797 tests per employee in 2007, ranging between 5.8 and 6.6 tests per hour paid during that period (Table 3).
There was an increase in personnel expenditures. In contrast to the 2.3% increase in supply costs, staff costs increased by 45.4%. In 2006, personnel costs accounted for 45.6% of the total direct costs and, in 2008, for 54.2% of this cost (Table 3).
The deflation of production costs by the IPCA to correct for the effect of inflation resulted in an average change of 9.5% in consumer prices during the period analyzed. Use of IPCA showed an increase in of 11.6% in production volume during the study period. The indices that were specifically calculated to measure the activity of the clinical laboratory network, considering the actual variation of prices and volume (mix of test), showed increases of 18.5% of the unit prices of the tests and 3.1% in the production volume (Table 4).
DISCUSSION
The present study showed the feasibility of monitoring a large public health laboratory that lacked an integrated information system using performance indicators. The use of administrative records, SIOPS20, 25 and specific price and volume indices to monitor health care services is still not common practice in Brazil.
The number of tests performed and the installed capacity of the clinical laboratory network were equivalent to those reported for some large private national laboratories. However, only 10% of the test types performed in private laboratories are available in the public sector. The direct costs of clinical analyses accounted for 2.9% of the total costs for the health of the municipality recorded in SIOPS for 2008, lower than the costs in this area cited in the literature.7
Questions referring to the productivity and efficiency of the public sector have been used as arguments to expand outsourcing.11 The labor productivity ranging from 5.8 to 6.6 tests per paid hour in the laboratory network is similar to the numbers reported in nationalb b Cussiol AK. O impacto da tecnologia da informação sobre os indicadores de desempenho, qualidade e econômicos de um laboratório clínico de médio porte [master's dissertation]. Campinas: Faculdade de Ciências Médicas da UNICAMP; 2009. ,c c Diagnósticos da América S.A. Dados econômico-financeiros [press release]. Resultado do segundo trimestre de 2010. [cited 2011 Jan 2]. Available from: http://siteempresas.bovespa.com.br/consbov/ExibeTodosDocumentosCVM.asp?CNPJ=61.486.650/0001-83&CCVM=19623&TipoDoc=C&QtLinks=10 (5 to 14 tests per paid hour) and international studies.8,17,23 The assessed municipal network productivity is even more relevant when considering the lack of an integrated information system and the recognized influence of integration and automation on productivity.18, 26
Productivity varies among distinct laboratory sectors, such as reception, sample collection and analysis, due to the automation of analytical processes, which are growing in this sector. Cussiolb b Cussiol AK. O impacto da tecnologia da informação sobre os indicadores de desempenho, qualidade e econômicos de um laboratório clínico de médio porte [master's dissertation]. Campinas: Faculdade de Ciências Médicas da UNICAMP; 2009. (2009) showed in a private hospital laboratory that productivity was approximately 3.5 times higher for the analysis sector when compared with other sectors. The implementation of an integrated information system in the laboratory doubled the productivity, reaching 11,845 tests / year.
Valenstein et al23 (2003) analyzed 255 U.S. hospital and non-hospital laboratories and reported a productivity ranging from 9.3 to 14.6 tests per paid hour. In a study by Garcia Salas et al17 (2008), which considered only analytical work, the tests per paid hour ranged from 18.8 to 34.8.
In addition to the degree of automation and information systems integration, the analysis of labor productivity should also consider the complexity and the regimes of operation (emergency or routine), the availability of supplies and the budget.23 Specifically, in the public sector, labor productivity may not measure performance relative to unrationed demand21 if limited, for example, by the availability of supplies.
The stability of supplies costs often reflects budget constraints or delays in the procurement process, which act as productivity-limiting factors. The proper fit between supplies availability, labor effort and installed capacity increases efficiency. Public organizations often have low flexibility in changing these parameters, and this fact is emphasized by the proponents of outsourcing public services.11
The increase in supplies expenditures in current values (2.5%) was lower than the increase in the volume of production (3.1%), suggesting efficiency gains in the procurement process. The increase in direct laboratory costs and unit price of tests was mainly due to atypical expenditures on personnel, related to wage increases that were well above the total economy averages for the period.
The detection of the influences of production volume changes, particularly variations in test mix, on laboratories costs is a constant challenge.4,13 France et al.7 (2003) suggested adding the indicator "percentage of specialized tests" to monitor the amount of testing performed. However, this strategy does not provide indices that allow comparing volume changes over time or correlations with costs.
One of the novelties of the present study is the use of specific volume and price indices that allow comparisons over time. For most cost analyses, disaggregated information on production volume is not available and analyses rely on information on total values for successive periods.. Thus, in cost analyses one traditionally deflates total costs using a general price index of the economy, such as the IPCA-IBGE or the General Price Index (Índice Geral de Preços).
However, when detailed information on input prices and production volume (outputs) for an activity is available, it is possible to produce specific price and volume indices. These indices should be preferred because they take into account changes in the mix of products.5 Analyses performed using general economy price indices and specific indices for the activity can lead to vastly different conclusions. Accordingly, several countries are interested in improving price and volume indices for a growing number of specific health-related activities.5
The change in the unit price of the test measured at current prices or based on IPCA values underestimated the rise in prices. The deflation reported by IPCA overestimated the increase in production volume . It implicitly assumes that prices increase at the identical rates in the economy and does not consider the relative reduction of the complexity of the product mix along the period.
The test/visit and test/hospitalization ratios increased between 2006 and 2007, suggesting greater capacity for absorbing the demand in the laboratory network and growth in the number of tests requested. Utilization indicators, whose potential impact on costs is emphasized in the literature, 24 are important for planning the provision of tests and managing the use of tests.12 The outsourcing of clinical laboratory services is growing, and the requirement of scale to ensure business viability can be a powerful incentive for pushing the expansion of use.
Additional factors to consider in making decisions about outsourcing include: the significant scale and reduced scope of test production favor efficient operation and can support the option to invest in the network;ª a Gonçalves R, Barros PP. Economies of scale and scope in the provision of diagnostic techniques and therapeutic services in Portuguese hospitals. Porto: Faculdade de Economia e Gestão da Universidade Católica Portuguesa; 2009. (Documentos de Trabalho em Economia, 4). the knowledge already accumulated in the technical field that may be lost by outsourcing;11 and the fact that there are approximately one thousand public employees in the network. According to Brazilian public administration laws, most of them could not be moved to another activity.
The differences in the mix of tests, cost definitions and methods of calculating cost, which may or may not include the depreciation and indirect costs, make the comparisons between the present results and data reported in other studies impossible.8-10
The indirect costs, which were not included in the evaluation of the laboratory network, accounted for 20% of the total costs in a large business group operating in the countryC in 2010. In many outsourcing contracts for clinical analysis testing by SUS, service providers carry out their activities in public facilities. Thus, the indirect costs remain the responsibility of public management, which reinforces the option to use the direct cost proposed in this work.
Limitations inherent in the proposed set of indicators include the lack of sufficient data to analyze trends and their focus on activities and use of resources.
A more robust system for measuring performance would include indicators that allow the monitoring of the quality of the pre- and post-analytical processes 19 in addition to indicators measuring the health outcomes of patients, such as turnaround time of results, appropriateness of requested tests24 and customer satisfaction.19 The international discussion on the methods to measure the volume and performance in public health has already begun to incorporate quality and outcome indicators.5,21
In conclusion, performance and the current production scale of the laboratory network do not recommend an immediate decision to outsource. However, prices increased above the levels recorded for the general economy in the analysis using specific indices for price and volume. These increases were strongly based on wage increases that were well above the average for the economy, which are not usual in the municipal public service. The average unit cost of a test remained close to the values reported by SUS. Thus, there is reason to believe that an integration of information systems and other streamlining management solutions can reduce the average unit test cost.
Indicators provide a baseline for cost and performance that may be useful for formulating and monitoring the contracts in cases of outsourcing. To optimize public administration expenditures, it is important to monitor changes in the mix of tests as well as costs using specific volume and price indices , especially when contracts are settled with global budgets.
Ideally, benchmarking the economic-financial indicators8 among public laboratories should be established to generate standardized evaluations of performance and costs in public administration and to enable evidence-based management decisions.
REFERENCES
Received: 2/7/2011
Approved: 12/7/2011
Passos SRL was funded by the Carlos Chagas Filho Foundation for Research Support (FAPERJ - Case No. E26/101-511/2010; scholarship).
Paper based on the doctoral thesis of MAB Santos submitted to the Escola Nacional de Saúde Pública Sergio Arouca, FIOCRUZ, in 2012.
The authors declare no conflicts of interests.
- 1. Antunes CMF, Chiari CA, Lucena BNC. Laboratórios de análises e patologia clínica em Belo Horizonte, MG (Brasil): classificação quanto ao atendimento e exames realizados. Rev Saude Publica. 1985;19(1):79-87. DOI:10.1590/S0034-89101985000100009
- 2. Ashton T, Cumming J, McLean J. Contracting for health services in a public health system: the New Zealand experience. Health Policy 2004;69(1):21-31. DOI:10.1016/j.healthpol.2003.11.004
- 3. Aizcorbe A, Nestoriak N. Changing mix of medical care services: stylized facts and implications for price indexes. J Health Econ 2011;30(3):568-74. DOI:10.1016/j.jhealeco.2011.04.002
- 4. Caballe Martin, I. La necesidad de asignar costes en el laboratorio clinico. Quim Clin 2004;23(6):423-8.
- 5. Castelli A, Dawson D, Gravelle H, Jacobs R, Kind P, Loveridge P, et al. A new approach to measuring health system output and productivity. Natl Inst Econ Rev 2007;200(1):105-17. DOI:10.1177/0027950107080395
- 6. Cavalcanti RLS. Globalização na área de saúde: os processos de aquisição e fusão dos laboratórios de análises clínicas e sua implantação. Rio de Janeiro: Qualitymark; 2005.
- 7. France NC, Francis GAJ, Laurence SR. The costs of New Zealand pathology. Health Policy 2003:64(2):131-41.
- 8. France NC, Francis GAJ. Cross-laboratory benchmarking in pathology: scientific management or the art of compromise. Benchmarking Int J 2005;12(6):523-38. DOI:10.1108/14635770510628663
- 9. Galloway M, Nadin L. Benchmarking and the laboratory. J Clin Pathol 2001;54(8):590-7. DOI:10.1136/jcp.54.8.590
- 10. Grzybicki DM, Raab SS. Measuring health care performance: identification and standardization of laboratory quality indicators. Am J Clin Pathol 2006:126(Suppl 1):S48-52. DOI:10.1309/A68D7YJB2LMLBPJJ
- 11. Jensen PH, Stonecash RE. Incentives and the efficiency of public sector-outsourcing contracts. J Econ Surv 2005;19(5):767-87. DOI:10.1111/j.0950-0804.2005.00267.x
- 12. Kim JY, Dzik WH, Dighe AS, Lewandrovski KB. Utilization management in a large urban academic medical center: a ten year experience. Am J Clin Pathol 2011;135(1):8-18. DOI:10.1309/AJCP4GS7KSBDBACF
- 13. Mayer M. Laboratory cost control and financial management software. Clin Chim Acta 1998;270(1):55-64. DOI:10.1016/S0009-8981(97)00235-0
- 14. Luque CA, Cruz HN, Amaral CM, Bender S, Santos PM. O processo orçamentário e a apuração de custos de produtos e serviços no setor público no Brasil. Rev Serv Publico 2008;59(3):309-31.
- 15. Mungol KCU, Ferraz MB. Sistema de informação como ferramenta de cálculo e gestão de custos em laboratórios de análises clínicas. J Bras Patol Med Lab 2006;42(2):95-102. DOI:10.1590/S1676-24442006000200006
- 16. Novaes HMD. Avaliação de programas, serviços e tecnologias em saúde. Rev Saude Publica 2000;34(5):547-9. DOI:10.1590/S0034-89102000000500018
- 17. Salas Garcia A, Villaplana Perez C, Calderón Ruiz A, Gimeno Bosch C, Perez Jove J, Sevillano Herrada C, et al. Benchmarking and clinical quality management indicators in three clinical laboratories. Accred Qual Assur 2008;13(3):123-32. DOI:10.1007/s00769-008-0365-y
- 18. Sarkozi L, Simson E, Ramanathan L. The effects of total laboratory automation on the management of a clinical chemistry laboratory: retrospective analysis of 36 years. Clin Chim Acta 2003;329(1-2):89-94. DOI:10.1016/S0009-8981(03)00020-2
- 19. Shahangian S, Snyder SR. Laboratory medicine quality indicators. Am J Clin Pathol 2009;131(3):418-31. DOI:10.1309/AJCPJF8JI4ZLDQUE
- 20. Silva KSB, Bezerra AFB, Souza IMC, Gonçalves RF. Conhecimento e uso do Sistema de Informações sobre Orçamentos Públicos em Saúde (SIOPS) pelos gestores municipais, Pernambuco, Brasil. Cad Saude Publica 2010;26(2):373-82. DOI:10.1590/S0102-311X2010000200016
- 21. Stevens PA, Stokes L, O'Mahony M. Metrics, targets and performance. Natl Inst Econ Rev 2006;197(1):80-92. DOI:10.1177/0027950106070037
- 22. United Nations. System of National Accounts 2008. New York; 2009.
- 23. Valenstein PN, Wang E, O'Donohue T. Productivity of Veterans Health Administration Laboratories: a College of American Pathologists Laboratory Management Index Program (LMIP) study. Arch Pathol Lab Med 2003;127(12):1557-64.
- 24. Van Walraven C, Naylor CD. Do we know what inappropriate laboratory utilization is? A systematic review of laboratory clinical audits. JAMA 1998;280(6):550-8. DOI:10.1001/jama.280.6.550
- 25. Vidor AC, Fisher PD, Bordin R. Utilização dos sistemas de informação em saúde em municípios gaúchos de pequeno porte. Rev Saude Publica 2011;45(1):24-30. DOI:10.1590/S0034-89102011000100003
- 26. Workman RD, Lewis MJ, Hill BT. Enhancing the financial performance of a health system laboratory network using an information system. Am J Clin Pathol 2000;114(1):9-15. DOI:10.1309/UQRF-AVN9-5V0Y-DTNK
Publication Dates
-
Publication in this collection
17 Apr 2012 -
Date of issue
June 2012
History
-
Received
07 Feb 2011 -
Accepted
07 Dec 2011