Abstracts
The aim of this article is to identify patterns in spatial distribution of cases of dengue fever that occurred in the municipality of Cruzeiro, State of São Paulo, in 2006. This is an ecological and exploratory study using the tools of spatial analysis in the preparation of thematic maps with data from Sinan-Net. An analysis was made by area, taking as unit the IBGE census, the analysis included four months in 2006 which show the occurrence of the disease in the city. The thematic maps were constructed by TerraView 3.3.1 software, the same software provided the values of the indicators of Global Moran (I M) every month and the Kernel estimation. In the year 2006, 691 cases of dengue were georeferenced (with a rate of 864.2 cases/100,000 inhabitants); the indicators of Moran and p-values obtained were I M = 0.080 (March) p = 0.11; I M = 0.285 (April) p = 0.01; I M = 0.201 (May) p = 0.01 and I M = 0.002 (June) p = 0.57. The first cases were identified in the Northeast and Central areas of Cruzeiro and the recent cases, in the North, Northeast and Central. It was possible to identify census tracts where the epidemic began and how it occurred temporally and spatially in the city.
Dengue; Geographic Information Systems; Epidemiologic surveillance; Ecological studies; Spatial distribution of population
Este artigo tem por objetivo identificar padrões na distribuição espacial dos casos de dengue ocorridos no município de Cruzeiro/SP, no ano de 2006. Trata-se de um estudo ecológico e exploratório que utiliza as ferramentas de análise espacial na elaboração de mapas temáticos, com dados obtidos do SinanNet. Foi feita uma análise por área, tomando-se como unidade o setor censitário do IBGE; a análise considerou quatro meses do ano de 2006 que mostra a ocorrência da doença no município. Os mapas temáticos foram construídos pelo programa computacional TerraView 3.3.1; assim como os valores dos índices de Moran Global (I M) mês a mês e o estimador de Kernel. Foram georreferenciados 691 casos de dengue (taxa de 864,2 casos/100.000 habitantes); os Índices de Moran e p-valores obtidos foram I M = 0,080 (março) p = 0,11; I M = 0,285 (abril) p = 0,01; I M = 0,201 (maio) p = 0,01 e I M = 0,002 (junho) p = 0,57. Os primeiros casos foram identificados na região nordeste e central e os últimos casos, na região norte, nordeste e central. Foi possível identificar os setores censitários onde a epidemia teve início e como ocorreu têmporo-espacialmente no município.
DENGUE
Spatial distribution of dengue in the city of Cruzeiro, São Paulo State, Brazil: use of geoprocessing tools
Distribuição espacial da dengue no município de Cruzeiro, Estado de São Paulo, Brasil: o uso do geoprocessamento
Renata Marzzano de CarvalhoI; Luiz Fernando Costa NascimentoII,III
IDepartamento de Engenharia Mecânica. Faculdade de Engenharia de Guaratinguetá, UNESP, Guaratinguetá, SP, Brazil
IIDepartamento de Medicina, Universidade de Taubaté. Taubaté, SP, Brazil
IIIPrograma de Pós-Graduação em Ciências Ambientais. Universidade de Taubaté
Correspondence to Correspondence to: Luiz Fernando Costa Nascimento Rua Durval Rocha 500, Vila Paraíba 12515-710 Guaratinguetá, SP, Brasil. Tel.: +55.12.3125-1103. E-mail: luiz.nascimento@unitau.br
SUMMARY
The aim of this article is to identify patterns in spatial distribution of cases of dengue fever that occurred in the municipality of Cruzeiro, State of São Paulo, in 2006. This is an ecological and exploratory study using the tools of spatial analysis in the preparation of thematic maps with data from Sinan-Net. An analysis was made by area, taking as unit the IBGE census, the analysis included four months in 2006 which show the occurrence of the disease in the city. The thematic maps were constructed by TerraView 3.3.1 software, the same software provided the values of the indicators of Global Moran (IM) every month and the Kernel estimation. In the year 2006, 691 cases of dengue were georeferenced (with a rate of 864.2 cases/100,000 inhabitants); the indicators of Moran and p-values obtained were IM = 0.080 (March) p = 0.11; IM = 0.285 (April) p = 0.01; IM = 0.201 (May) p = 0.01 and IM = 0.002 (June) p = 0.57. The first cases were identified in the Northeast and Central areas of Cruzeiro and the recent cases, in the North, Northeast and Central. It was possible to identify census tracts where the epidemic began and how it occurred temporally and spatially in the city.
Keywords: Dengue; Geographic Information Systems; Epidemiologic surveillance; Ecological studies; Spatial distribution of population.
RESUMO
Este artigo tem por objetivo identificar padrões na distribuição espacial dos casos de dengue ocorridos no município de Cruzeiro/SP, no ano de 2006. Trata-se de um estudo ecológico e exploratório que utiliza as ferramentas de análise espacial na elaboração de mapas temáticos, com dados obtidos do SinanNet. Foi feita uma análise por área, tomando-se como unidade o setor censitário do IBGE; a análise considerou quatro meses do ano de 2006 que mostra a ocorrência da doença no município. Os mapas temáticos foram construídos pelo programa computacional TerraView 3.3.1; assim como os valores dos índices de Moran Global (IM) mês a mês e o estimador de Kernel. Foram georreferenciados 691 casos de dengue (taxa de 864,2 casos/100.000 habitantes); os Índices de Moran e p-valores obtidos foram IM = 0,080 (março) p = 0,11; IM = 0,285 (abril) p = 0,01; IM = 0,201 (maio) p = 0,01 e IM = 0,002 (junho) p = 0,57. Os primeiros casos foram identificados na região nordeste e central e os últimos casos, na região norte, nordeste e central. Foi possível identificar os setores censitários onde a epidemia teve início e como ocorreu têmporo-espacialmente no município.
INTRODUCTION
The National Department of Health warns: "Dengue is everyone's problem. Combating it is our social obligation, and everyone should do it every day. Embrace this commitment and do your part".
In the 1980s, new cases of dengue were reported in Brazil16, and in the São Paulo State, dengue was included in the list of diseases of compulsory notification in 19865. In 2000, the infestation of Ae. aegypti was detected in the Paraiba Valley, SP, where dengue cases began to be recorded in 2002 in the municipality of Potim, SP20, and where, also, overlap Ae. Albopictus was observed. The same occurred in São Sebastião, in the Paraíba Valley, north coast of São Paulo; this area was affected by a dengue epidemic that began in 2002. The number of cases in the city reached 972 autochthonous contamination18.
The introduction of DEN-1 serotype in São Paulo State occurred in 1987; the DEN-2 and DEN-3 serotypes occurred in 1997 and 2003 respectively; more recently serotype DEN-417 has been diagnosed. Fifty thousand and twenty-two cases were confirmed in 2006 in the São Paulo State (incidence close to 125 cases/100,000 inhabitants)19 and all the cases confirmed in Paraíba Valley were the cases occurred in Cruzeiro.
According to SOUZA-SANTOS & CARVALHO, georeferencing and spatial analysis techniques have been increasingly used to evaluate the distribution of vectors and the diseases they transmit, contributing to the improvement of surveillance and vector controlling actions. Thus, the use of these tools enables the identification of risk areas that require intensification and/or prioritization of control measures21.
Its greatest advantage lies in treating the city as a place composed of various realities, deserving distinct approaches, contrary to what has been seen, in which the proposed action may differ according to the municipalities, but are always uniform everywhere21.
The use of spatial analysis techniques in a study performed in a city of the central region of São Paulo enabled the visualization of areas of clusters of containers with larvae, indicating that this method can be used to improve entomological surveillance activities2. In Niteroi, RJ, a similar strategy was used to identify geographic areas with the highest number of cases8.
The aim of this study is to identify patterns in the spatial and temporal distribution of dengue cases in the city of Cruzeiro in March, April, May and June of 2006 using geoprocessing tools.
METHODS
We outlined an epidemiological study of the ecological and exploratory type. Dengue cases were confirmed by laboratory or clinical-epidemiological criteria, according to guidelines of the National Department of Health13. Information about dengue cases was provided by the technical staff of the Center for Vector Control of the municipality, grouped by month and year of occurrence.
There are 80,000 inhabitants in Cruzeiro and the proportion between genders9 is roughly even. Cruzeiro is situated at the eastern end of São Paulo, in the Paraíba Valley, latitude 22° 33' South and longitude 44º 60' West, at an altitude of 514 meters and covers an area of 331 km², of which 36 km² are of urban area7. The most relevant economical activities are the industry sector, services and commerce; industry is the sector that employs the most (48.8%), especially the metallurgical industries7.
Ninety seven percent of households in Cruzeiro have running water, 94% of households are connected to the sewage system and 97% of the households have regular garbage collection. The local human development index was 0.81 for the year 2000.
Its territorial divisions are: to the north with the municipalities of Passa Quatro and Marmelópolis, Minas Gerais State; to the south with the municipality of Silveiras; to the East with the municipality of Lavrinhas and to the West with the municipalities of Piquete and Cachoeira Paulista, São Paulo State (Fig. 1). The weather is tropical (hot and humid), with temperatures ranging between 20 and 27 Celsius degrees. The hottest months are between November and April and the coldest, between May and October. The rains are more frequent from December to March, with January being the rainiest month. The driest period lasts from June to September. The municipality was built on the margins of the Paraíba do Sul River, which, cuts the city in half, and into which the sanitary sewage is dumped with no treatment.
The cases were investigated in Cruzeiro, according to the date of appearance of first symptoms, determining address and occurrence in the city map according to the 96 urban census tracts existing in 2000, supplied by IBGE, in order to determine the location and date of the start of the epidemic.
From a cartographic database in digital format, obtained from IBGE, georeferenced in the Cartesian system, containing designs of the city's census tracts, we inserted the confirmed cases of dengue fever which occurred in the municipality and mapped the incidence of dengue in 2006.
To identify the presence of spatial autocorrelation we used indicators of global Moran (IM)3 which analyze if there are clusters of sectors with higher rates next to clusters of low rates. The IM varies between -1 and +1 and to it can be assigned a level of significance (p-value). The closer to 1 (one), the most similarity between neighbors. The value 0 (zero) indicates no correlation, and negative values indicate dissimilarity14. We used the public domain program TerraView (available at: http://www.inpe.gov.br).
The expression of Moran's coefficient is:

In this equation we have n corresponding to the number of areas (sectors), w(i,j) is equal to the relevance of the neighborhood, X(i) represents the square root of the average incidence rate for municipality i in the studied periods and X refers to the mean of X(i) for the entire studied region.
Among the procedures for estimating density of events, the kernel estimator is the most widely used of them and plays an important role in the epidemiological context to identify the concentration of cases and identify the hot spots4. The kernel estimator is an exploratory interpolation technique that generates a surface density for visual identification of hot spots, and is best used in the analysis by points, but also used in the analysis by area, when it assigns the center of the study area, the location of all events. The kernel estimator produces a continuous density surface calculated in all locations, the researcher does not need to define where to arbitrarily "cut" a "hot area" 12.
Thematic maps were created in this study with the kernel estimator, with dengue cases referring to the months of March, April, May and June of 2006.
RESULTS
Seven hundred and two cases of dengue fever were reported and confirmed in 2006. Six hundred ninety-one cases (98.4%) were georeferenced (with a rate of 864.2 cases/100,000 inhabitants).
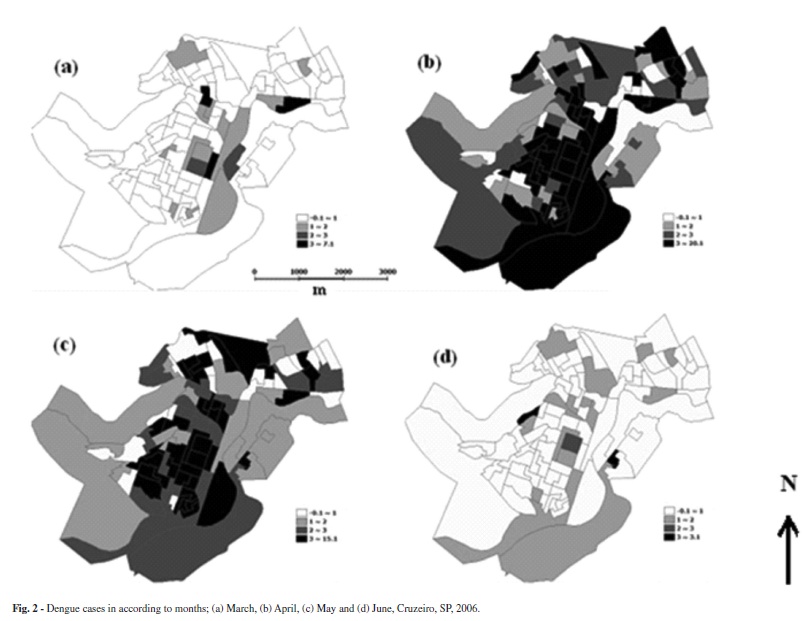
Thematic maps with the distribution of cases (Fig. 2), by the months of 2006, show that the first cases occurred in March, in the North, Northeast and central region, on the banks of Paraíba do Sul River and its tributary, Barrinha stream, also following the path of the railroad that crosses the central region of the city and the road linking the city of Cruzeiro to Lavrinhas. In April, there is the emergence of cases in almost all the census tracts and moving to the south, southeast, central region and northeast. In May, 76 (79%) census tracts had at least one case of dengue, with the largest number of cases in the central, south, southeast and east regions, following the course of the Paraíba do Sul River and Barrinha stream. In June, only two sectors showed three cases, located in the central and south regions.
Moran Indicators and obtained p-values are in Table 1; we can see positive spatial autocorrelation in all the months, but with statistical significance in the months of April and May. The number of cases per month is in Table 1, and the increase in occurrences can be seen in the months of April and May (p < 0.05).
The kernel estimator showed the highest densities of cases in the month of March in central and north regions; in the months of April and May, the highest densities occurred in central and south regions; and in June, the highest densities occurred in central and west (Fig. 3).
DISCUSSION
This is the first study carried out in a municipality of the Paraíba Valley, using the techniques of geoprocessing to study the spatial-temporal distribution of the dengue epidemic, making it possible to identify a pattern of the epidemic. The infestation of Aedes aegypti in the Paraiba Valley began in the city of Potim, around the year 2000. Since 1996, the municipalities already had the plans for the Eradication of Aedes aegypti (PEAa) instituted by the Ministry of Health, performing controlling actions of mosquito infestations, disease prevention, which included the monitoring of traps and strategic places, home visits, and collection of scrap materials. Throughout the process of implementation of this program the mosquito eradication technique was not feasible in the short to medium term. It was necessary to intensify actions to better address the problem and reduce the impact of dengue in Brazil. This plan was abandoned and in 2002 the Plano Nacional de Controle da Dengue-PNCD came into effect.
The epidemic started in the central region, spread to almost all regions of the urban area, following the margins of the Paraíba do Sul river, railroads and roads which cross the municipality and are responsible for the vast movement of people, products and vehicles.
From June there was a decrease in new cases, possibly due to the decrease in the number of susceptible individuals in the region. The municipality intensified vector controlling activities during this period which possibly led to a decrease in the number of breeding. In June, the registered temperatures were milder and humidity is the lowest. This fact strongly suggests that the adverse weather conditions for the proliferation of the vector play an important role in ending the transmission of the disease in the city2.
Just one type of virus circulated in the city (the DEN-3 serotype), which was confirmed by viral isolation performed during the occurrence of the epidemic and, therefore, people became immune after exposure to the virus.
Three factors must be considered in the decrease of the number of cases of an epidemic: the decrease of susceptible individuals; vector controlling interventions and unfavorable natural conditions, such as the reduction of temperature and humidity, reducing the vector population.
The occurrence of dengue was also identified in areas of high concentration of people, great economic diversity, high population density, high residential density. These findings were similar to those found in Niteroi8.
The accelerated growth of the urban population provides a great source of infected and susceptible individuals, concentrated in restricted areas. This fact, associated with poor sanitation conditions, housing and specific cultural factors of large urban centers, provides ecological conditions favor to the transmission of dengue virus11.
The Moran Indicators obtained during March, April and May showed positive values, indicative of positive spatial autocorrelation. The values tend to be similar to neighboring sectors, indicating that the occurrence of dengue cases in the city is connected, there being a strong relationship between the sectors, and is even stronger among the sectors, closest neighbors. The index showed significant positive spatial correlation for the months of April and May 2006.
The kernel estimator presented a hot spot in the central area in March, while in the following months the highest concentration of cases spread to other non-central areas of the city, probably due to decrease of the number of susceptible individuals in these sectors, and also due to late diagnosis and the natural development of the disease. The central area should be prioritized in the planning of actions in order to control Aedes aegypti breeding sites and disease prevention.
The measures of combating dengue have been based only in the chemical vector control at the expense of important factors that modulate the dynamics of disease transmission, especially those related to social determinants, such as spatial occupation and living conditions. Thus, for each introduction of a new serotype a new epidemic occurs8.
Therefore, it is understandable that cities with larger proportion of urban population can present higher incidence of dengue, because urban growth provides an increase in the number of infected and susceptible individuals concentrated in restricted areas, as shown in a study conducted in São José do Rio Preto6.
It is important that the spatial relationship between dengue transmission and other variables is checked, as the degree of immunity of population, effectiveness of controlling measures, the degree of infestation by the vector, the habits and attitudes of the population, among others. Note that studies with approaches of spatial locations and use of SIG, although recent in the health area, gradually become indispensable for the analysis of the determination of diseases8.
Some limitations of this ecological study can be attributed to working with secondary data developed for the interest of surveillance and not for research, hindering the recovery of some lost information2. In a study conducted in São José do Rio Preto, out of 14,431 autochthonous cases of dengue occurred in the urban area between September 1994 and August 2002, 433 cases (3%) were not goaded due to lack of or inadequate address of the address with the cartographic basis15.
During the epidemical periods there were changes in staff, as well as in the coordination of activities, causing disruption of routine actions.
Therefore, analysis considering patient's address as the site of exposure to the risk factors assume an immobility of individuals and ignore any possibility of exposure in other places, such as working or leisure environment. But we cannot say where these people contracted the disease, because it may have been in their own homes, but also may have been at work, in transit or elsewhere in the city.
As ALMEIDA et al. note1, despite the guidelines of the epidemiological surveillance of dengue in investigating the probable sites of infection considering residence, work and in transit in the investigation form standardized by the National Department of Health, only data concerning the residence address are structured to allow the precise location of a case.
As possible sources of error we can consider the clinical-epidemiological character of the criteria for completion of the cases in the municipality with fewer than 100,000 inhabitants, after exceeding the limit of 300 confirmed cases the confirmation of the same is made by clinical and epidemiological criterion rather than through a blood test. This condition is used by the Secretary of Health of the State of São Paulo to stop serological tests (Center for Epidemiological Surveillance: unpublished data), the possible underreporting of people who are affected by the milder form of the disease and who may not seek a health unit, and therefore are not reported; other limitations are indeterminate diagnoses and addresses that were not found. Difficulties found in the georeferencing of the reported cases of disease, due to address problems also occurred in other studies1,15 and prevented the location of cases in census tracts.
Although there are the limitations outlined above, this study indicates that a disease like dengue, with vector transmission, whose mosquito usually has a small displacement during its life cycle, the punctual location of the cases or the aggregation of information in small areas such as the census tracts, can be quite enlightening10.
Thus, it was possible, using the technique of geoprocessing, to map the location of housing for those people affected by dengue epidemic that ravaged the city of Cruzeiro in 2006 and show how the disease spread through the city.
The present study responded to the proposed objective, identifying patterns in the spatial and temporal distribution of dengue cases in the city of Cruzeiro during the months of March, April, May and June of 2006, analyzing the information obtained via the Dengue Control Program of the São Paulo State using geoprocessing tools. This information may support health authorities to propose strategies for prevention and control of dengue cases in the city and prevent the outbreak of another epidemic in the coming years.
Received: 15 September 2011
Accepted: 11 May 2012
- 1. Almeida MC, Assunção RM, Proietti FA, Caiaffa WT. Dinâmica intra-urbana das epidemias de dengue em Belo Horizonte, Minas Gerais, Brasil, 1996-2002. Cad Saúde Pública. 2008;24:2385-95.
- 2. Barbosa GL, Lourenço RW. Análise da distribuição espaço-temporal de dengue e da infestação larvária no município de Tupã, Estado de São Paulo. Rev Soc Bras Med Trop. 2010;43:145-51.
- 3. Barcellos C, Santos SM. Colocando dados no mapa: a escolha da unidade de agregação e integração de bases de dados em saúde e ambiente através do geoprocessamento. Inf Epidemiol SUS. 1997;6:21-9.
- 4. Carvalho MS, Pina MF, Santos S. Conceitos básicos de sistemas de informação geográfica e cartografia aplicados à saúde. Brasília: Organização Pan-Americana da Saúde/Ministério da Saúde; 2000.
- 5. Costa AIP. Identificação de unidades ambientais urbanas como condicionantes da ocorrência de Aedes aegypti (Diptera Culicidae) e de dengue na cidade de São José do Rio Preto, S.P., em 1995. [Dissertação]. São Paulo: Universidade de São Paulo, Faculdade de Saúde Pública; 1996.
- 6. Costa AIP, Natal D. Distribuição espacial da dengue e determinantes socioeconômicos em localidade urbana no Sudeste do Brasil. Rev Saúde Pública. 1998;32:232-6.
- 7. Cruzeiro. Prefeitura Municipal. Plano Municipal de Saúde 2010-2013. 49p.
- 8. Flauzino RF, Souza-Santos R, Oliveira RM. Dengue, geoprocessamento e indicadores socioeconômicos e ambientais: um estudo de revisão. Rev Panam Salud Publica. 2009;25:456-61.
-
9Fundação Instituto Brasileiro de Geografia e Estatística. IBGE. Planejamento. Ministério do Planejamento, Orçamento e Gestão. Cidades. Rio de Janeiro, FIBGE, 2000. Available from: http://www.ibge.gov.br/cidadesat/topwindow.htm?1
- 10. Galli B, Chiaravalloti Neto F. Modelo de risco tempo-espacial para identificação de áreas de risco para ocorrência de dengue. Rev Saúde Pública. 2008;42:656-63.
- 11. Gubler DJ, Clark GG. Dengue/dengue hemorrhagic fever: the emergence of a global health problem. Emerg Infect Dis. 1995;1:55-7.
- 12. Levine, N. CrimeStat. II: a spatial statistics program for the analysis of crime incident locations. Ned Levine & Associates, Houston, TX, and the National Institute of Justice. Washington, DC, 2002. Available from: http://www.spatial.cs.umn.edu/Courses/Fall07/8715/papers/IM10_levine.pdf
-
13Ministério da Saúde. Fundação Nacional de Saúde. Manual de dengue: vigilância epidemiológica e atenção ao doente. Brasília: FNS; 1995.
-
14Ministério da Saúde. Secretaria de Vigilância em Saúde. Fundação Oswaldo Cruz. Introdução à estatística espacial para a saúde pública. Brasília; 2007. (Série Capacitação e Atualização em Geoprocessamento em Saúde, v. 3).
- 15. Mondini A, Chiaravalloti Neto F, Gallo Y, Sanches M, Lopes JCC. Análise espacial da transmissão de dengue em cidade de porte médio do interior paulista. Rev Saúde Pública. 2005;39:444-51.
- 16. Pontes RJS, Ruffino-Netto A. Dengue em localidade urbana da região sudeste do Brasil: aspectos epidemiológicos. Rev Saúde Pública. 1994;28:218-27.
- 17. Secretaria da Saúde. Centro de Vigilância Epidemiológica. Dengue. São Paulo; 2011. Available from: http://www.cve.saude.sp.gov.br/htm/zoo/if_sem_den02.htm
- 18. Secretaria de Saúde. Centro de Vigilância Epidemiológica. Dengue. São Paulo, 2011. Available from: http://www.saude.cve.sp.gov.br/htm/cve_dengue.html
- 19. Secretaria de Saúde. Centro de Vigilância Epidemiológica. Dengue. São Paulo, 2011. Available from: http://www.saude.cve.sp.gov.br/htm/zoo/Den_dir06.htm
- 20. Serpa LLN, Costa KVRM, Voltolini JC, Kakitani I. Variação sazonal de Aedes aegypti e Aedes albopictus no município de Potim, São Paulo. Rev Saúde Pública. 2006;40:1101-5.
- 21. Souza-Santos R, Carvalho MS. Análise da distribuição espacial de larvas de Aedes aegypti na Ilha do Governador, Rio de Janeiro, Brasil. Cad Saúde Pública. 2000;16:31-42.
Correspondence to:
Publication Dates
-
Publication in this collection
10 Sept 2012 -
Date of issue
Oct 2012
History
-
Received
15 Sept 2011 -
Accepted
11 May 2012