Abstracts
Land cover changes over time as a result of human activity. Nowadays deforestation may be considered one of the main environmental problems. The objective of this study was to identify and characterize changes to forest cover in Venezuela between 2005-2010. Two maps of deforestation hot spots were generated on the basis of MODIS data, one using digital techniques and the other by means of direct visual interpretation by experts. These maps were validated against Landsat ETM+ images. The accuracy of the map obtained digitally was estimated by means of a confusion matrix. The overall accuracy of the maps obtained digitally was 92.5%. Expert opinions regarding the hot spots permitted the causes of deforestation to be identified. The main processes of deforestation were concentrated to the north of the Orinoco River, where 8.63% of the country's forests are located. In this region, some places registered an average annual forest change rate of between 0.72% and 2.95%, above the forest change rate for the country as a whole (0.61%). The main causes of deforestation for the period evaluated were agricultural and livestock activities (47.9%), particularly family subsistence farming and extensive farming which were carried out in 94% of the identified areas.
Monitoring; land use; land cover change
Cobertura do solo muda ao longo do tempo como resultado da atividade humana. Hoje em dia desmatamento pode ser considerado como um dos principais problemas ambientais. O objetivo deste estudo foi identificar e caracterizar as mudanças de cobertura florestal na Venezuela entre 2005-2010. Dois mapas de hot spots desmatamento foram gerados com base em dados MODIS, um usando técnicas digitais e outros, por meio de interpretação visual direta por especialistas. Estes mapas foram validados contra imagens Landsat ETM +. A exactidão do mapa obtidos digitalmente foi estimada por meio da matriz de confusão. A exatidão global do mapa de hot spots obtido digitalmente foi de 92,5%. Uma análise sobre os hot spots feita por especialistas permitiu identificar as causas do desmatamento. Os principais processos de desmatamento foram concentrados para o norte do rio Orinoco, onde estão localizadas 8,63% das florestas do país. Nesta região, alguns lugares registou uma taxa média anual de mudança de floresta entre 0,72% e 2,95%, acima da taxa de variação da floresta para o país como um todo (0,61%). As principais causas de desmatamento para o período avaliado foram as atividades agrícolas e pecuária (47,9%), a agricultura familiar e a agricultura extensiva, que são realizadas em 94% das áreas identificadas.
Monitoramento; uso do solo; mudança da cobertura do solo
Identification and characterization of deforestation hot spots in Venezuela using MODIS satellite images
Identificação e caracterização dos hot spots do desmatamento na Venezuela a partir de imagens de satélite MODIS
Carlos Eduardo PachecoI, * * Corresponding Author: carlosa@ula.ve ; María Inmaculada AguadoII; Danilo MolliconeIII
IUniversidad de Los Andes. Escuela Técnica Superior Forestal, Facultad de Ciencias Forestales y Ambientales. Vía Chorros de Milla, Conjunto Forestal, 5101. Mérida, Venezuela
IIUniversidad de Alcalá de Henares. Departamento de Geografía, Facultad de Filosofía y Letras. Calle Colegios, 2, 28801, Alcalá de Henares. Madrid, España. inmaculada.aguado@uah.es
IIIUnited Nation Food and Agriculture Organization. Forest Department. Viale Terme di Caracalla, I-00153. Rome, Italy. danilo.mollicone@fao.org
ABSTRACT
Land cover changes over time as a result of human activity. Nowadays deforestation may be considered one of the main environmental problems. The objective of this study was to identify and characterize changes to forest cover in Venezuela between 2005-2010. Two maps of deforestation hot spots were generated on the basis of MODIS data, one using digital techniques and the other by means of direct visual interpretation by experts. These maps were validated against Landsat ETM+ images. The accuracy of the map obtained digitally was estimated by means of a confusion matrix. The overall accuracy of the maps obtained digitally was 92.5%. Expert opinions regarding the hot spots permitted the causes of deforestation to be identified. The main processes of deforestation were concentrated to the north of the Orinoco River, where 8.63% of the country's forests are located. In this region, some places registered an average annual forest change rate of between 0.72% and 2.95%, above the forest change rate for the country as a whole (0.61%). The main causes of deforestation for the period evaluated were agricultural and livestock activities (47.9%), particularly family subsistence farming and extensive farming which were carried out in 94% of the identified areas.
Keywords: Monitoring, land use, land cover change.
RESUMO
Cobertura do solo muda ao longo do tempo como resultado da atividade humana. Hoje em dia desmatamento pode ser considerado como um dos principais problemas ambientais. O objetivo deste estudo foi identificar e caracterizar as mudanças de cobertura florestal na Venezuela entre 2005-2010. Dois mapas de hot spots desmatamento foram gerados com base em dados MODIS, um usando técnicas digitais e outros, por meio de interpretação visual direta por especialistas. Estes mapas foram validados contra imagens Landsat ETM +. A exactidão do mapa obtidos digitalmente foi estimada por meio da matriz de confusão. A exatidão global do mapa de hot spots obtido digitalmente foi de 92,5%. Uma análise sobre os hot spots feita por especialistas permitiu identificar as causas do desmatamento. Os principais processos de desmatamento foram concentrados para o norte do rio Orinoco, onde estão localizadas 8,63% das florestas do país. Nesta região, alguns lugares registou uma taxa média anual de mudança de floresta entre 0,72% e 2,95%, acima da taxa de variação da floresta para o país como um todo (0,61%). As principais causas de desmatamento para o período avaliado foram as atividades agrícolas e pecuária (47,9%), a agricultura familiar e a agricultura extensiva, que são realizadas em 94% das áreas identificadas.
Palavras-chave: Monitoramento, uso do solo, mudança da cobertura do solo.
INTRODUCTION
Land cover changes over time as a result of human activity. These transformations have caused current environmental problems such as climate change, alterations in the carbon cycle, loss of biodiversity, lower agricultural sustainability and reduced fresh water supply (Lepers et al. 2005). In this context, deforestation may be considered one of the main problems.
In recent decades, the availability of remote sensing data has allowed us to obtain spatially explicit information regarding variation in forest cover at global, regional and national level (Achard et al. 2006). Evaluation of deforestation from remote sensing can be performed using analytical, wall-to-wall and sampling techniques (GOFC-GOLD 2012).
Wall-to-wall is a form of analysis which considers the total area of forest to be evaluated. An example of such analysis is the annual monitoring program carried out in Brazil since 1988, using Landsat images (INPE 2012). Sampling analyses are conducted by means of stratified systematic sampling over deforested areas. An example of systematic sampling is the Remote Sensing System Study of Forest Resources Assessment 2010, known as FRA 2010 (FAO 2010). In order to estimate deforestation rates under the stratified sampling approach, the first step is to determine the deforestation hot spots. This concept was first deployed by the European Commission's Join Research Center (JRC) within the framework of the TREES I Project, when fourteen hot spots were identified and described in the tropical belt (Myers 1992). Deforestation hot spots have been used to synthesize information regarding forest cover changes on a global scale (Lepers et al. 2005), and on a regional scale in tropical forests (Achard et al. 2002). Likewise, they have been used as a basis for estimating forest loss through a combination of medium and high resolution images (Achard et al. 2002; Potapov et al. 2008).
Nevertheless, the deforestation rate values obtained by regional or global studies have not met with universal acceptance, especially those for particular areas. For example, results for Venezuela in different studies show a high degree of uncertainty. More than 50% of Venezuela's territory (462,750 km2) is occupied by forests (FAO 2010). According to the FAO's latest forest resource assessment, Venezuela's deforestation rate over the last decade was 2,880 km2 year-1. However, other studies have detected a deforestation rate of 1,280 km2 year-1 (RNV 2013) or 1,150 km2 year-1 (Harris et al. 2012) over the same period.
In view of those conflicting results, the actual deforestation rate for Venezuela cannot be stated with certainty. Historically, deforestation in Venezuela has occurred to the north of the Orinoco River (Pacheco et al. 2011a). The main cause has been agricultural activity, as is the case with other tropical areas (Pacheco et al. 2011b). Nevertheless, there is currently no clear evidence on this point. Therefore the goal of this research was to identify the areas that underwent forest cover loss between 2005 and 2010. The accurate monitoring of these areas would provide better information regarding forest cover loss over.
MATERIALS AND METHODS
Study area and MODIS Images
About 91% of forests in the Bolivarian Republic of Venezuela belong to the Amazon, amounting to 5.6% of the total area of this region (Eva and Huber 2005). In fact, these forests mean that Venezuela is among the ten countries in the world with greatest biodiversity, and is the sixth in the American continent (MINAMB 2005).
The study used land surface reflectance products from the MODIS sensor on board the TERRA platform. The temporal and spatial resolutions were an 8-day period (L3 Global) and 500 m (MOD09A1), respectively. This product is provided by the United States Geological Survey USGS (http://glovis.usgs.gov/). The images were selected on the basis of high observation coverage, low sensor view angles and absence of cloud and aerosol loading, and were used to estimate spectral reflectance in 8-day composites (Wolfe et al. 1998).
We used all available bands of the MOD09A1 product. In order to cover the survey reference years (2005 and 2010), 8-day composites were used from the beginning of the rainy period of the previous year (Julian Day 137 of 2004 and 2009) to the end of the rainy period of the following year (Julian Day 129 of 2005 and 2010). A total of 440 images were used.
Landsat Images
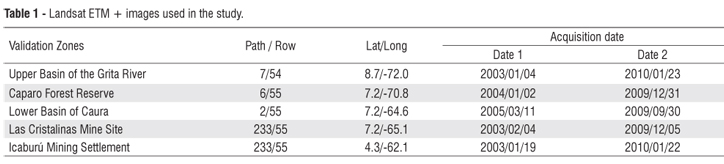
Images from the Landsat ETM+ sensor were also used. These images, obtained from SLC-off mode (Scan Line Corrector), have information loss of about 22%, therefore this is a non evaluated area. One of the problems arising in studies carried out in tropical areas is the unavailability of cloud-free images. For this reason, dry period (November-April) images for previous years were also selected (Table 1) from the USGS collection with L1T level of radiometric and geometric corrections. Three ETM+ spectral bands were considered: green (525-605 nm), near infrared (775-900 nm), and middle infrared (1550-1750 nm).
Additional Information
The vegetation map of Venezuela, published in 1995 by the former Ministry of the Environment and Natural Renewable Resources (MARNR 1995), was used. This map was produced in 1988 on the basis of Landsat TM images. Covering the whole country it is composed of 75 sheets with a scale of 1:250,000. This map was used for training the decision tree algorithm and for the purposes of validation. In order to train the decision tree for the classification of MODIS annual composites (2005 and 2010) we first extracted a series of random sampling points. We then performed a visual inspection, which allowed the most updated categories to be defined, with the support of the images available in the Google Earth⢠program and some Landsat images from between 2003 and 2010 available on the USGS website (www.glovis.usgs.gov).
Using these satellite and auxiliary data we were able to identify and delineate deforestation hot spots. This was carried out in two steps: digital MODIS image classification and expert opinion, where hot spots were identified visually. The latter procedure allowed us to describe the causes of deforestation and the processes which led to and might potentially continue to lead to changes in forest cover (Achard et al. 2002; Achard et al. 2006).
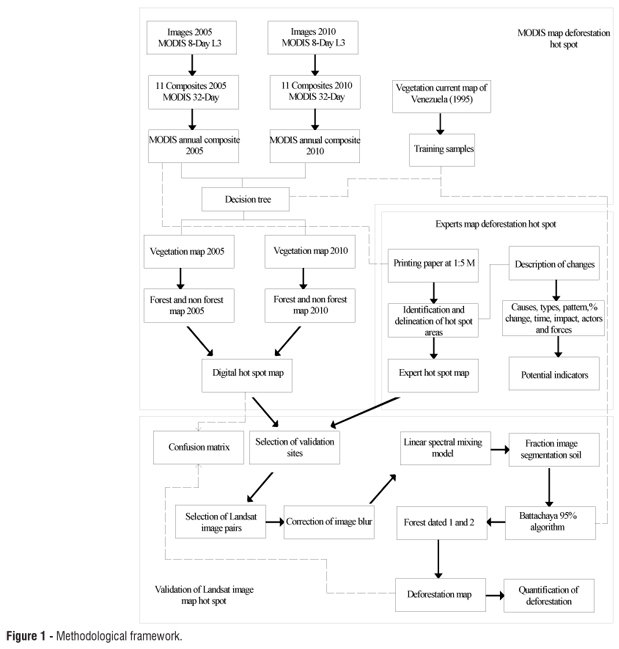
To validate the hot spots of both maps, we chose five areas where changes were due to different causes. Forest loss was quantified in order to corroborate the existence of, or lack of, deforestation. The accuracy of the digital map was determined by analyzing the confusion matrix. Landsat ETM+ images were used in this part of the study. The methodological approach followed in this study is summarized in Figure 1.
Identification and delineation of hot spots using MODIS images
In order to identify deforestation hot spots using the methodology proposed by Achard et al. (2002) and Potapov et al. (2008), two annual composites were generated from the MOD09A1 product. The decision tree algorithm was classified digitally in order to obtain two maps of vegetation cover. After reclassifying these maps into the categories "Forest" and "Non forest", we applied change detection analysis to find out the deforestation hot spots.
Annual Composites
Multiseasonal composites were chosen for the study since they enable the retention of significant information regarding phenological variation without taking into account the specific time of year (Hansen and DeFries 2004). For each of the two study years (2005 and 2010), a total of 220 (8-day) composites were used, 44 for each of the five tiles. From these mosaics, multi-seasonal composites were generated using the method proposed by Potapov et al. (2008). This consists of creating two multiseasonal composites in order to select the best pixels for each image and of carrying out 32-day composites, taking into consideration for each band the second darkest brightness value for each pixel from the four 8-day candidates. This selection reduces the presence of extreme values associated with residual clouds, cloud shadows and other devices that may not be representative of surface conditions. Afterwards, an annual composite is carried out using the bands of these 11 composites (32-day composite) for each year and adopting the maximum reflectivity value of the series in each pixel as the selection criteria.
Classification based on decision tree (2005-2010)
To construct the trees, the Classification and Regression Trees (CARTTM) algorithm (Breiman et al. 1984) was used. This is basically a matter of carrying out binary partitions and using a pruning strategy based on the cost-complexity criterion. This algorithm was chosen as it is one of the most frequently used to generate global land cover cartography, and as it a robust tool for handling nonlinear relationships within remotely sensed data sets (Friedl et al. 2002; Hansen et al. 2002).
The first step in constructing the decision tree consisted of obtaining the set of samples which would allow us to carry out the training phase with 60% of the samples and to save the remaining 40% for validation. These samples were taken from the vegetation map of Venezuela (1995) (MARNR 1995). A set of 2,000 samples were selected in each of the following categories: Forest, as defined, by the Marrakech Accords (UNFCCC 2001), namely, tree formations taller than 5 m, with a minimum area of 1 ha and minimum tree crown coverage of 10% (our study also included gallery forests and mangrove swamps); Shrubland, namely, medium size vegetation between 2 and 5 m tall, including thorns and scrubland; Savannah, including open savannah and combinations with chaparrals, trees and/or palms; Grassland, namely, a vegetation community dominated by high grass where paramos and xerophytic vegetation were also considered; and Water Body, which includes lagoons, reservoirs and rivers. The 2,000 samples of each of the five categories were taken from seven bands of each annual composite (2005-2010), after randomly forcing a minimum distance of 1 km between each sample. A decision tree was constructed for each year, since each one of these was meteorologically different and therefore affected the MODIS reflectance values differently.
The SPSS 17.0 for Windows statistics program was used when setting default options (maximum of five levels, Gini coefficient to estimate each threshold's impurity function, pruning option deactivated, and initial probability values extracted from samples themselves). The minimum value of cases for creating new nodes was set at 1.
Once the decision trees' thresholds had been derived (Figure 2), the MODIS annual composites were classified in order to obtain the 2005 and 2010 vegetation maps. The five categories that resulted from these maps were put into two groups: "Forest" and "Non-forest". Using the differences between these two new maps, deforestation hot spots were located.
Definition of hot spots from expert opinions
Expert knowledge was obtained from people working in different national institutions and with detailed knowledge about Venezuela's deforestation problems. These experts performed two activities: the identification and delineation of hot spots and the description of changes (Achard et al. 2002).
The identification and delineation process of hot spots was carried out using MODIS composites of bands 5, 2 and 1 from the year 2005. The experts were also asked to describe each change in order to determine the spatial location, area of influence and vegetation cover affected by each hot spot; and to characterize the deforestation of each area in terms of causes, types, patterns, percentage of change, time of occurrence, impacts, and agents and forces that lead to deforestation processes.
Additionally, in order to determine which cause or causes of deforestation were the most influential in the process, a percent value was assigned by the experts to each of these causes. These values were weighted according to the total number of areas identified, added up and organized into groups in order to obtain a percentage for the causes of deforestation for the country as a whole.
Validation data
For validation purposes five zones were selected within the hot spots as defined in the digitally obtained maps or by expert opinion. The first two zones were located in the northern region of the Orinoco River: one in the upper basin of the Grita River (1), in the state of Táchira, in the Venezuelan Andes; and the other in the Caparo Forest Reserve (2), in the western high plains 'Llanos', in the state of Barinas. The other three zones were located in the southern region of the Orinoco River, in Venezuela's Amazon forest, more precisely at the Las Cristalinas mine site to the north of the Caura River basin (3); in the Imataca Forest Reserve (4) and in the Icabarú sector (5) in the south of the country.
In each validation zone, pairs of Landsat ETM+ images were used (see item Landsat Images), from which two vegetation maps were obtained to determine forest cover. In order to quantify forest loss and to confirm the presence or absence of deforestation hot spots on both maps, change detection analysis based on differences in this coverage was applied. Furthermore, that analysis permitted us to determine the accuracy of the digitally processed map. In order to facilitate the classification of the Landsat ETM images, a Linear Spectral Mixture Model (LSMM) was applied, before segmenting the synthetic images and supervising the classification of the selected components.
In order to improve the quality of the ETM+ images by reducing sensor-derived distortions, we used an image restoration technique available from the Brazilian National Institute for Space Research (INPE)'s SPRING software (http://www.inpe.br/). Corrections were made using a linear filter, where the restoration filter weights were obtained from the characteristics of the sensor.
Linear Spectral Mixture Model (LSMM)
A Linear Spectral Mixture Model was applied to improve the original ETM+ images (bands 3, 4 and 5) before classifying them. The aim of the LSMM is to estimate the proportion of soil, vegetation and shade components in each pixel from the spectral response of the ETM+ bands. The LSMM technique provides images with soil, vegetation and shade fractions (Shimabukuro and Smith 1991).
The soil component was used in the following processes since it offers good contrast between forest and bare soil. The endmembers used to calibrate the model were obtained from the same image.
The soil fraction band was divided into multiple parts through a segmentation process in order to gather information from the image. It was therefore necessary to establish two criteria for inclusion in a group: a) a minimum criterion of similarity, under which two areas might be considered similar and grouped in one region; and b) the minimum area, given in number of pixels, which an area required in order to be individualized (Bins et al. 1996). For our study we used the values of 8 and 16 for similarity and minimum area, respectively.
Supervised Classification
The image resulting from segmentation was later classified with a distance-based supervised algorithm, with an acceptance threshold of 95% (the Bhattacharyya distance was used to classify the image). For this purpose, training samples were defined from 15 to 25 by selecting objects from the segmented image, which represented between 1 and 5% in every one of the following categories: forest, shrubland, savannah, grassland, water bodies and no information (clouds, cloud shadows and SLC-off error), with support from the high resolution image available in the Google EarthTM program and the vegetation map of Venezuela (1995). Once the images had been classified, the classes were regrouped into forest and non-forest and the forests were assessed for each year in order to learn, through their difference, the loss over the period analyzed. This allowed us to map the existence of deforestation processes in the hot spots identified.
Validation approach
Change detection analysis was applied to these new maps. The result of this process allowed us to find out whether there was deforestation or not in the hot spots as defined by the experts. The process also allowed us to determine the accuracy of the classification map obtained from MODIS data through the digital processing (Congalton 1988).
In order to compare both maps, the map obtained from the change detection process had to be resampled from 30 m to 500 m. By this means the digital hot spot map's accuracy was calculated on the basis of the confusion matrix, from which we computed the following reliability parameters as described by Congalton and Green (2009): errors of omission and commission, global accuracy and Kappa index (Cohen 1960).
RESULTS
Cartography of hot spots from MODIS data
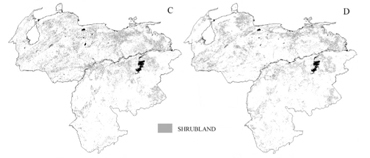
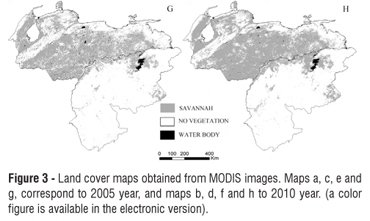
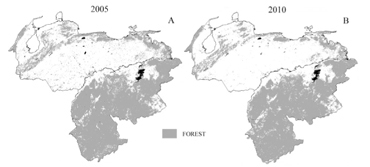
The vegetation map obtained from MODIS data show that in 2005, 54.5% (499,462.5 km2) of Venezuela's land was covered by forest. In 2010, this proportion had decreased to 53.3% (488,465.2 km2). More than 90% of the forests that remain are located in the southern part of the country, the remaining 10% being located in the north: in the Andes, the Sierra de Períja and the Sistema Montañoso de Lara-Falcón, all in the northwestern subregion and, on the other hand, in the Venezuelan Coastal Range, in the central north-northeastern subregion (Figures 3a and 3b). Shrublands, along with forests in the plains, are mainly located in the center of the country (Figures 3c and 3d), while grasslands are located near the Orinoco River, in the Andes and in the Falcón state in the northwestern subregion (Figures 3e and 3f). Savannahs are located in the Maracaibo Lake depression, in the northwestern subregion and in the center of the country (Figures 3g and 3h).
Vegetation maps from 2005 and 2010, derived from a classification based on decision trees, yielded figures for global accuracy of 66.9% and 70.3% and Kappa indices of 0.58 and 0.62 respectively. Although these accuracy levels are not high, the forest category (the most significant one in this study) gave success percentages of 86.3% and 78.8%, with commission errors of 12.6% and 5.19% and omission errors of 13.7% and 21.2% for 2005 and 2010, respectively. These values are acceptable for mappings with medium resolution sensors.
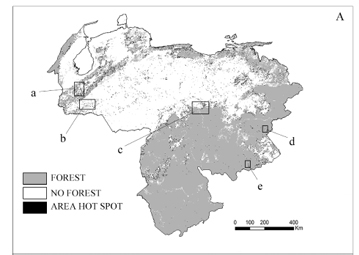
In relation to the hot spots we found that they are located in various of Venezuela's forests in the northwestern region, to be more precise in the Sierra de Períja, the Sistema Montañoso de Lara-Falcón and the Andes Mountains (Figure 4a). In this last, the upper basin of the Grita River is a prime example (Figure 4b, zone 1 validation). Also significant is the Caparo Forest Reserve in this region's plain (Figure 4b, zone 2 validation). Similarly, some hot spots can be found in the Venezuelan Coastal Range in the central north and northeastern regions. In this latter region, there is a hot spot associated with the plantation of pine trees by the Venezuelan Corporation of Guayana, where large scale forest use activities are carried out annually. Most of the country's forests are found in the south, where some hot spots are also located. Other important areas are the Upper Caura Basin (Figure 4b, zone 3 validation), the Las Cristalinas mine site (Figure 4b, zone 4 validation) and the Icaburú mining settlement (Figure 4b, zone 5 validation).
Cartography of hot spots derived from expert opinion
The results obtained from expert opinions allowed us to derive a deforestation hot spot map depicting 17 zones of highly concentrated forest cover change. Eight areas were located to the north of the Orinoco River, while nine were located to the south (Figure 5). The description of these areas allowed us to characterize and diagnose the deforestation processes on the basis of the process of change, deforestation pattern, time when deforestation occurred, impact, agents and driving forces (Table 2). It also allowed us to estimate the percentage of the proximate causes of deforestation in Venezuela, namely those activities which are a direct cause of deforestation (Geist and Lambin 2002).
The results show that the most important cause of forest cover change was agricultural and livestock activity which accounts for 47.9% of change. In the main this activity takes the form of mixed family farming and extensive farming for national consumption, activities which are carried out at 94% of Venezuela's hot spots.
The second most important cause is infrastructure expansion which accounts for 24.6% of forest cover change. This expansion has created settlements near the main urban centers (Puerto Ayacucho, Guayana City, Upata and El Palmar). Also, urban expansion in metropolitan areas like the Capital District, San Cristóbal, Mérida and Trujillo has taken place at the expense of nearby forests. Finally, the construction of rural roads and railways in different areas of the country has also affected the forests.
Timber extraction, most often commercial purposes, both state and private, is also important, accounting for 20% of forest cover change. This activity is widespread in the forest reserves to the north of the Orinoco River. Forest use can also be observed in the use of wood for domestic fuel in most of the hot spots identified.
Another cause is mining activity, both metal and non-metal, which accounts for 4.24% of forest change cover. Metal mining mainly occurs on both a large and small scale in the hot spots in the southern region of the Orinoco, where gold, diamonds, iron and bauxite are the chief minerals extracted. Non-metal mining is carried out in the northern region of the Orinoco, in the Sierra de Perijá and the Andes region, where coal is extracted, and the central Venezuelan Coastal Range, where nickel and kaolin are extracted.
Population growth puts pressure on Venezuela's forests and could potentially bring about their deforestation. Because of such growth, currently less than 15% of forest cover remains in the Forest Reserves in the northern region of the Orinoco River. For example, the Caparo Forest Reserve (one of the validation areas) has a high rate (2.95%) of deforestation despite its protected status. Population growth will continue to encroach on this landscape, with the result that lands will be required for extensive farming or mixed small-yield family farms.
Finally, approximately 85% of the hot spots obtained through digital processing corresponded to the hot spots obtained by experts. Some examples of this correspondence are found in certain areas of the northwestern region, such as Sierra de Perijá and the Andes Mountains; in areas of the central north and northeastern region, such as the Venezuelan Coastal Range; and in areas of the southern region, such as the upper basin of the Caura River, Guayana City, Cerro Autana, Yapacana and Puerto Ayacucho. All these areas demand attention.
Validation
The vegetation maps obtained from MODIS images gave a confidence level of 81.8% for 2005 (Kappa index = 0.73), and 81% for 2010 (Kappa index = 0.74). Values for the category of greatest interest in this study (forest) were acceptably reliable for a map generated from medium resolution sensors (GOFC-GOLD 2012). Thus, forest cover was correctly classified in a percentage range between 87.6% and 80.8% (Table 3), with commission errors of 7.80% and 2.70%, and omission errors of 12.4% and 19.2%, for 2005 and 2010, respectively (Table 4).
For their part, after validating hot spots derived from digital classification and from expert opinion, deforestation processes were found to be in progress in the five sampling areas, thus corroborating the hot spots shown on the two maps obtained. On the other hand, we observed different rates of forest cover change in the validation area, where Caparo Forest Reserve had the highest rate (2.95) and Icaburú Minning (0.20) the lowest (Table 5).
The overall accuracy of the hot spot map obtained from digital classification was found to be 92.5%, with a Kappa index of 0.29. This Kappa value indicates fair agreement. It is worth noticing that in the deforestation category both commission and omission errors (67.7% and 66.9%, respectively) were higher than in the category of non deforestation, whose commission and mission errors were 3.93% and 4.06% respectively.
DISCUSSION
The main aim of detecting changes between the 2005 and 2010 maps obtained from annual composites of MODIS images was to identify, delineate and characterize deforestation hot spots rather than to give a direct estimation of deforestation areas for the period assessed, as recommended by GOFC-GOLD (2012). The hot spots identified will serve as a sampling for the direct estimation of deforestation areas. In other studies hot spot areas were identified using high resolution images, such as those derived from Landsat-5 TM, Landsat-7 ETM+, Terra Aster, IRS-P2 LISS-III and AWIFS, CBERS-2 HRCCD, DMC and Spot-5 HRVIR (Achard et al. 2010; GOFC-GOLD 2012).
In our study the validation of the hot spot maps obtained through digital classification and expert opinion with Landsat-7 EMT+ images served to corroborate the existence or absence of deforestation processes in the 2005-2010 periods within the deforestation hot spots. This further allowed us to evaluate the accuracy of the map obtained by means of digital classification. These results indicated that the deforestation category had more commission and omission errors than the no deforestation category. These values were influenced by the high number of pixels classified correctly in the category of non-loss, which caused global accuracy to be quite high (92.5%) and the Kappa index to indicate low agreement (0.29) according to Landis and Koch (1977).
Approximately 85% of the hot spots obtained by digital classification corresponded to hot spots obtained from the experts, the remaining 15% being areas detected on the edge of forests and therefore influenced by the edge effect. It should also be born in mind that differences in weather conditions in 2005 and 2010 naturally affected the reflectance value and therefore the classification process. In order to understand the results obtained in this study should be considered that this study's sampling design differs from that of the FRA 2010 report (FAO, 2010) which is currently being performed by the FAO in collaboration with the JRC as part of the TREES project 3 (2007 -2013). In our study, stratified sampling design was used, whereas FRA 2010's is systematic.
Our results were also compared with the deforestation map obtained by Hansen et al. (2008). Although they considered an earlier period (2000-2005), their map showed the same trends. The deforestation hot spots identified in 2000-2005 were also hot spots in 2005-2010, especially to the south of the Orinoco river (upper basin of Caura river and Imataca Forest Reserve); and to the north of the Orinoco in mountainous areas such as Sierra de Perijá, los Andes and Costa Norte. New hot spots in 2005-2010 that did not exist in 2000-2005 were located in the Llanos Occidentales, although these were traditionally deforestation areas.
As for the causes of deforestation, we were able to identify various agents. Moreover, the loss of forest areas in the northern region of the Orinoco River will continue to cause, as it has in the past (Pacheco et al. 2011a; Pacheco et al. 2011b), a process of mass immigration towards the southern forest regions. This immigration is one of a number of other causes of deforestation in the southern zone of the Orinoco River, chief among which are: the rapid growth of the urban areas in the Guayana region; the high density of rural settlements around the urban centers; the growth of the native population (accompanied by a process of transculturation); and the evolution of the permanent settlements of the mining population.
CONCLUSIONS
This study enabled us to ascertain the state of forest cover change on a national scale over a five year period and for the foreseeable near future. The study also allowed us to obtain representative values, though these are not claimed to be statistically valid for the entire country. Additionally, this study showed that:
As in the southern basin of the Amazons, deforestation in Venezuela is not distributed randomly or uniformly, but rather is associated with different causes and concentrated in certain areas of the country. The main processes of deforestation are concentrated in the northern region of the Orinoco River, where according to data from the FRA 2005 and the JRC, 8.63% of the forests are currently located. The proximate cause of forest cover loss in Venezuela for the period evaluated was agricultural activity, as it has been throughout the country's history, and as is the case with the rest of the tropical forests. These results can be considered useful in the study of climate change and the carbon cycle, biodiversity loss, sustainable agriculture, drinking water sump, or the modeling of future deforestation. In this regard, information about deforestation processes can help in the development and publication of inventories of anthropogenic emissions of greenhouse gases and in the formulation of plans to reduce and control these emissions.
ACKNOWLEDGEMENTS
This study was carried out at the Department of Geography, University of Alcalá. The first author has been funded by the University of the Andes through the Dirección de Asuntos Profesorales Grant. We would like to thank the following experts for their participation: Leonardo Lugo and Américo Catalán of the Dirección General de Bosque del Ministerio del Poder Popular para el Ambiente; Otto Huber of the Fundación Instituto Botánico de Venezuela; Mariela Loaiza, Omar Márquez and Lisandro Ramírez of the Coordinación Técnico Científico Ambiental del Ministerio Público; Ernesto Arends, José Lozada and Alexander Parra from the University of the Andes.
Recebido em 01/03/2013
Aceito em 10/07/2013
- Achard, F.; Eva, H.D.; Stibig, H.J.; Mayaux, P.; Gallego, J.; Richards, T.; Malingreau, J.P. 2002. Determination of deforestation rates of the world's humid tropical forests. Science, 297: 999-1002.
- Achard, F.; Mollicone, D.; Stibig, H.J.; Aksenov, D.; Laestadius, L.; Li, Z.Y.; Popatov, P.; Yaroshenko, A. 2006. Areas of rapid forest-cover change in boreal Eurasia. Forest Ecology and Management, 237: 322-334.
- Achard, F.; Stibig, H.-J.; Eva, H.D.; Lindquist, E.J.; Bouvet, A.; Arino, O.; Mayaux, P. 2010. Estimating tropical deforestation from Earth observation data. Carbon Management, 1:271-287.
- Bins, S.A.; Fonseca, L.M.G.; Erthal, G.J.; Li, M. 1996. Satellite imagery segmentation: a region growing approach, Anais do VII Simpósio Brasileiro de Sensoriamento Remoto, VII Simpósio Brasileiro de Sensoriamento Remoto ed. INPE, Salvador, Brazil, p.677-680.
- Breiman, L.; Friedman, J., Olshen, R.; Stone, C.J. 1984. Classification and Regression Trees, Wadsworth and Brooks/Cole, Monterey, California, USA, 80p.
- Cohen, J. 1960. A coefficient of agreement for nominal scales. Educational and Psychological Measurement, 20: 37-46.
- Congalton, R. 1988. comparison of sampling schemes used in generating error matrices for assessing the accuracy of maps generated from remotely sensed data. Photogrammetric Engineering and Remote Sensing, 54: 593-600.
- Congalton, R.; Green, K. 2009. Assesing the accuracy of remotely sensed data: Principles and Practices. Taylor and Francis Group, London, New York, CRC Press, 192p.
- Eva, H.D.; Huber, O. 2005. A proposal for defining the geographical boundaries of Amazonia Joint Research Center EC, Ispra, Italy, 40p.
- FAO. 2010. Global Forest Resources Assessment 2010. Main Report. Food and Agriculture Organization of the UN, Rome, Italy, 378p.
- Friedl, M.A.; McIver, D.K.; Hodges, J.C.F.; Zhang, X.Y.; Muchoney, D.; Strahler, A.H.; Woodcock, C.E.; Gopal, S.; Schneider, A.; Cooper, A.; Baccini, A.; Gao, F.; Schaaf, C. 2002. Global land cover mapping from MODIS: algorithms and early results. Remote Sensing of Environment, 83: 287-302.
- Geist, H.; Lambin, E. 2002. Proximate cause and underlying driving forces of tropical deforestation. BioScience, 52: 143-150.
- GOFC-GOLD. 2012. A sourcebook of methods and procedures for monitoring and reporting anthropogenic greenhouse gas emissions and removals caused by deforestation, gains and losses of carbon stocks in forests remaining forests,and forestation. In, GOFC-GOLD Report version COP18-1. Canada, Alberta, Canada.: GOFC-GOLD Project Office, Natural Resources, 219p.
- Hansen, M.C.; DeFries, R.S. 2004. Detecting Long-term Global Forest Change Using Continuous Fields of Tree-Cover Maps from 8-km Advanced Very High Resolution Radiometer (AVHRR) Data for the Years 198299. Ecosystems, 7: 695-716.
- Hansen, M.C.; DeFries, R.S.; Townshend, J.R.G.; Sohlberg, R.; Dimiceli, C.; Carroll, M. 2002. Towards an operational MODIS continuous field of percent tree cover algorithm: examples using AVHRR and MODIS data. Remote Sensing of Environment, 83: 303-319.
- Hansen, M.C.; Stehman, S.V.; Potapov, P.V.; Loveland, T.R.; Townshend, J.R.G.; DeFries, R.S.; Pittman, K.W.; Arunarwati, B.; Stolle, F.; Steininger, M.K.; Carroll, M.; DiMiceli, C. 2008. Humid tropical forest clearing from 2000 to 2005 quantified by using multitemporal and multiresolution remotely sensed data. Proceedings of the National Academy of Sciences, 27: 9439-9444.
- Harris, N.L.; Brown, S.; Hagen, S.C.; Saatchi, S.S.; Petrova, S.; Salas, W.; Hansen, M.C.; Potapov, P.V.; Lotsch, A.. 2012. Baseline Map of Carbon Emissions from Deforestation in Tropical Regions. Science, 336: 1573-1576.
- INPE. 2012. Monitoring of the Brazilian Amazonian: Projeto PRODES http://www.obt.inpe.br/prodes/index.html, Brazil. Accessed on: 24/02/2013.
- Landis, J.R.; Koch, G.G. 1977. The Measurement of Observer Agreement for Categorical Data. Biometrics, 33: 159-174.
- Lepers, E.; Lambin, E.F.; Janetos, A.C.; DeFries, R.; Achard, F.; Ramankutty, N.; Scholes, R.J. 2005. A Synthesis of Information on Rapid Land-cover Change for the Period 19812000. BioScience, 55:115-124.
- MARNR. 1995. Mapa de vegetación de Venezuela, Ministerio del Ambiente y de los Recursos Naturales Renovables ed, Caracas, Venezuela.
- MINAMB. 2005. Información forestal, MINAMB ed. Dirección General de Bosque. Ministerio del Ambiente y de los Recursos Naturales Caracas, Venezuela.
- Myers, N. 1992. Future operational monitoring of tropical forests: an alert strategy. Join Research Center EC, Ispra, Italy, 81p.
- Pacheco, C.; Aguado, I.; Mollicone, D. 2011a. Dinámica de la deforestación en Venezuela: análisis de los cambios a partir de mapas históricos. Interciencia, 36: 578-586.
- Pacheco, C.; Aguado, I.; Mollicone, D. 2011b. Las causas de la deforestación en Venezuela: un estudio retrospectivo. Biollania, 10: 281-292.
- Potapov, P.; Hansen, M.C.; Stehman, S.V.; Loveland, T.R.; Pittman, K. 2008. Combining MODIS and Landsat imagery to estimate and map boreal forest cover loss. Remote Sensing of Environment, 112: 3708-3719.
- RNV, 2013. Tasa de deforestación se redujo en un 47 por ciento gracias a Misión Árbol, (http://www.rnv.gob.ve/index.php?option=com_content&view=article&id=8001:tasa-de-deforestacion-se-redujo-en-un-47-por-ciento-gracias-a-mision-arbol&catid=48:regionales&Itemid=72). Accessed on: 24/02/2013.
- Shimabukuro, Y.E.; Smith, J.A. 1991. The least-squares mixing models to generate fraction images derived from remote sensing multispectral data. Geoscience and Remote Sensing, IEEE Transactions, 29: 16-20.
- UNFCCC. 2001. COP-7: The Marrakech accords, in: Secretariat, U. (Ed.), Bonn, Germany, 245p.
- Wolfe, R.E.; Roy, D.P.; Vermote, E. 1998. MODIS land data storage, gridding, and compositing methodology: Level 2 grid. Geoscience and Remote Sensing, IEEE Transactions, 36: 1324-1338.
Publication Dates
-
Publication in this collection
27 Feb 2014 -
Date of issue
June 2014
History
-
Received
01 Mar 2013 -
Accepted
10 July 2013