Abstracts
One of the first scientific maps of the Amazon region, The Course of the Amazon River (Le Cours de La Rivière des Amazones), was constructed by Nicolas Sanson, a French cartographer of the seventeenth century, and served as the prototype for many others. The evaluation of this chart, until now, has been that it is a very defective map, a sketch based on a historical account, according to the opinion of La Condamine. Thus, the aim of the present work was to prove that the map of the Amazon River traced by Nicolas Sanson is a scientific work, a map that presents precise geographic coordinates considering its time, shows a well-determined prime meridian, and also employs a creative methodology to deduce longitudes from latitudes and distances that had been covered. To show such characteristics, an analysis of the accuracy of the map was made by comparing its latitudes and longitudes with those of a current map. We determined the prime meridian of this map and analyzed the methodology used for the calculation of longitudes. The conclusion is that it is actually a good map for the time, particularly considering the technology and the limited information that Sanson had at his disposal. This proves that the negative assertion of La Condamine is unfounded.
Historical Cartography; Longitude; Accuracy; La Condamine; Pagan
Um dos primeiros mapas científicos da região amazônica (Le Cours de La Rivière des Amazones), elaborado por Nicolas Sanson, cartógrafo francês do século XVII, serviu de protótipo para muitos mapas da região. No entanto, a avaliação desse mapa, até o presente estudo, é que se trata de um mapa muito defeituoso, um esboço baseado em relato histórico, segundo uma apreciação de La Condamine que se difundiu até os nossos dias. Assim, o objetivo do presente trabalho foi provar que, pelo contrário, é um trabalho científico: um mapa que possui coordenadas geográficas precisas para a sua época, um meridiano de origem bem determinado e que empregou uma metodologia criativa para deduzir as longitudes a partir de latitudes e distâncias percorridas. Para isso foi feita uma análise da precisão desse mapa, comparando suas latitudes e longitudes com as de um mapa atual; bem como a determinação do meridiano de origem e a metodologia utilizada por esse cartógrafo para o cálculo das longitudes. A conclusão é que ele é um bom mapa para a época, tendo em conta as poucas informações de que o autor dispunha, e isso mostrou que são infundadas as apreciações negativas de La Condamine.
Cartografia histórica; Longitude; Precisão; La Condamine; Pagan
Nicolas Sanson and his Map: The Course of the Amazon River* * Corresponding author: jpcintra@usp.br
Nicolas Sanson e seu mapa: O Curso do rio Amazonas
Jorge Pimentel CintraI, Rafael Henrique de OliveiraII
IEscola Politécnica da Universidade de São Paulo, Departamento de Engenharia de Transportes, Caixa Postal 61.549, CEP 05424-970, São Paulo, SP, Brazil.
IIEscola Politécnica da Universidade de São Paulo, Departamento de Engenharia de Transportes, Caixa Postal 61.549, CEP 05424-970, São Paulo, SP, Brazil. E-mail: rafa.oliveira@usp.br
ABSTRACT
One of the first scientific maps of the Amazon region, The Course of the Amazon River (Le Cours de La Rivière des Amazones), was constructed by Nicolas Sanson, a French cartographer of the seventeenth century, and served as the prototype for many others. The evaluation of this chart, until now, has been that it is a very defective map, a sketch based on a historical account, according to the opinion of La Condamine. Thus, the aim of the present work was to prove that the map of the Amazon River traced by Nicolas Sanson is a scientific work, a map that presents precise geographic coordinates considering its time, shows a well-determined prime meridian, and also employs a creative methodology to deduce longitudes from latitudes and distances that had been covered. To show such characteristics, an analysis of the accuracy of the map was made by comparing its latitudes and longitudes with those of a current map. We determined the prime meridian of this map and analyzed the methodology used for the calculation of longitudes. The conclusion is that it is actually a good map for the time, particularly considering the technology and the limited information that Sanson had at his disposal. This proves that the negative assertion of La Condamine is unfounded.
Keywords: Historical Cartography, Longitude, Accuracy, La Condamine, Pagan
RESUMO
Um dos primeiros mapas científicos da região amazônica (Le Cours de La Rivière des Amazones), elaborado por Nicolas Sanson, cartógrafo francês do século XVII, serviu de protótipo para muitos mapas da região. No entanto, a avaliação desse mapa, até o presente estudo, é que se trata de um mapa muito defeituoso, um esboço baseado em relato histórico, segundo uma apreciação de La Condamine que se difundiu até os nossos dias. Assim, o objetivo do presente trabalho foi provar que, pelo contrário, é um trabalho científico: um mapa que possui coordenadas geográficas precisas para a sua época, um meridiano de origem bem determinado e que empregou uma metodologia criativa para deduzir as longitudes a partir de latitudes e distâncias percorridas. Para isso foi feita uma análise da precisão desse mapa, comparando suas latitudes e longitudes com as de um mapa atual; bem como a determinação do meridiano de origem e a metodologia utilizada por esse cartógrafo para o cálculo das longitudes. A conclusão é que ele é um bom mapa para a época, tendo em conta as poucas informações de que o autor dispunha, e isso mostrou que são infundadas as apreciações negativas de La Condamine.
Palavras-chave: Cartografia histórica, Longitude, Precisão, La Condamine, Pagan
INTRODUCTION
By tracing the precedents of his map of the Amazon River, La Condamine (1745, p. 44) informs the reader that "a very defective map of the course of this river, due to Sanson, based on purely historical narrative, was then copied by all geographers" Due to the authority of La Condamine, an eminent scientist of the Academy of Sciences of Paris, his statement has prevailed and influenced the opinion we have of this map until now. There are no published studies examining this map in depth, and in this study we came to the opposite conclusion of La Condamine. Our basic hypothesis, here proved, is that Sanson's is a scientific map of the Amazon River, in view of the technical characteristics of his map: its accuracy, the scientific way in which it was constructed, and its impact on subsequent work.
MATERIALS AND METHODS
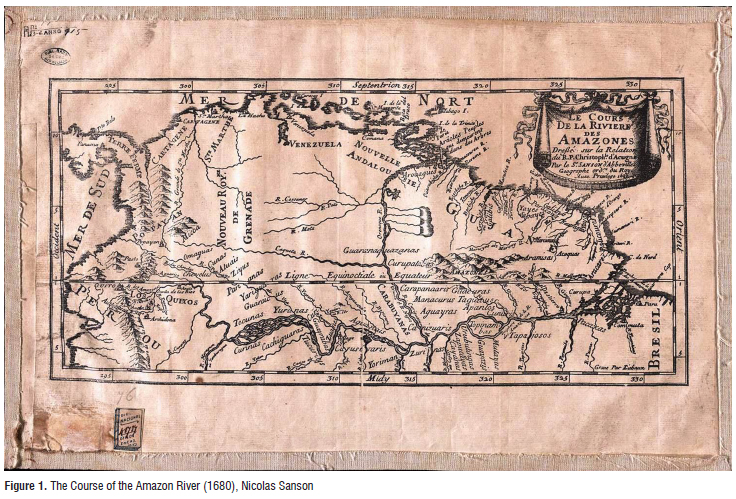
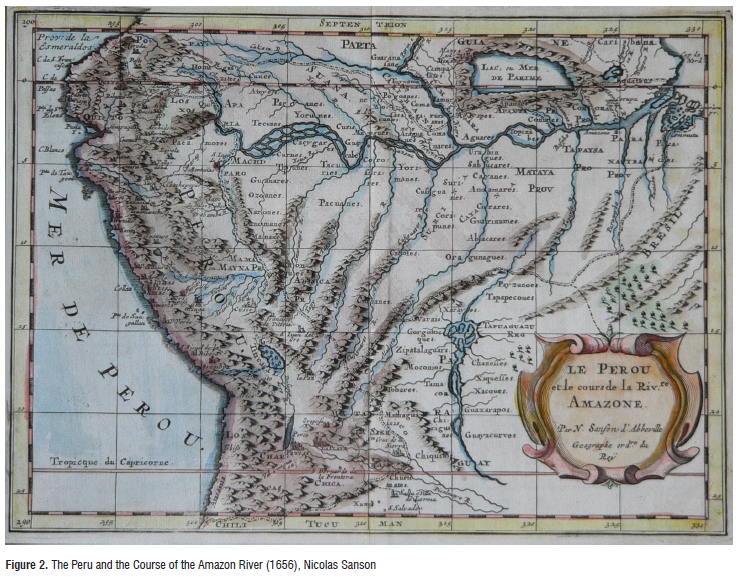
The main material used in this research is the chart The Course of the River of the Amazons (Le Cours de la Riviere des Amazones), reproduced in Figure 1. It is rightly attributed to Nicolas Sanson (1600-1667), royal cartographer of France, although it was published in 1680, some years after his death. As material for comparative study, another map by Sanson is also used, Peru and the Course of the Amazon River (Le Perou et le cours de la Riviere Amazone, 1656), as well as the map New Design of the Great Amazon River in Southern Latin America (Magni Amazonian fluvii in America Meridionali new delineatio), prepared by the Count of Pagan in 1655.
The methodology described in Cintra (2012) was used to identify the map projection, determine the prime meridian, and check the accuracy of the map. The analysis of the texts led the way for the application of spherical trigonometry and the discovery of how the map was constructed, particularly how the author determined the longitudes and latitudes from the distances between two points. The program MapInfo (Pitney Bowes Software) was used in the measurement of geographical coordinates, as well as for comparative analysis with other maps. An Excel spreadsheet was used for statistical calculations. The thread of analysis, as a counterpoint, was the appreciation of this map made by La Condamine, who, after measuring the arc of the meridian in Peru, went down the Amazon River and drew up a highlighted map of its course, analyzed by Cintra and Freitas (2011).
RESULTS
Morphological analysis
A simple morphological analysis of this map (Figure 1) allowed us to anticipate some results. This is a graphically simple chart, with no colors, that provides much toponymic information both about the Amazon basin and about the northern coast of South America. It covers the region lying between latitudes 13º and -6º and between longitudes 291º and 332º with respect to an unspecified meridian. Its edge is graduated in longitude and latitude (every 5º), and indicated in these edges are the four cardinal regions: north (Septentrion), noon (Mydy, South), east (Orient), and west (Occident). Beyond the graduation of coordinates (latitude and longitude) on the edges, there is another scale of longitudes in the equator. The very existence of geographic coordinates is a clue indicating that this is not a draft, but a map that can be used scientifically. A question to La Condamine and to those who have so far followed his opinion is: How did the author determine longitudes? At that time there was no simple method for performing this determination. The ornamental cartridge (cartouche) in the upper right corner shows title, author, date (1680), and reference to use of Father Acuña's data, an important statement that will be proved in the present work.
The purpose of Sanson's map, as its name indicates, is to draw the course of the Amazon River, but visual analysis shows that this map commits the mistake of following the conception of that time: The river is represented as a stream of water that originates near Quito and has as part of its course the rivers Coca and Napo, which today are known to be tributaries. Fritz, a missionary in the Amazon, was the first cartographer who discovered and corrected this error in a map of 1707, indicating the river Maragnon (called Tumburagua in Sanson's map) as the main stream (La Condamine, 1745). Sanson based his work only on Father Acuña's account (a narrative of the trip of Pedro Teixeira, an explorer of the Amazon); without having gone to the field, he had no way to rectify this mistake.
The political divisions represented in this map are of two types: Brazil, Peru, and Guyana are shown in greater font size; and the New Kingdom of Granada, New Andalusia, Venezuela, Terra Firme (near the Isthmus of Panama), Cartagena, Popaian and Santa Marta are shown in smaller font size. The North Sea (Atlantic) and the South Sea (Pacific) complete the framework of this part of the American continent.
The abundant names of rivers and indigenous tribes, the main cartographic features represented, effectively follow Father Acuña's account (1641). Some of them are listed in Table 2, which will be used to analyze the accuracy of the geographic coordinates (latitude and longitude). Some can be highlighted by font (uppercase) as follows: Los Quixos, Carabuyanas, Amazones, the latter being a reference to the legendary Greek female riders. It can also be observed that there is little information regarding the tributaries of the Amazon River's right bank (south), which is also due to the limit of 6º of south latitude chosen by the author.
From the perspective of cartographic representation, the mountain chains are indicated by icons or natural symbols (small mountains); greater rivers include double margins, and the continent-ocean boundary is highlighted by hatch marks; there are certain turns and windings of the river that are not based on data, but intended to represent the concept of a water course with many turns; and the same applies to islands drawn in the region of Omáguas. It also uses a hierarchical cartographic symbology for cities, villages, towns, and forts. This is seen, for example, in Quito, Anete, Village d'Or (a mythical city), and Destierro (an abandoned Portuguese fort).
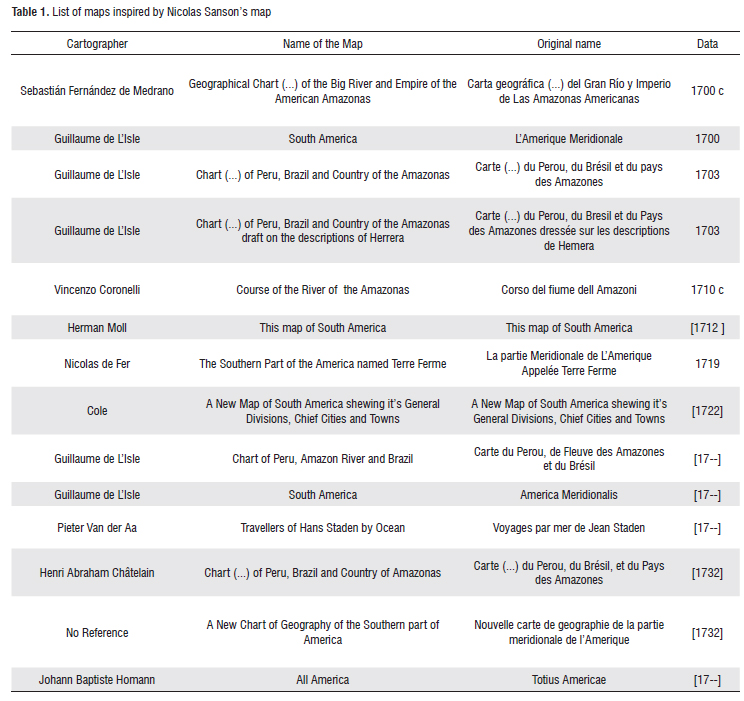
In the field of morphological analysis, a comparative study was conducted to assess La Condamine's statement, referred to above, that this map "was then copied by all geographers." In order to accomplish this, we examined the maps available at the Brazilian National Library (Biblioteca Nacional, 2013), referring to the Historical Cartography Project of the sixteenth to the eighteenth centuries, selected by a visual comparative analysis with Sanson's map. The results are shown in Table 1, which lists the maps that were inspired by the map of Sanson.
This table contains the name of the original map so that it can be easily found in the website of the Brazilian National Library. According to the convention of this Library, with respect to dates, the use of the letter c indicates that this is an approximate date (from the Latin circa), dates in brackets mean a probable value, and the absence of the final digits means the exact date is unknown.
In this comparative analysis, the following morphological features from Sanson's map were chosen: 1. the symbolic representation of sets of islands near and past the mouth of the Napo River, in the region of Omáguas, and at the mouth of the Amazon itself; 2. the Island of Tupinambás, distant about 1º in longitude from the mouth of the Rio Madeira; 3. the particular conformation of the coast between Cape North and Cape Orange, with a slope close to 45º (NW); 4. the representation of Curupá on the south bank of the Amazon, when in fact it lies on the north bank; 5. the connection between the Orinoco and the Amazon basins running from north to south and receiving a tributary (Caquetá) almost perpendicularly; 6. a large pond that is unnamed but corresponds to the representation of the mythical lake Manoa or El Dorado, which is present and named in the vast majority of the maps of the period, and furthermore communicates with the Orinoco River in its middle course through four arms; and 7. the Amazon, which is considered to course from Quito and be formed by the rivers Coca, Napo, and Amazon, while the Maragnon River or River Tumburagua (actually the Amazon itself) joins the Napo with almost the same width in the representation, but without being the main one.
Taking into account the importance and representativeness of the cartographers and the maps mentioned in Table 1, we can state that Sanson's map did serve as the prototype of the Amazon River, with singular features that make this paradigm easily recognizable in many subsequent charts. Some of these characteristics, which are not forms determined by measurements on the ground, constitute what may be termed representations of concepts or conceptual representations present in Father Acuña's written account. These include many islands and the birth of the river on the west side, in the Andean region, with just a single stream from Quito to Belem and tributaries. There is a certain difference between this and what is called map generalization: in the latter case, the shapes are determined accurately and are subjected to modifications (generalizations) at the time of the representation. In the case of the map prepared by Sanson, one passes directly from the report of Father Acuña to the representation of the map. This character of conceptual maps of the Amazon River is very clear in several sixteenth-century maps that seek mainly to convey ideas by means of very misleading representations; for example, a) the idea of a large river, locating the headwaters of the Amazon in Patagonia; b) the idea of a river meandering by means of a great number of sinusoidal curves containing very constant amplitude around the equator, and so on. But as we seek to show, Sanson's map, despite containing some representations of such style, shows the route of the river as not merely symbolic or conceptual, but as cartographically accurate, i.e., landforms lie in positions close to the real situation as a result of measurements and calculations.
Before performing a quantitative cartographic analysis, it is worth mentioning another question regarding the date of this map (1680), which is after Sanson's death (1667). In conducting a study of the other maps by this author, it appears that on the chart, dated 1656 and named The Peru and the course of the Amazon River (Le Perou et le cours de la Riviere Amazone, Figure 2), the seven aforementioned features already appear. Thus everything suggests that the oldest should be the model for the latest. But there are reasons to assert the opposite; to draw his maps of continental or of global scale, Sanson needed a sketch of this section of America to take advantage of the information it contains and its morphology. This sketch or prototype, based on data from Acuña that was made public in 1640, was used in several of Sanson's maps representing America. The hypothesis of this study is that after his death, his sons, who continued his cartographic work, decided to transform the sketch into a map, attributing it rightly to their father, even as a posthumous tribute.
The functional character of this map also explains a certain detachment in which the political elements are scarce, which does appear implicitly and explicitly in Sanson's world map and world maps from several other cartographers, due to reasons of state and the policy of the king they served. These works are usually dedicated to the monarch and contain the expression "world map for use of the king" (Mappe monde a l'usage du Roy). Such an expression includes the possibility that the king uses the map as a purely decorative object, but also as a document for strategic decisions. These may include a better understanding of the empire and even serve purposes of conquest, as seen for example in the book that contains Pagan's map. In this book (Pagan, 1655), this cartographer mentions the five strategic points for the French conquest of the Amazon. The translator of this work into English encourages the king of England to conquer the same territory.
Determination of map projection and prime meridian
For this determination, following the methodology proposed in Cintra (2012), we analyzed some technical elements that provide subsidies for further analysis. The first task consisted of measurements taken on this map, specifically on the network of meridians and parallels that is implicit in the two graduations; these geographical lines intersect at right angles, and the divisions of degrees in latitude and longitude are equal. This characterizes the projection known as Charter Square Flat (Plate Caree). This projection is the simplest and easiest to use, both at the time of construction and in the extraction of coordinates of points to figure them on a map with another type of projection. Then, to set the prime meridian, the longitude was extracted from well-defined points on the old map, in the coordinate system it uses, and also the coordinates of the same points in a current map, referred to Greenwich. The result is shown in Table 2.
In this Table, column "ID" refers to the identifier number of the landform; column "Name on the Map" transcribes the spelling of the site as contained in this cartographic document; column "Current Name" transcribes the spelling of the Atlas of the Encyclopedia Britannica (1974), the letter r after the name of the town in these two columns indicates the bar or mouth of a river in the Amazon; and the numbers 1 and 2 indicate that it is the first or second mouth of a given river. The remaining points are towns, villages, or coastal landforms. Values are expressed in degree and fraction of degree (decimal base), instead of being in degrees and minutes (sexagesimal base) to facilitate the calculation with those numbers in the spreadsheet. Column "λm" gives the longitude obtained from the old map, referred to the meridian of origin, which is to be determined. In this case, as can be seen, the count takes place toward the east, from 0º to 360º.
Column "λm,w" gives the longitude of the same point counting westward (w) from 0º to 180º; for this the calculation to be done is the subtraction of 360º from the value of λm. Column "λg" gives the longitude of the same location, obtained from a current map and thus referred to Greenwich. The last column gives λ0, which is the longitude of the origin of the ancient map referred to the Greenwich meridian. It is obtained through the equation λg = λ0 - λm,w.
If the old map were sufficiently accurate, it would be necessary to calculate this longitude of one point only, because all values are equal. In practice, this does not occur. The values differ from each other, and we have to calculate the mean and the standard deviation of the values. In Table 2, the average is -16.01º. Using this value, a current map can be searched for the location with this longitude. This is the origin point of the map. Another way to solve the problem is to compare this value with the longitude of the most frequently used point at the time as the origin of counting longitude. This origin can be determined by analyzing the maps of the Brazilian National Library (Biblioteca Nacional, 2013). For convenience, in Table 3, we list the locations that have a mean value nearest (-16.01º).
By comparing the mean (-16.01º) with the values of this Table, it is seen that the nearest location is the meridian of Santa Cruz de Tenerife, the capital of the Canary Islands, which indicates a very small error. However, the standard deviation of this map is 1.44º, indicating the fluctuation of values around the mean. Thus, the possibility exists that Sanson chose the Iron Island (Ilha do Ferro), according to a Louis XIII decree in 1634 establishing that this should be the prime meridian for all French maps. In this case it is seen that the difference between the mean and the longitude of that location is 2º, and this is explained by the standard deviation of the map and an error in the transfer of the longitude from the Iron Island to a point in Spanish America.
This transfer of coordinates was performed by estimating the direction and leagues traveled on the high sea, a procedure subject to many errors. There were several standards for the league, but the measurement used in the map under study was approximately 5.5 km. The first settlement that the ships touched was Cartagena de Indias, and from there it would be necessary to transfer the longitude to Lima and Quito. The errors in these operations were very large; for example, Pagan's map has an error of 7º in establishing the longitude of Quito (Cintra, 2011).
Determination of the cartographic map precision
The analysis proposed in this section aims to verify the precision of the map and indirectly the skill of the cartographer, placing it in his time. Ultimately, we try to verify the validity of La Condamine's statement that it is a "very defective map." The process of comparing coordinates also follows the methodology proposed by Cintra (2012) of extracting the geographic coordinates of that old map and of a current one using the program MapInfo (Pitney Bowes Software). The results are summarized in Table 4.
The first three columns have the meanings described in connection with the previous table. The next two columns refer to the latitude and longitude of Sanson's map: Фm and λm,g, respectively, the latter being referred to the Greenwich Meridian and given by the equation (1):

In this equation, λm is the longitude on the old map, 360º is the correction due to counting the direction to the east rather than to the west, and λ0 is the longitude of the prime meridian, referred to Greenwich (in this case, equal to -16.20º, for calculation purposes). In the two "Current Map" columns, the coordinates Фc and λc were extracted from a current map. The last two columns show the differences between the old map coordinates and the current ones, i.e., the errors in latitude and longitude, point by point, which allows the analysis below.
The mean of the differences in latitude indicates a systematic error of -0.31º and a standard deviation, indicative of the precision, of 0.67º, a similar value to those obtained by other good contemporary cartographers such as Pagan. For longitudes, we observed a relatively small systematic error of -0.23º. This is due to the fact that much of the error had already been removed when the prime meridian was fixed at 16.2º, a value very close to the systematic error (16.0º). The precision of this coordinate, with deviation of 1.44º, is slightly better than the one of the previous maps, such as the Count of Pagan's map, which has an average error of 1.93º (Cintra, 2011). In summary, the standard deviations of the two coordinates (0.67º and 1.44º) are equal to or better than those in maps considered scientific at the time.
The way the map was built
It is interesting to continue to analyze La Condamine's initial statement, now focusing on the section that states that this map was "based purely on historical account." There is no doubt that the expression "based purely on historical account" refers to Father Acuña's text, as indicated by a notation near the title of Sanson's map. What would this wise Frenchman mean by "based purely on historical account"? This expression may signify a text that includes names, texts, and other descriptive information, but not a text that contains scientific information such as coordinates (latitude and longitude) to allow drawing a map. In other words, "based purely on historical account" means "not scientific" or "unscientific," a term that should be understood in the context of La Condamine's life and time: the Enlightenment.
But precisely in this interpretation lies La Condamine's failure, since it is impossible for him not to have seen that Sanson's maps (Figure 1 and 2) have geographic coordinates (latitude and longitude). The question he should have raised is: How could this cartographer draw a map with coordinates (which points to a certain scientific method) starting from purely historical information? Would Sanson, a royal cartographer who had well-deserved prestige, have invented or created this data from scratch? In other words, the question is: How did Sanson determine latitudes and longitudes to build this map?
In order to answer to this question, it would have been necessary to read Father Acuña's account (1641) carefully and to observe that this Jesuit provides some data from observations he made himself; in particular, he provides the distances in leagues between several sites and the latitudes of some sites. It is little, but it is enough for anyone who intends to fully exploit these data, as was the case of the Count of Pagan. Indeed, in his account this Count presents a map made in the previous year, and states that "[to the Acuña's data] I decided to add the longitudes, which were adjusted as well as possible, from the confusion and uncertainty, all that for the sake of Geography" (Pagan, 1655, p.22). How did he simply decide to add the longitudes? How did he calculate them? A clue to this is the statement made in the first technical note at the end of the same book: "The doctrine of the eighth book of my Geometrical Theorems, printed in 1654 [shows that] the distances should always be taken on great circles (note that it is a technical expression)". This means that the earth is regarded as spherical, and the distance in leagues between one location and the next has been taken along a great circle. This allows one immediately to draw a triangle on the Earth, as in Figure 3, which reveals Pagan's methodology.
In this triangle, arc AB is the difference in longitude (∆λ), arc BC the difference in latitude (∆Ф), and arc AC (∆σ) the distance between the points transformed into angle; all arcs being measured along maximum circles and angle B, a right one. Under these conditions, one can apply spherical trigonometry, and by simplifying the mathematical expressions themselves according to angle B being a right one, this results in equation (2).

where: ∆λ is the difference of longitude being calculated; S is the distance between two consecutive points in leagues; ∆Ф is the difference in latitude between the same two points; and 20 is the number of leagues contained in 1 degree, a value adopted by Pagan (1655), based on the Spanish league at the time. Since 1 degree on the Earth is equivalent to 111 km, this means that a league is equivalent to 5.5 km, approximately.
The application of this methodology to the data of Acuña's account leads to the same values of the longitudes and latitudes present in the account and on Pagan's map, what is a strong indication that he used equation (2). On the other hand, it can be assumed that Sanson, the first astronomer of the king, knew the book and the map of the Count of Pagan (1655). These were dedicated to the king, who actually paid for the printing of the map. The king would probably have submitted the manuscript, even before printing, to Sanson's assessment, as the latter was the royal cartographer. Thus, it is no wonder that Sanson included the cartography of the Amazon River in his map of Peru (Figure 2), which is dated the year following Pagan's map, and that he himself made another map based on Acuña's account (Figure 1). After all, he had the same or better cartographic knowledge than Pagan.
Thus, one can say with relative certainty that Sanson used Pagan's method, based on the fact that starting from the same data (provided by Acuña), they reached very similar results, as can be seen by a visual comparison between Sanson's and Pagan's maps (Figure 4).
Indeed, the shape of the river is very similar in the two cartographic works if we disregard the interpretation that each author provides for the representation of points and intermediate curves between the locations indicated by Acuña. There are indeed large differences between other regions of the maps, which can be explained by the existence of different complementary sources of information for each author.
On the other hand, Acuña's data allow different interpretations. This Jesuit provides all the partial distances between consecutive locations from Quito to the estuary and also provides some subtotals. It turns out that the partial totals differ from the sum of the parts; in one particular case the distance provided by Acuña should be counted upstream and not downstream, and the text allows dual interpretation. Thus, to solve these inherent contradictions, each data interpreter must make some adjustment, which is conducted according to their own criteria. Furthermore, Pagan assessed correctly that the leagues covered between locations supplied by Acuña's account were exaggerated and calculated a reduction factor. This reduction factor results from the estimated distance between Quito and Belém do Pará. The calculation using the original data of Acuña results in 59.29º, but Pagan reduced this value to 37º. This latter value was estimated according to the total length from east to west of South America. From these two values, Pagan calculates a reduction factor: k = 37/59.29 = 0.624. Sanson, in turn, evaluated the difference in longitude between Quito and Belem as being 34.3º, resulting in k = 34.3/59.29 = 0.579. Both were wrong in this estimate because the actual value is 31.2º, but Sanson is closer to the correct value: his error is 3.1º, while Pagan's is 5.8º. Nonetheless, these estimates can be considered as very good for the time, since there was no practical method available for determining longitudes. Only after the astronomical measurements of Father Feuillée (1703) and Delisle's work (1720) we can count on correct estimates of this difference of longitudes (31.2º).
Benchmarking with the map of Pagan
To clarify the relationship between Pagan's and Sanson's maps and check how each one took advantage of Acuña's data, we constructed Figure 5. The background is a map by Sanson and the dashed red line is the interpretation of Pagan: the digitalized axis of the river is superimposed on Sanson's map. To perform a congruent comparison, the scales of both were normalized so that the distance or difference in longitude between Belém and Quito were the same; this was done by adjusting the length of the red line so that these two extremes coincide. A good coincidence of the axis of the river was observed, and the drawing of Pagan connects the points with practically straight segments, while Sanson softened the lines. Note also that there is a difference of interpretation of the text of Acuña, in the curve further south of the Amazon River (near longitude 310º), which leads to a shift in longitude of about 2º, compensated afterwards. The work by Acuña also allows the drawing in full line, specially made for this work, which causes a shift in longitude of about 1 º at the point of longitude 300º.
DISCUSSION
Cortesão (1965, p. 415-417) considers Pagan's map "the most remarkable of all the charts, not just of the Amazonas river, but of the whole of Amazon basin, drawn during the seventeenth century (...) taking advantage mainly [of the account] of Father Acuña, first established canvas of the meridians and parallels to scientifically situate the Amazon (...) and took full advantage of the geographic data supplied by the discoverers" (...). After stating cautiously "We suppose that the scientific cartography of Amazonas begins with the letter of the Count of Pagan," Cortesão concludes, "This most remarkable work already obeys a scientific criterion with very much scruple for the time and represents an effort to honor the geography of France". Although Cortesão does not disclose the methodology of Pagan, he recognizes its value as a scientific work. However, the results presented show that Sanson also established a network of meridians and parallels and took the data from Acuña as much as Pagan, using the same methodology with his own interpretation of the data, without simply copying the cartographic work.
In quantitative terms, as shown, the precision, measured by the standard deviation in longitude (the most critical coordinate) of the map by Sanson is 1.44º, better than the precision of the map by the Count of Pagan: 1.93º. One can be thorough by saying that for this same coordinate, the map by Father Fritz (1707) has precision of 1.00º (Cintra and Furtado, 2011) and even the map by La Condamine, due to the existence of an error of 3º in the mouth of the Napo River, has an average error of 1.14º (Cintra and Freitas, 2011). This occurred when he was working in 1744, some 80 years after Sanson and Pagan, and relying on advanced technology to determine longitudes, including the observations of Jupiter's satellites (with a luneta/telescope, with 18 feet of length), a good pendulum (clock), and calculations supported by the astronomical tables of Cassini.
There remains one point to discuss: Why did the later maps, as was shown, use Sanson's map and not Pagan's? This is explained by the fact that the two maps are practically contemporaneous (1655 and 1656), with no time for an exclusive disclosure of Pagan's statement, thus Sanson's version prevailed, as his position as astronomer, geographer, and royal cartographer lent the royal or official approval to his map.
CONCLUSION
The studies performed improved our knowledge on the subject and enhanced this important map of the Amazon River, which, along with Pagan's map constitutes the beginning of scientific cartography of the Amazonas. The analysis allowed us to determine the type of projection used (Plate Caree) and the most probable prime meridian: the island of Ferro in the Canaries. In terms of precision, it was shown that Sanson's map is even slightly better than Pagan's, which was considered by Jaime Cortesão as the best map of the region in the seventeenth century. Sanson's map presents a network of geographic coordinates, and he used a scientific method to determine the longitudes (resolution of spherical triangles). These coordinates are precise for the time. Thus, the statement of La Condamine that it is a very defective map based on purely historical narrative does not resist a deeper analysis. Perhaps this statement was a way to enhance his own work, as it downgrades the value of the previous work and does not take into account the conditions in which it was produced. It was a historic injustice, yet it was not challenged by anyone, and this work is expected to have contributed to repair it.
ACKNOWLEDGEMENTS
To the Fundação de Amparo à Pesquisa do Estado de São Paulo (FAPESP) for the undergraduate research grants (2011/02114-8 and 2011/01445-0) and to the Conselho Nacional de Desenvolvimento Científico e Tecnológico (CNPq) for the grant of the Universal Project of Research (477.182/2011-9): Historic Cartography of the Amazon River (1500-1750).
Recebido em 16/06/2013
Aceito em 29/10/2013
- Acuña, C. de. 1641. Nuevo descubrimiento del gran río de las Amazonas. Imprenta del Reyno, Madrid, 1641, 48p. (http://books.google.es/books?id=R28BAAAAQAAJ). Accessed on 31/07/2013.
- Biblioteca Nacional Digital do Brasil: Projeto Cartografia Histórica dos séculos XVI ao XVIII (http://www.bn.br/bndigital). Accessed on 31/07/2013.
- Britannica Atlas. 1974. Enc. Britannica, Helen Hemingway Benton pub., London, 1974.
- Cintra, J. P. 2012. Cartography and Historical Maps: techniques, applications and peculiarities. Revista Brasileira de Cartografia. Rio de Janeiro. Volume 64, n. 6, p.:901-918. (http://www.lsie.unb.br/rbc/index.php/rbc/article/view/578). Accessed on 31/07/2013.
- Cintra, J. P. 2011. Magni Amazoni Fluvii: o mapa do Conde de Pagan. In: Simpósio Brasileiro de Cartografia Histórica, 2011, Paraty. Anais do 1º Simpósio Brasileiro de Cartografia Histórica. Belo Horizonte: Centro de Referência em Cartografia Histórica UFMG, v.1. p.1 - 20. (https://www.ufmg.br/rededemuseus/crch/simposio/CINTRA_JORGE_PIMENTEL_1.pdf). Accessed on 31/07/2013.
- Cintra, J. P.; Freitas, J. C. 2011. Sailing down the Amazon River: La Condamine's Map. Survey Review, 43:550-566, (http://dx.doi.org/10.1179/003962611X13117748892119). Accessed on 31/07/2013.
- Cintra, J. P.; Furtado, J. F. 2011. A Carte de l'Amérique Méridionale de Bourguignon D'Anville: eixo perspectivo de uma cartografia amazônica comparada. Revista Brasileira de História, 31:273-316. (http://dx.doi.org/10.1590/S0102-01882011000200015). Accessed on 31/07/2013.
- Cortesão, J. 1965. História do Brasil nos velhos mapas. Tomo 1. Ministério das Relações Exteriores, Instituto Rio Branco, Rio de Janeiro, 1965, 436p.
- La Condamine, C.-M. de. 1745. Viagem na América meridional descendo o rio Amazonas. Editora do Senado Federal, Brasília, 2.000, 204p. (http://www.senado.gov.br/publicacoes/conselho/asp/pdfS.asp?COD_PUBLICACAO=83). Accessed on 31/07/2013.
- Pagan, B. F., Count of. 1655. Relation Historique et Géographique de la Grande Rivière des Amazones dans l' Amérique. Gardin Bensogne, Paris, 1655. English translation: An Historical & Geographical Description of the Country & River of the Amazones in America, by William Hamilton, London, 1660 (http://eebo.chadwyck.com). Accessed on 31/07/2013.
Publication Dates
-
Publication in this collection
19 May 2014 -
Date of issue
Sept 2014
History
-
Received
16 June 2013 -
Accepted
29 Oct 2013